Reports

- Global Locations -

Headquarters

Future Market Insights, Inc.

Christiana Corporate, 200
Continental Drive, Suite 401,
Newark, Delaware - 19713,
United States

T: +1-845-579-5705

Americas

Future Market Insights, Inc.

616 Corporate Way, Suite 2-9018,
Valley Cottage, NY 10989, United States

T: +1-347-918-3531

MEA

Future Market Insights

1602-6 Jumeirah Bay X2 Tower, Plot No: JLT-PH2-X2A,
Jumeirah Lakes Towers, Dubai,
United Arab Emirates

Europe

Future Market Insights

3rd Floor, 207 Regent Street,
W1B 3HH London
United Kingdom

T: + 44 (0) 20 8123 9659
D: +44 (0) 20 3287 4268

Asia Pacific

Future Market Insights

IndiaLand Global Tech Park, Unit UG-1, Behind Grand HighStreet, Phase 1, Hinjawadi, MH, Pune – 411057, India

On-The-Go Pots Market Outlook (2022-2032)

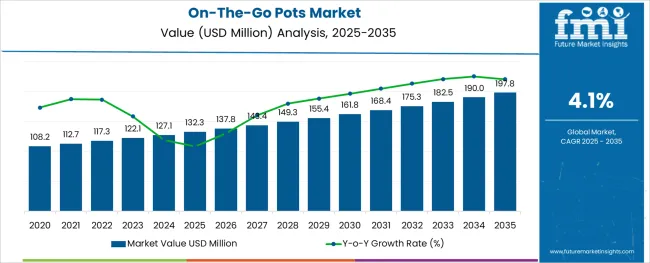
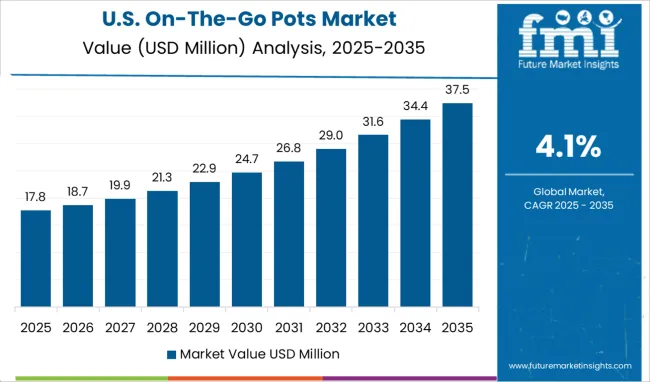
[324 Pages Report] The global on-the-go pots market is anticipated to be valued at US$ 117.3 in 2022, forecast to grow at a CAGR of 4.1% during the forecast period. The market is expected to project a revenue of US$ 175.3 Mn in 2032.

Attributes Details
On-The-Go Pots Market Size (2022) US$ 117.3 Mn
On-The-Go Pots Market Size (2032) US$ 175.3 Mn
On-The-Go Pots Market CAGR 4.1%

Excellent printing quality and sustainable material used to manufacture certain food packaging commodities surge the adoption of on-the-go pots. Increasing demand for recyclable, convenient, and innovative packaging for breakfast cereals by consumers increases demand for on-the-go pots.

The flexible packaging segment is expected to grow owing to enhanced ease of handling, thereby expanding the on-the-go pots market trends. An increase in the purchase and consumption of ready-to-eat food products, especially in developing economies, drives the sales of on-the-go pots.

Manufacturers are introducing sustainable packaging to retain the freshness of products further propels the global on-the-go pots market growth.

Don't pay for what you don't need

Customize your report by selecting specific countries or regions and save 30%!

What are the Key Features that Drive the On-The-Go Pots Market?

Portability and easy handling are important trends driving the sales of on-the-go pots. Adoption of on-the-go pots in the pharmaceutical, healthcare, food & beverage, and personal hygiene sectors increases owing to convenience and re-usability. Evolving and developing customer lifestyles in the thriving economy propels the demand for on-the-go pots.

The presence of several key players in the global market expands the on-the-go pots market size.

Oscillating consumer patterns in purchasing and buying habits in evolving lifestyles escalates the sales of on-the-go pots. The re-closable facility required for medicines such as tablets, syrups, and ointments broadens the global on-the-go pots market share.

The high demand for on-the-go pots by the growing trend of the retail packaging industry contributes to global market growth. Changing lifestyles and a growing population of women in the workforce aid in the expansion of the on-the-go pots market size. The growing landscape of the travel & tourism sector gives rise to the demand for on-the-go pots.

Smart packaging solutions are opted for by manufacturers owing to rapid urbanization elevating the sales of on-the-go pots. Growth and evolution of the beverage industry globally propel the adoption of on-the-go pots.

Transparent or see-through packaging for easy product identification enhances durability and security, thereby increasing the adoption of on-the-go pots. New designs and innovative solutions emerging across developing economies across the world escalate the sales of on-the-go pots. Eye-catching packaging in cosmetics and personal care products augments the beauty industry and elevates the demand for on-the-go pots.

What are the Restraints of the On-The-Go Pots Market?

The launch of lucrative packaging such as pouches and wraps as alternative packaging hinders the sales of on-the-go pots. Demand for on-the-go pots might be obstructed due to the weak distribution network of on-the-go products and few modes thereof across developing countries.

High costs associated with on-the-go food products, as opposed to traditional food product packaging, further curbs the adoption of on-the-go pots. Uncertainty created in the market in the consumers’ buying pattern owing to the lockdown restrictions thwarts the expansion of the on-the-go pots market size.

Rising environmental concerns and stringent regulations imposed on the disposal of plastics impede the sales of on-the-go pots. Prices of raw materials for beverage packaging fluctuating in the current economy restrains the growth of the on-the-go pots market size.

Ismail Sutaria
Ismail Sutaria

Principal Consultant

Talk to Analyst

Find your sweet spots for generating winning opportunities in this market.

What are the Scopes of the On-The-Go Pots Market?

Owing to the increasing consumption of dairy-based products, the on-the-go pots market size promises growth. Gifting, bulk orders, and corporate orders are a few of the many strategies that the on-the-go pots market share is implementing to enhance the market.

Manufacturers are innovating compostable and recyclable packaging to gain a competitive edge over other contemporaries to propel the sales of on-the-go pots. To cater to the minimalism trend across the world, manufacturers are developing packaging materials devoid of unnecessary materials and cluttered designs, further bolstering the demand for on-the-go pots.

Brands strengthening their online presence to acquire revenue opportunities via e-commerce and online stores bolsters the on-the-go pots market growth. Meal delivery chains are growing rapidly in economies around the world, demanding more recyclable and biodegradable packaging progresses the on-the-go pots market share.

New product development, as a strategic approach to manufacturing advanced on-the-go food packaging, further increases the adoption of on-the-go pots. Increasing health awareness about non-carcinogenic materials used for food packaging presents lucrative opportunities for manufacturers to develop eco-friendly packaging and further escalates the on-the-go pots market size. Prevailing demand for on-the-go snacks for the busy laborer presents a lucrative scope for manufacturers of the on-the-go pots market share.
Regional Analysis

How is the Performance of North America On-The-Go Pots Market?

North America is closely following the leading region, accumulating a revenue share of 17% in 2022. Both regions are expected to witness significant growth in the on-the-go pots market share owing to high demands for ready-to-eat packaged food & beverages.

These regions additionally provide better storage, along with warehouse facilities. They further develop materials that accommodate in extending the shelf life of perishable foods and beverages.

What is the Growth Outlook for the Asia Pacific On-The-Go Pots Market?

The Asia Pacific is anticipated to observe adequate growth owing to the rising popularity of on-the-go pots market trends. The developing economies in this region, resulting in a time crunch amongst the working population, surge demand for on-the-go pots foods and beverages, further propelling the global market growth.

Increasing disposable income, along with the availability of resources at affordable prices owing to rapid urbanisation, boosts the on-the-go pots market share.

Get the data you need at a Fraction of the cost

Personalize your report by choosing insights you need
and save 40%!

Startup Ecosystem

How is the Start-up Ecosystem in the On-The-Go Pots Market?

Rapidly growing demand for on-the-go products due to a tremendously busy lifestyle increases demand for on-the-go pots packaging. Lack of time to prepare and encase food owing to increasing work hours or managing one’s family contributes to the market growth. However, consumers are opting for packaging that is both sustainable and eco-friendly as a result of environmental degradation.

A lot of start-up companies in the on-the-go pots market share are hence inspired to inculcate the market with the most user-friendly packaging. Around, Fonkels, Onalytics, LaFabrica Craft, Paboco, etc. are amongst a few of the several start-up brands who are implementing various strategies such as zero smart waste containers, disposable packaging, smart keg packaging, paper bottles, etc. to expand and promote market growth.

What are the Key Developments of On-The-Go Pots Market?

Some of the key market players in the on-the-go pots market are Joseph Joseph Ltd., MIRON Violettglas BV., Packaging Mode Ltd., Victoria Packaging Ltd., H&K MÜLLER GMBH & CO. KG., Jamestrong Packaging., Berry Plastics, Bemis, Coveris, Amcor Plc, Oracle Packaging, Tetra Pak International S.A., Bericap Holding GmBH, Graham Packaging Company, Sigma Plastics Group, Sonoco Products Company, Sealed Air Corporation, Smurfit Kappa Group, DS Smith Plc, Mondi Group Plc, WestRock Company, International Paper Company, Coveris Holdings S.A., Huhtamäki Oyj, Winpak Ltd., Schur Flexibles Holding GesmbH, Hood Packaging, Novolex, Pregis, Proampac, Scholle IPN, Printpack, 0020Oracle Packaging, WestRock, Winpak, Tetra Laval International S.A., Coveris Holdings S.A., Georgia-Pacific LLC, Linpac Packaging Ltd, Constantia Flexibles Group GmbH, Reynolds Group Holdings Ltd., Clondalkin Group Holdings B.V., Around, Fonkels, Onalytics, LaFabrica Craft, Paboco, etc.

Complying with “Go Green” campaigns around the world, with increasing awareness about environmental issues – key manufacturers are tirelessly working on producing eco-friendly packaging for food, beverage and even cosmetic products. Along with research and development by these brands, celebrity endorsements further contribute in propelling the on-the-go-pots market growth.

Some of the recent developments in the on-the-go pots market are

  • In January 2018, to include an oatmeal-based product that was marketed as an on-the-go breakfasting option - The GFB: Gluten Free Bar, a U.S.-based gluten-free snack producer extended its line and packaging options.
  • In September 2015, a metal-free packaging product called ‘AmLite’ was launched by Amcor Limited.
  • In April 2016, Bemis Company completed the acquisition of SteriPack Packaging Operation, which is a provider of medical device packaging operations and related value-added services.
  • In December 2016, Amcor Limited announced an advanced packaging system called “Vento Coffee”.

Scope of Report

Report Attribute Details
Growth Rate CAGR of 4.1% from 2022 to 2032
Base year for estimation 2021
Historical data 2015 - 2020
Forecast period 2022 - 2032
Quantitative units Revenue in USD million and CAGR from 2022 to 2032
Report coverage Revenue forecast, volume forecast, company ranking, competitive landscape, growth factors, and trends, Pricing Analysis,
Segments covered Types, Application, and Region
Regional scope North America; Western Europe, Eastern Europe, Middle East, Africa, ASEAN, South Asia, Rest of Asia, Australia and New Zealand
Country scope USA; Canada; Mexico; Germany; UK; France; Italy; Spain; Russia; Belgium; Poland; Czech Republic; China; India; Japan; Australia; Brazil; Argentina; Colombia; Saudi Arabia; UAE; Iran; South Africa
Key companies profiled Joseph Joseph Ltd., MIRON Violettglas BV., Packaging Mode Ltd., Victoria Packaging Ltd., H&K MÜLLER GMBH & CO. KG., Jamestrong Packaging., Berry Plastics, Bemis, Coveris, Amcor Plc, Oracle Packaging, Tetra Pak International S.A., Bericap Holding GmBH, Graham Packaging Company, Sigma Plastics Group, Sonoco Products Company, Sealed Air Corporation, Smurfit Kappa Group, DS Smith Plc, Mondi Group Plc, WestRock Company, International Paper Company, Coveris Holdings S.A., Huhtamäki Oyj, Winpak Ltd., Schur Flexibles Holding GesmbH, Hood Packaging, Novolex, Pregis, Proampac, Scholle IPN, Printpack, 0020Oracle Packaging, WestRock, Winpak, Tetra Laval International S.A., Coveris Holdings S.A., Georgia-Pacific LLC, Linpac Packaging Ltd, Constantia Flexibles Group GmbH, Reynolds Group Holdings Ltd., Clondalkin Group Holdings B.V., Around, Fonkels, Onalytics, LaFabrica Craft, Paboco, etc.
Customization scope Free report customization (equivalent to up to 8 analysts working days) with purchase. Addition or alteration to country, regional & segment scope.
Pricing and purchase options Avail customized purchase options to meet your exact research needs.

Frequently Asked Questions

How much CAGR can be Estimated for the On-The-Go Pots Market?

The on-the-go pots market is likely to garner a CAGR of 4.1% during the forecast period.

What is the Leading Regional Market of On-The-Go Pots?

Europe is the leading on-the-go pots market.

What will be the Size of the On-The-Go Pots Market by 2032?

By 2032, the market is likely to grow to a valuation of US$ 175.3 Mn.

Table of Content

1. Executive Summary

    1.1. Global Market Outlook

    1.2. Demand-side Trends

    1.3. Supply-side Trends

    1.4. Technology Roadmap Analysis

    1.5. Analysis and Recommendations

2. Market Overview

    2.1. Market Coverage / Taxonomy

    2.2. Market Definition / Scope / Limitations

3. Market Background

    3.1. Market Dynamics

        3.1.1. Drivers

        3.1.2. Restraints

        3.1.3. Opportunity

        3.1.4. Trends

    3.2. Scenario Forecast

        3.2.1. Demand in Optimistic Scenario

        3.2.2. Demand in Likely Scenario

        3.2.3. Demand in Conservative Scenario

    3.3. Opportunity Map Analysis

    3.4. Product Life Cycle Analysis

    3.5. Supply Chain Analysis

        3.5.1. Supply Side Participants and their Roles

            3.5.1.1. Producers

            3.5.1.2. Mid-Level Participants (Traders/ Agents/ Brokers)

            3.5.1.3. Wholesalers and Distributors

        3.5.2. Value Added and Value Created at Node in the Supply Chain

        3.5.3. List of Raw Material Suppliers

        3.5.4. List of Existing and Potential Buyer’s

    3.6. Investment Feasibility Matrix

    3.7. Value Chain Analysis

        3.7.1. Profit Margin Analysis

        3.7.2. Wholesalers and Distributors

        3.7.3. Retailers

    3.8. PESTLE and Porter’s Analysis

    3.9. Regulatory Landscape

        3.9.1. By Key Regions

        3.9.2. By Key Countries

    3.10. Regional Parent Market Outlook

    3.11. Production and Consumption Statistics

    3.12. Import and Export Statistics

4. Global On-The-Go Pots Market Analysis 2017-2021 and Forecast, 2022-2032

    4.1. Historical Market Size Value (US$ Mn) & Volume (Units) Analysis, 2017-2021

    4.2. Current and Future Market Size Value (US$ Mn) & Volume (Units) Projections, 2022-2032

        4.2.1. Y-o-Y Growth Trend Analysis

        4.2.2. Absolute $ Opportunity Analysis

5. Global On-The-Go Pots Market Analysis 2017-2021 and Forecast 2022-2032, By Material Type

    5.1. Introduction / Key Findings

    5.2. Historical Market Size Value (US$ Mn) & Volume (Units) Analysis By Material Type, 2017-2021

    5.3. Current and Future Market Size Value (US$ Mn) & Volume (Units) Analysis and Forecast By Material Type, 2022-2032

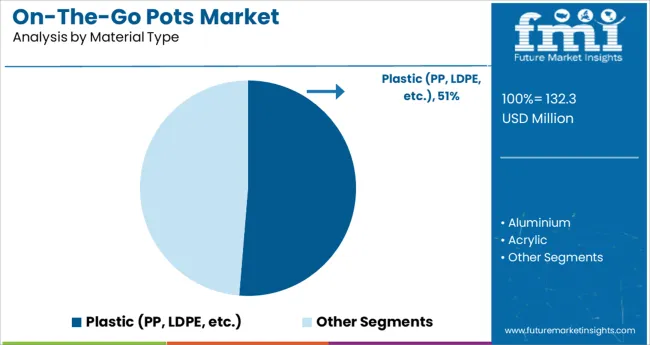
        5.3.1. Plastic (PP, LDPE, etc.)

        5.3.2. Aluminium

        5.3.3. Acrylic

        5.3.4. Others

    5.4. Y-o-Y Growth Trend Analysis By Material Type, 2017-2021

    5.5. Absolute $ Opportunity Analysis By Material Type, 2022-2032

6. Global On-The-Go Pots Market Analysis 2017-2021 and Forecast 2022-2032, By Capacity Type

    6.1. Introduction / Key Findings

    6.2. Historical Market Size Value (US$ Mn) & Volume (Units) Analysis By Capacity Type, 2017-2021

    6.3. Current and Future Market Size Value (US$ Mn) & Volume (Units) Analysis and Forecast By Capacity Type, 2022-2032

        6.3.1. Small ( 20 grams - 100 grams)

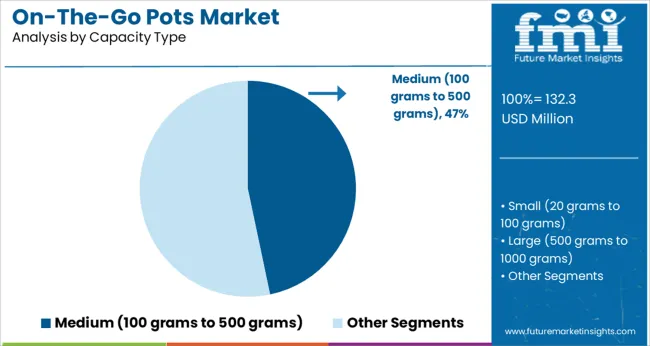
        6.3.2. Medium ( 100 grams - 500 grams)

        6.3.3. Large ( 500 grams - 1000 grams)

        6.3.4. Others ( >1000 grams)

    6.4. Y-o-Y Growth Trend Analysis By Capacity Type, 2017-2021

    6.5. Absolute $ Opportunity Analysis By Capacity Type, 2022-2032

7. Global On-The-Go Pots Market Analysis 2017-2021 and Forecast 2022-2032, By End Use

    7.1. Introduction / Key Findings

    7.2. Historical Market Size Value (US$ Mn) & Volume (Units) Analysis By End Use, 2017-2021

    7.3. Current and Future Market Size Value (US$ Mn) & Volume (Units) Analysis and Forecast By End Use, 2022-2032

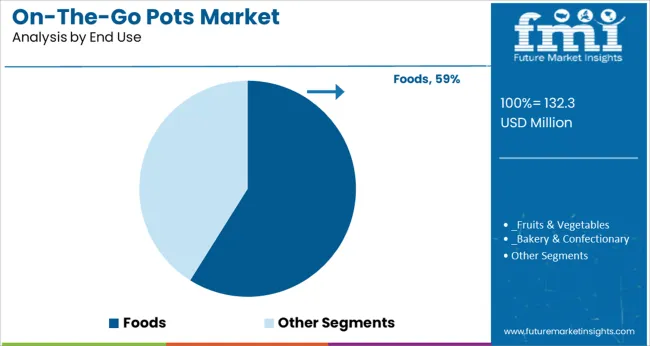
        7.3.1. Foods

            7.3.1.1. Fruits & Vegetables

            7.3.1.2. Bakery & Confectionary

            7.3.1.3. Meat & Seafood

            7.3.1.4. Others (Biscuits & Cookies, etc.)

        7.3.2. Beverages

            7.3.2.1. Yogurt

            7.3.2.2. Buttermilk

            7.3.2.3. Flavoured Fruit Juice

        7.3.3. Cosmetics & Personal Care

    7.4. Y-o-Y Growth Trend Analysis By End Use, 2017-2021

    7.5. Absolute $ Opportunity Analysis By End Use, 2022-2032

8. Global On-The-Go Pots Market Analysis 2017-2021 and Forecast 2022-2032, By Region

    8.1. Introduction

    8.2. Historical Market Size Value (US$ Mn) & Volume (Units) Analysis By Region, 2017-2021

    8.3. Current Market Size Value (US$ Mn) & Volume (Units) Analysis and Forecast By Region, 2022-2032

        8.3.1. North America

        8.3.2. Latin America

        8.3.3. Europe

        8.3.4. Asia Pacific

        8.3.5. MEA

    8.4. Market Attractiveness Analysis By Region

9. North America On-The-Go Pots Market Analysis 2017-2021 and Forecast 2022-2032, By Country

    9.1. Historical Market Size Value (US$ Mn) & Volume (Units) Trend Analysis By Market Taxonomy, 2017-2021

    9.2. Market Size Value (US$ Mn) & Volume (Units) Forecast By Market Taxonomy, 2022-2032

        9.2.1. By Country

            9.2.1.1. U.S.

            9.2.1.2. Canada

        9.2.2. By Material Type

        9.2.3. By Capacity Type

        9.2.4. By End Use

    9.3. Market Attractiveness Analysis

        9.3.1. By Country

        9.3.2. By Material Type

        9.3.3. By Capacity Type

        9.3.4. By End Use

    9.4. Key Takeaways

10. Latin America On-The-Go Pots Market Analysis 2017-2021 and Forecast 2022-2032, By Country

    10.1. Historical Market Size Value (US$ Mn) & Volume (Units) Trend Analysis By Market Taxonomy, 2017-2021

    10.2. Market Size Value (US$ Mn) & Volume (Units) Forecast By Market Taxonomy, 2022-2032

        10.2.1. By Country

            10.2.1.1. Brazil

            10.2.1.2. Mexico

            10.2.1.3. Rest of Latin America

        10.2.2. By Material Type

        10.2.3. By Capacity Type

        10.2.4. By End Use

    10.3. Market Attractiveness Analysis

        10.3.1. By Country

        10.3.2. By Material Type

        10.3.3. By Capacity Type

        10.3.4. By End Use

    10.4. Key Takeaways

11. Europe On-The-Go Pots Market Analysis 2017-2021 and Forecast 2022-2032, By Country

    11.1. Historical Market Size Value (US$ Mn) & Volume (Units) Trend Analysis By Market Taxonomy, 2017-2021

    11.2. Market Size Value (US$ Mn) & Volume (Units) Forecast By Market Taxonomy, 2022-2032

        11.2.1. By Country

            11.2.1.1. Germany

            11.2.1.2. U.K.

            11.2.1.3. France

            11.2.1.4. Spain

            11.2.1.5. Italy

            11.2.1.6. Rest of Europe

        11.2.2. By Material Type

        11.2.3. By Capacity Type

        11.2.4. By End Use

    11.3. Market Attractiveness Analysis

        11.3.1. By Country

        11.3.2. By Material Type

        11.3.3. By Capacity Type

        11.3.4. By End Use

    11.4. Key Takeaways

12. Asia Pacific On-The-Go Pots Market Analysis 2017-2021 and Forecast 2022-2032, By Country

    12.1. Historical Market Size Value (US$ Mn) & Volume (Units) Trend Analysis By Market Taxonomy, 2017-2021

    12.2. Market Size Value (US$ Mn) & Volume (Units) Forecast By Market Taxonomy, 2022-2032

        12.2.1. By Country

            12.2.1.1. China

            12.2.1.2. Japan

            12.2.1.3. South Korea

            12.2.1.4. Malaysia

            12.2.1.5. Singapore

            12.2.1.6. Australia

            12.2.1.7. New Zealand

            12.2.1.8. Rest of APAC

        12.2.2. By Material Type

        12.2.3. By Capacity Type

        12.2.4. By End Use

    12.3. Market Attractiveness Analysis

        12.3.1. By Country

        12.3.2. By Material Type

        12.3.3. By Capacity Type

        12.3.4. By End Use

    12.4. Key Takeaways

13. MEA On-The-Go Pots Market Analysis 2017-2021 and Forecast 2022-2032, By Country

    13.1. Historical Market Size Value (US$ Mn) & Volume (Units) Trend Analysis By Market Taxonomy, 2017-2021

    13.2. Market Size Value (US$ Mn) & Volume (Units) Forecast By Market Taxonomy, 2022-2032

        13.2.1. By Country

            13.2.1.1. GCC Countries

            13.2.1.2. South Africa

            13.2.1.3. Israel

            13.2.1.4. Rest of MEA

        13.2.2. By Material Type

        13.2.3. By Capacity Type

        13.2.4. By End Use

    13.3. Market Attractiveness Analysis

        13.3.1. By Country

        13.3.2. By Material Type

        13.3.3. By Capacity Type

        13.3.4. By End Use

    13.4. Key Takeaways

14. Key Countries On-The-Go Pots Market Analysis

    14.1. U.S.

        14.1.1. Pricing Analysis

        14.1.2. Market Share Analysis, 2021

            14.1.2.1. By Material Type

            14.1.2.2. By Capacity Type

            14.1.2.3. By End Use

    14.2. Canada

        14.2.1. Pricing Analysis

        14.2.2. Market Share Analysis, 2021

            14.2.2.1. By Material Type

            14.2.2.2. By Capacity Type

            14.2.2.3. By End Use

    14.3. Brazil

        14.3.1. Pricing Analysis

        14.3.2. Market Share Analysis, 2021

            14.3.2.1. By Material Type

            14.3.2.2. By Capacity Type

            14.3.2.3. By End Use

    14.4. Mexico

        14.4.1. Pricing Analysis

        14.4.2. Market Share Analysis, 2021

            14.4.2.1. By Material Type

            14.4.2.2. By Capacity Type

            14.4.2.3. By End Use

    14.5. Germany

        14.5.1. Pricing Analysis

        14.5.2. Market Share Analysis, 2021

            14.5.2.1. By Material Type

            14.5.2.2. By Capacity Type

            14.5.2.3. By End Use

    14.6. U.K.

        14.6.1. Pricing Analysis

        14.6.2. Market Share Analysis, 2021

            14.6.2.1. By Material Type

            14.6.2.2. By Capacity Type

            14.6.2.3. By End Use

    14.7. France

        14.7.1. Pricing Analysis

        14.7.2. Market Share Analysis, 2021

            14.7.2.1. By Material Type

            14.7.2.2. By Capacity Type

            14.7.2.3. By End Use

    14.8. Spain

        14.8.1. Pricing Analysis

        14.8.2. Market Share Analysis, 2021

            14.8.2.1. By Material Type

            14.8.2.2. By Capacity Type

            14.8.2.3. By End Use

    14.9. Italy

        14.9.1. Pricing Analysis

        14.9.2. Market Share Analysis, 2021

            14.9.2.1. By Material Type

            14.9.2.2. By Capacity Type

            14.9.2.3. By End Use

    14.10. China

        14.10.1. Pricing Analysis

        14.10.2. Market Share Analysis, 2021

            14.10.2.1. By Material Type

            14.10.2.2. By Capacity Type

            14.10.2.3. By End Use

    14.11. Japan

        14.11.1. Pricing Analysis

        14.11.2. Market Share Analysis, 2021

            14.11.2.1. By Material Type

            14.11.2.2. By Capacity Type

            14.11.2.3. By End Use

    14.12. South Korea

        14.12.1. Pricing Analysis

        14.12.2. Market Share Analysis, 2021

            14.12.2.1. By Material Type

            14.12.2.2. By Capacity Type

            14.12.2.3. By End Use

    14.13. Malaysia

        14.13.1. Pricing Analysis

        14.13.2. Market Share Analysis, 2021

            14.13.2.1. By Material Type

            14.13.2.2. By Capacity Type

            14.13.2.3. By End Use

    14.14. Singapore

        14.14.1. Pricing Analysis

        14.14.2. Market Share Analysis, 2021

            14.14.2.1. By Material Type

            14.14.2.2. By Capacity Type

            14.14.2.3. By End Use

    14.15. Australia

        14.15.1. Pricing Analysis

        14.15.2. Market Share Analysis, 2021

            14.15.2.1. By Material Type

            14.15.2.2. By Capacity Type

            14.15.2.3. By End Use

    14.16. New Zealand

        14.16.1. Pricing Analysis

        14.16.2. Market Share Analysis, 2021

            14.16.2.1. By Material Type

            14.16.2.2. By Capacity Type

            14.16.2.3. By End Use

    14.17. GCC Countries

        14.17.1. Pricing Analysis

        14.17.2. Market Share Analysis, 2021

            14.17.2.1. By Material Type

            14.17.2.2. By Capacity Type

            14.17.2.3. By End Use

    14.18. South Africa

        14.18.1. Pricing Analysis

        14.18.2. Market Share Analysis, 2021

            14.18.2.1. By Material Type

            14.18.2.2. By Capacity Type

            14.18.2.3. By End Use

    14.19. Israel

        14.19.1. Pricing Analysis

        14.19.2. Market Share Analysis, 2021

            14.19.2.1. By Material Type

            14.19.2.2. By Capacity Type

            14.19.2.3. By End Use

15. Market Structure Analysis

    15.1. Competition Dashboard

    15.2. Competition Benchmarking

    15.3. Market Share Analysis of Top Players

        15.3.1. By Regional

        15.3.2. By Material Type

        15.3.3. By Capacity Type

        15.3.4. By End Use

16. Competition Analysis

    16.1. Competition Deep Dive

        16.1.1. Joseph Ltd

            16.1.1.1. Overview

            16.1.1.2. Product Portfolio

            16.1.1.3. Profitability by Market Segments

            16.1.1.4. Sales Footprint

            16.1.1.5. Strategy Overview

                16.1.1.5.1. Marketing Strategy

                16.1.1.5.2. Product Strategy

                16.1.1.5.3. Channel Strategy

        16.1.2. MIRON Violettglas BV

            16.1.2.1. Overview

            16.1.2.2. Product Portfolio

            16.1.2.3. Profitability by Market Segments

            16.1.2.4. Sales Footprint

            16.1.2.5. Strategy Overview

                16.1.2.5.1. Marketing Strategy

                16.1.2.5.2. Product Strategy

                16.1.2.5.3. Channel Strategy

        16.1.3. Packaging Mode Ltd

            16.1.3.1. Overview

            16.1.3.2. Product Portfolio

            16.1.3.3. Profitability by Market Segments

            16.1.3.4. Sales Footprint

            16.1.3.5. Strategy Overview

                16.1.3.5.1. Marketing Strategy

                16.1.3.5.2. Product Strategy

                16.1.3.5.3. Channel Strategy

        16.1.4. Victoria Packaging Ltd

            16.1.4.1. Overview

            16.1.4.2. Product Portfolio

            16.1.4.3. Profitability by Market Segments

            16.1.4.4. Sales Footprint

            16.1.4.5. Strategy Overview

                16.1.4.5.1. Marketing Strategy

                16.1.4.5.2. Product Strategy

                16.1.4.5.3. Channel Strategy

        16.1.5. H&K MÜLLER GMBH

            16.1.5.1. Overview

            16.1.5.2. Product Portfolio

            16.1.5.3. Profitability by Market Segments

            16.1.5.4. Sales Footprint

            16.1.5.5. Strategy Overview

                16.1.5.5.1. Marketing Strategy

                16.1.5.5.2. Product Strategy

                16.1.5.5.3. Channel Strategy

        16.1.6. Jamestrong Packaging

            16.1.6.1. Overview

            16.1.6.2. Product Portfolio

            16.1.6.3. Profitability by Market Segments

            16.1.6.4. Sales Footprint

            16.1.6.5. Strategy Overview

                16.1.6.5.1. Marketing Strategy

                16.1.6.5.2. Product Strategy

                16.1.6.5.3. Channel Strategy

17. Assumptions & Acronyms Used

18. Research Methodology

Don't pay for what you don't need

Customize your report by selecting specific countries or regions and save 30%!

List of Tables

Table 1: Global On-The-Go Pots Market Value (US$ Mn) Forecast by Region, 2017-2032

Table 2: Global On-The-Go Pots Market Volume (Units) Forecast by Region, 2017-2032

Table 3: Global On-The-Go Pots Market Value (US$ Mn) Forecast by Material Type, 2017-2032

Table 4: Global On-The-Go Pots Market Volume (Units) Forecast by Material Type, 2017-2032

Table 5: Global On-The-Go Pots Market Value (US$ Mn) Forecast by Capacity Type, 2017-2032

Table 6: Global On-The-Go Pots Market Volume (Units) Forecast by Capacity Type, 2017-2032

Table 7: Global On-The-Go Pots Market Value (US$ Mn) Forecast by End Use, 2017-2032

Table 8: Global On-The-Go Pots Market Volume (Units) Forecast by End Use, 2017-2032

Table 9: North America On-The-Go Pots Market Value (US$ Mn) Forecast by Country, 2017-2032

Table 10: North America On-The-Go Pots Market Volume (Units) Forecast by Country, 2017-2032

Table 11: North America On-The-Go Pots Market Value (US$ Mn) Forecast by Material Type, 2017-2032

Table 12: North America On-The-Go Pots Market Volume (Units) Forecast by Material Type, 2017-2032

Table 13: North America On-The-Go Pots Market Value (US$ Mn) Forecast by Capacity Type, 2017-2032

Table 14: North America On-The-Go Pots Market Volume (Units) Forecast by Capacity Type, 2017-2032

Table 15: North America On-The-Go Pots Market Value (US$ Mn) Forecast by End Use, 2017-2032

Table 16: North America On-The-Go Pots Market Volume (Units) Forecast by End Use, 2017-2032

Table 17: Latin America On-The-Go Pots Market Value (US$ Mn) Forecast by Country, 2017-2032

Table 18: Latin America On-The-Go Pots Market Volume (Units) Forecast by Country, 2017-2032

Table 19: Latin America On-The-Go Pots Market Value (US$ Mn) Forecast by Material Type, 2017-2032

Table 20: Latin America On-The-Go Pots Market Volume (Units) Forecast by Material Type, 2017-2032

Table 21: Latin America On-The-Go Pots Market Value (US$ Mn) Forecast by Capacity Type, 2017-2032

Table 22: Latin America On-The-Go Pots Market Volume (Units) Forecast by Capacity Type, 2017-2032

Table 23: Latin America On-The-Go Pots Market Value (US$ Mn) Forecast by End Use, 2017-2032

Table 24: Latin America On-The-Go Pots Market Volume (Units) Forecast by End Use, 2017-2032

Table 25: Europe On-The-Go Pots Market Value (US$ Mn) Forecast by Country, 2017-2032

Table 26: Europe On-The-Go Pots Market Volume (Units) Forecast by Country, 2017-2032

Table 27: Europe On-The-Go Pots Market Value (US$ Mn) Forecast by Material Type, 2017-2032

Table 28: Europe On-The-Go Pots Market Volume (Units) Forecast by Material Type, 2017-2032

Table 29: Europe On-The-Go Pots Market Value (US$ Mn) Forecast by Capacity Type, 2017-2032

Table 30: Europe On-The-Go Pots Market Volume (Units) Forecast by Capacity Type, 2017-2032

Table 31: Europe On-The-Go Pots Market Value (US$ Mn) Forecast by End Use, 2017-2032

Table 32: Europe On-The-Go Pots Market Volume (Units) Forecast by End Use, 2017-2032

Table 33: Asia Pacific On-The-Go Pots Market Value (US$ Mn) Forecast by Country, 2017-2032

Table 34: Asia Pacific On-The-Go Pots Market Volume (Units) Forecast by Country, 2017-2032

Table 35: Asia Pacific On-The-Go Pots Market Value (US$ Mn) Forecast by Material Type, 2017-2032

Table 36: Asia Pacific On-The-Go Pots Market Volume (Units) Forecast by Material Type, 2017-2032

Table 37: Asia Pacific On-The-Go Pots Market Value (US$ Mn) Forecast by Capacity Type, 2017-2032

Table 38: Asia Pacific On-The-Go Pots Market Volume (Units) Forecast by Capacity Type, 2017-2032

Table 39: Asia Pacific On-The-Go Pots Market Value (US$ Mn) Forecast by End Use, 2017-2032

Table 40: Asia Pacific On-The-Go Pots Market Volume (Units) Forecast by End Use, 2017-2032

Table 41: MEA On-The-Go Pots Market Value (US$ Mn) Forecast by Country, 2017-2032

Table 42: MEA On-The-Go Pots Market Volume (Units) Forecast by Country, 2017-2032

Table 43: MEA On-The-Go Pots Market Value (US$ Mn) Forecast by Material Type, 2017-2032

Table 44: MEA On-The-Go Pots Market Volume (Units) Forecast by Material Type, 2017-2032

Table 45: MEA On-The-Go Pots Market Value (US$ Mn) Forecast by Capacity Type, 2017-2032

Table 46: MEA On-The-Go Pots Market Volume (Units) Forecast by Capacity Type, 2017-2032

Table 47: MEA On-The-Go Pots Market Value (US$ Mn) Forecast by End Use, 2017-2032

Table 48: MEA On-The-Go Pots Market Volume (Units) Forecast by End Use, 2017-2032
Ismail Sutaria
Ismail Sutaria

Principal Consultant

Talk to Analyst

Find your sweet spots for generating winning opportunities in this market.

List of Charts

Figure 1: Global On-The-Go Pots Market Value (US$ Mn) by Material Type, 2022-2032

Figure 2: Global On-The-Go Pots Market Value (US$ Mn) by Capacity Type, 2022-2032

Figure 3: Global On-The-Go Pots Market Value (US$ Mn) by End Use, 2022-2032

Figure 4: Global On-The-Go Pots Market Value (US$ Mn) by Region, 2022-2032

Figure 5: Global On-The-Go Pots Market Value (US$ Mn) Analysis by Region, 2017-2032

Figure 6: Global On-The-Go Pots Market Volume (Units) Analysis by Region, 2017-2032

Figure 7: Global On-The-Go Pots Market Value Share (%) and BPS Analysis by Region, 2022-2032

Figure 8: Global On-The-Go Pots Market Y-o-Y Growth (%) Projections by Region, 2022-2032

Figure 9: Global On-The-Go Pots Market Value (US$ Mn) Analysis by Material Type, 2017-2032

Figure 10: Global On-The-Go Pots Market Volume (Units) Analysis by Material Type, 2017-2032

Figure 11: Global On-The-Go Pots Market Value Share (%) and BPS Analysis by Material Type, 2022-2032

Figure 12: Global On-The-Go Pots Market Y-o-Y Growth (%) Projections by Material Type, 2022-2032

Figure 13: Global On-The-Go Pots Market Value (US$ Mn) Analysis by Capacity Type, 2017-2032

Figure 14: Global On-The-Go Pots Market Volume (Units) Analysis by Capacity Type, 2017-2032

Figure 15: Global On-The-Go Pots Market Value Share (%) and BPS Analysis by Capacity Type, 2022-2032

Figure 16: Global On-The-Go Pots Market Y-o-Y Growth (%) Projections by Capacity Type, 2022-2032

Figure 17: Global On-The-Go Pots Market Value (US$ Mn) Analysis by End Use, 2017-2032

Figure 18: Global On-The-Go Pots Market Volume (Units) Analysis by End Use, 2017-2032

Figure 19: Global On-The-Go Pots Market Value Share (%) and BPS Analysis by End Use, 2022-2032

Figure 20: Global On-The-Go Pots Market Y-o-Y Growth (%) Projections by End Use, 2022-2032

Figure 21: Global On-The-Go Pots Market Attractiveness by Material Type, 2022-2032

Figure 22: Global On-The-Go Pots Market Attractiveness by Capacity Type, 2022-2032

Figure 23: Global On-The-Go Pots Market Attractiveness by End Use, 2022-2032

Figure 24: Global On-The-Go Pots Market Attractiveness by Region, 2022-2032

Figure 25: North America On-The-Go Pots Market Value (US$ Mn) by Material Type, 2022-2032

Figure 26: North America On-The-Go Pots Market Value (US$ Mn) by Capacity Type, 2022-2032

Figure 27: North America On-The-Go Pots Market Value (US$ Mn) by End Use, 2022-2032

Figure 28: North America On-The-Go Pots Market Value (US$ Mn) by Country, 2022-2032

Figure 29: North America On-The-Go Pots Market Value (US$ Mn) Analysis by Country, 2017-2032

Figure 30: North America On-The-Go Pots Market Volume (Units) Analysis by Country, 2017-2032

Figure 31: North America On-The-Go Pots Market Value Share (%) and BPS Analysis by Country, 2022-2032

Figure 32: North America On-The-Go Pots Market Y-o-Y Growth (%) Projections by Country, 2022-2032

Figure 33: North America On-The-Go Pots Market Value (US$ Mn) Analysis by Material Type, 2017-2032

Figure 34: North America On-The-Go Pots Market Volume (Units) Analysis by Material Type, 2017-2032

Figure 35: North America On-The-Go Pots Market Value Share (%) and BPS Analysis by Material Type, 2022-2032

Figure 36: North America On-The-Go Pots Market Y-o-Y Growth (%) Projections by Material Type, 2022-2032

Figure 37: North America On-The-Go Pots Market Value (US$ Mn) Analysis by Capacity Type, 2017-2032

Figure 38: North America On-The-Go Pots Market Volume (Units) Analysis by Capacity Type, 2017-2032

Figure 39: North America On-The-Go Pots Market Value Share (%) and BPS Analysis by Capacity Type, 2022-2032

Figure 40: North America On-The-Go Pots Market Y-o-Y Growth (%) Projections by Capacity Type, 2022-2032

Figure 41: North America On-The-Go Pots Market Value (US$ Mn) Analysis by End Use, 2017-2032

Figure 42: North America On-The-Go Pots Market Volume (Units) Analysis by End Use, 2017-2032

Figure 43: North America On-The-Go Pots Market Value Share (%) and BPS Analysis by End Use, 2022-2032

Figure 44: North America On-The-Go Pots Market Y-o-Y Growth (%) Projections by End Use, 2022-2032

Figure 45: North America On-The-Go Pots Market Attractiveness by Material Type, 2022-2032

Figure 46: North America On-The-Go Pots Market Attractiveness by Capacity Type, 2022-2032

Figure 47: North America On-The-Go Pots Market Attractiveness by End Use, 2022-2032

Figure 48: North America On-The-Go Pots Market Attractiveness by Country, 2022-2032

Figure 49: Latin America On-The-Go Pots Market Value (US$ Mn) by Material Type, 2022-2032

Figure 50: Latin America On-The-Go Pots Market Value (US$ Mn) by Capacity Type, 2022-2032

Figure 51: Latin America On-The-Go Pots Market Value (US$ Mn) by End Use, 2022-2032

Figure 52: Latin America On-The-Go Pots Market Value (US$ Mn) by Country, 2022-2032

Figure 53: Latin America On-The-Go Pots Market Value (US$ Mn) Analysis by Country, 2017-2032

Figure 54: Latin America On-The-Go Pots Market Volume (Units) Analysis by Country, 2017-2032

Figure 55: Latin America On-The-Go Pots Market Value Share (%) and BPS Analysis by Country, 2022-2032

Figure 56: Latin America On-The-Go Pots Market Y-o-Y Growth (%) Projections by Country, 2022-2032

Figure 57: Latin America On-The-Go Pots Market Value (US$ Mn) Analysis by Material Type, 2017-2032

Figure 58: Latin America On-The-Go Pots Market Volume (Units) Analysis by Material Type, 2017-2032

Figure 59: Latin America On-The-Go Pots Market Value Share (%) and BPS Analysis by Material Type, 2022-2032

Figure 60: Latin America On-The-Go Pots Market Y-o-Y Growth (%) Projections by Material Type, 2022-2032

Figure 61: Latin America On-The-Go Pots Market Value (US$ Mn) Analysis by Capacity Type, 2017-2032

Figure 62: Latin America On-The-Go Pots Market Volume (Units) Analysis by Capacity Type, 2017-2032

Figure 63: Latin America On-The-Go Pots Market Value Share (%) and BPS Analysis by Capacity Type, 2022-2032

Figure 64: Latin America On-The-Go Pots Market Y-o-Y Growth (%) Projections by Capacity Type, 2022-2032

Figure 65: Latin America On-The-Go Pots Market Value (US$ Mn) Analysis by End Use, 2017-2032

Figure 66: Latin America On-The-Go Pots Market Volume (Units) Analysis by End Use, 2017-2032

Figure 67: Latin America On-The-Go Pots Market Value Share (%) and BPS Analysis by End Use, 2022-2032

Figure 68: Latin America On-The-Go Pots Market Y-o-Y Growth (%) Projections by End Use, 2022-2032

Figure 69: Latin America On-The-Go Pots Market Attractiveness by Material Type, 2022-2032

Figure 70: Latin America On-The-Go Pots Market Attractiveness by Capacity Type, 2022-2032

Figure 71: Latin America On-The-Go Pots Market Attractiveness by End Use, 2022-2032

Figure 72: Latin America On-The-Go Pots Market Attractiveness by Country, 2022-2032

Figure 73: Europe On-The-Go Pots Market Value (US$ Mn) by Material Type, 2022-2032

Figure 74: Europe On-The-Go Pots Market Value (US$ Mn) by Capacity Type, 2022-2032

Figure 75: Europe On-The-Go Pots Market Value (US$ Mn) by End Use, 2022-2032

Figure 76: Europe On-The-Go Pots Market Value (US$ Mn) by Country, 2022-2032

Figure 77: Europe On-The-Go Pots Market Value (US$ Mn) Analysis by Country, 2017-2032

Figure 78: Europe On-The-Go Pots Market Volume (Units) Analysis by Country, 2017-2032

Figure 79: Europe On-The-Go Pots Market Value Share (%) and BPS Analysis by Country, 2022-2032

Figure 80: Europe On-The-Go Pots Market Y-o-Y Growth (%) Projections by Country, 2022-2032

Figure 81: Europe On-The-Go Pots Market Value (US$ Mn) Analysis by Material Type, 2017-2032

Figure 82: Europe On-The-Go Pots Market Volume (Units) Analysis by Material Type, 2017-2032

Figure 83: Europe On-The-Go Pots Market Value Share (%) and BPS Analysis by Material Type, 2022-2032

Figure 84: Europe On-The-Go Pots Market Y-o-Y Growth (%) Projections by Material Type, 2022-2032

Figure 85: Europe On-The-Go Pots Market Value (US$ Mn) Analysis by Capacity Type, 2017-2032

Figure 86: Europe On-The-Go Pots Market Volume (Units) Analysis by Capacity Type, 2017-2032

Figure 87: Europe On-The-Go Pots Market Value Share (%) and BPS Analysis by Capacity Type, 2022-2032

Figure 88: Europe On-The-Go Pots Market Y-o-Y Growth (%) Projections by Capacity Type, 2022-2032

Figure 89: Europe On-The-Go Pots Market Value (US$ Mn) Analysis by End Use, 2017-2032

Figure 90: Europe On-The-Go Pots Market Volume (Units) Analysis by End Use, 2017-2032

Figure 91: Europe On-The-Go Pots Market Value Share (%) and BPS Analysis by End Use, 2022-2032

Figure 92: Europe On-The-Go Pots Market Y-o-Y Growth (%) Projections by End Use, 2022-2032

Figure 93: Europe On-The-Go Pots Market Attractiveness by Material Type, 2022-2032

Figure 94: Europe On-The-Go Pots Market Attractiveness by Capacity Type, 2022-2032

Figure 95: Europe On-The-Go Pots Market Attractiveness by End Use, 2022-2032

Figure 96: Europe On-The-Go Pots Market Attractiveness by Country, 2022-2032

Figure 97: Asia Pacific On-The-Go Pots Market Value (US$ Mn) by Material Type, 2022-2032

Figure 98: Asia Pacific On-The-Go Pots Market Value (US$ Mn) by Capacity Type, 2022-2032

Figure 99: Asia Pacific On-The-Go Pots Market Value (US$ Mn) by End Use, 2022-2032

Figure 100: Asia Pacific On-The-Go Pots Market Value (US$ Mn) by Country, 2022-2032

Figure 101: Asia Pacific On-The-Go Pots Market Value (US$ Mn) Analysis by Country, 2017-2032

Figure 102: Asia Pacific On-The-Go Pots Market Volume (Units) Analysis by Country, 2017-2032

Figure 103: Asia Pacific On-The-Go Pots Market Value Share (%) and BPS Analysis by Country, 2022-2032

Figure 104: Asia Pacific On-The-Go Pots Market Y-o-Y Growth (%) Projections by Country, 2022-2032

Figure 105: Asia Pacific On-The-Go Pots Market Value (US$ Mn) Analysis by Material Type, 2017-2032

Figure 106: Asia Pacific On-The-Go Pots Market Volume (Units) Analysis by Material Type, 2017-2032

Figure 107: Asia Pacific On-The-Go Pots Market Value Share (%) and BPS Analysis by Material Type, 2022-2032

Figure 108: Asia Pacific On-The-Go Pots Market Y-o-Y Growth (%) Projections by Material Type, 2022-2032

Figure 109: Asia Pacific On-The-Go Pots Market Value (US$ Mn) Analysis by Capacity Type, 2017-2032

Figure 110: Asia Pacific On-The-Go Pots Market Volume (Units) Analysis by Capacity Type, 2017-2032

Figure 111: Asia Pacific On-The-Go Pots Market Value Share (%) and BPS Analysis by Capacity Type, 2022-2032

Figure 112: Asia Pacific On-The-Go Pots Market Y-o-Y Growth (%) Projections by Capacity Type, 2022-2032

Figure 113: Asia Pacific On-The-Go Pots Market Value (US$ Mn) Analysis by End Use, 2017-2032

Figure 114: Asia Pacific On-The-Go Pots Market Volume (Units) Analysis by End Use, 2017-2032

Figure 115: Asia Pacific On-The-Go Pots Market Value Share (%) and BPS Analysis by End Use, 2022-2032

Figure 116: Asia Pacific On-The-Go Pots Market Y-o-Y Growth (%) Projections by End Use, 2022-2032

Figure 117: Asia Pacific On-The-Go Pots Market Attractiveness by Material Type, 2022-2032

Figure 118: Asia Pacific On-The-Go Pots Market Attractiveness by Capacity Type, 2022-2032

Figure 119: Asia Pacific On-The-Go Pots Market Attractiveness by End Use, 2022-2032

Figure 120: Asia Pacific On-The-Go Pots Market Attractiveness by Country, 2022-2032

Figure 121: MEA On-The-Go Pots Market Value (US$ Mn) by Material Type, 2022-2032

Figure 122: MEA On-The-Go Pots Market Value (US$ Mn) by Capacity Type, 2022-2032

Figure 123: MEA On-The-Go Pots Market Value (US$ Mn) by End Use, 2022-2032

Figure 124: MEA On-The-Go Pots Market Value (US$ Mn) by Country, 2022-2032

Figure 125: MEA On-The-Go Pots Market Value (US$ Mn) Analysis by Country, 2017-2032

Figure 126: MEA On-The-Go Pots Market Volume (Units) Analysis by Country, 2017-2032

Figure 127: MEA On-The-Go Pots Market Value Share (%) and BPS Analysis by Country, 2022-2032

Figure 128: MEA On-The-Go Pots Market Y-o-Y Growth (%) Projections by Country, 2022-2032

Figure 129: MEA On-The-Go Pots Market Value (US$ Mn) Analysis by Material Type, 2017-2032

Figure 130: MEA On-The-Go Pots Market Volume (Units) Analysis by Material Type, 2017-2032

Figure 131: MEA On-The-Go Pots Market Value Share (%) and BPS Analysis by Material Type, 2022-2032

Figure 132: MEA On-The-Go Pots Market Y-o-Y Growth (%) Projections by Material Type, 2022-2032

Figure 133: MEA On-The-Go Pots Market Value (US$ Mn) Analysis by Capacity Type, 2017-2032

Figure 134: MEA On-The-Go Pots Market Volume (Units) Analysis by Capacity Type, 2017-2032

Figure 135: MEA On-The-Go Pots Market Value Share (%) and BPS Analysis by Capacity Type, 2022-2032

Figure 136: MEA On-The-Go Pots Market Y-o-Y Growth (%) Projections by Capacity Type, 2022-2032

Figure 137: MEA On-The-Go Pots Market Value (US$ Mn) Analysis by End Use, 2017-2032

Figure 138: MEA On-The-Go Pots Market Volume (Units) Analysis by End Use, 2017-2032

Figure 139: MEA On-The-Go Pots Market Value Share (%) and BPS Analysis by End Use, 2022-2032

Figure 140: MEA On-The-Go Pots Market Y-o-Y Growth (%) Projections by End Use, 2022-2032

Figure 141: MEA On-The-Go Pots Market Attractiveness by Material Type, 2022-2032

Figure 142: MEA On-The-Go Pots Market Attractiveness by Capacity Type, 2022-2032

Figure 143: MEA On-The-Go Pots Market Attractiveness by End Use, 2022-2032

Figure 144: MEA On-The-Go Pots Market Attractiveness by Country, 2022-2032

Recommendations

Packaging

Wax Paper Medicine Pots Market

Published : July 2021

Explore Packaging Insights

View Reports