The passenger boarding bridge market is likely to grow from USD 2.1 billion in 2025 to USD 3.4 billion by 2035, representing a substantial CAGR of 4.9%, demonstrating the accelerating adoption of advanced boarding technology and passenger flow optimization across airport facilities, terminal operations, and aviation infrastructure sectors.
The first half of the decade (2025-2030) will see the market increase from USD 2.1 billion to approximately USD 2.7 billion, adding USD 0.6 billion in value, which constitutes 28% of the total forecast growth period. This phase will be characterized by the rapid adoption of telescopic bridge systems, driven by increasing air traffic volumes and the growing need for advanced passenger boarding solutions worldwide. Enhanced bridge capabilities and automated docking systems will become standard expectations rather than premium options.
The latter half (2030-2035) will witness continued growth from USD 2.7 billion to USD 3.4 billion, representing an addition of USD 0.7 billion or 54% of the decade's expansion. This period will be defined by mass market penetration of intelligent docking technologies, integration with comprehensive airport management platforms, and seamless compatibility with existing terminal infrastructure. The market trajectory signals fundamental shifts in how airport facilities approach passenger boarding optimization and operational management, with participants positioned to benefit from growing demand across multiple bridge types and configuration segments.
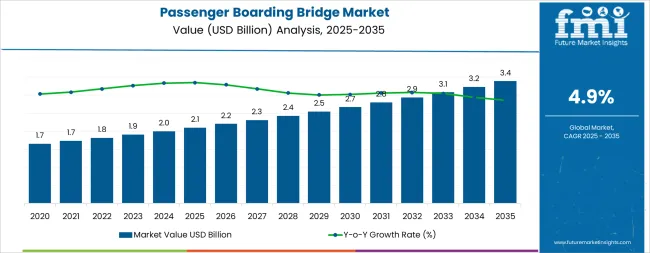
The passenger boarding bridge market demonstrates distinct growth phases with varying market characteristics and competitive dynamics. Between 2025 and 2030, the market progresses through its technology adoption phase, expanding from USD 2.1 billion to USD 2.7 billion with steady annual increments averaging 4.9% growth. This period showcases the transition from basic boarding equipment to advanced telescopic bridge systems with enhanced flexibility capabilities and integrated docking systems becoming mainstream features.
The 2025-2030 phase adds USD 0.6 billion to market value, representing 46% of total decade expansion. Market maturation factors include the standardization of boarding protocols, declining component costs for specialized equipment, and increasing aviation industry awareness of bridge benefits, which reach 94-97% operational effectiveness in passenger boarding applications. The competitive landscape during this period features established airport equipment companies, such as JBT Corporation and ShinMaywa Industries Ltd., expanding their bridge portfolios, while specialty manufacturers focus on advanced technology development and enhanced boarding capabilities.
From 2030 to 2035, market dynamics shift toward advanced automation integration and global aviation expansion, with growth continuing from USD 2.7 billion to USD 3.4 billion, representing an additional USD 0.7 billion, or 54%, of total expansion. This phase transition centers on intelligent docking systems, integration with automated airport networks, and deployment across diverse terminal and aircraft scenarios, becoming standard rather than specialized applications. The competitive environment matures, with a focus shifting from basic boarding capabilities to comprehensive operational optimization systems and integration with airport monitoring platforms.
| Metric | Value |
|---|---|
| Market Value (2025) | USD 2.1 billion |
| Market Forecast (2035) | USD 3.4 billion |
| Growth Rate | 4.9% CAGR |
| Leading Technology | Telescopic Bridges Type |
| Primary Structure | Glass-walled Boarding Bridge Segment |
The market demonstrates strong fundamentals with telescopic bridge systems capturing a dominant share through advanced boarding capabilities and passenger flow optimization. Glass-walled boarding bridge structures drive primary demand, supported by increasing terminal modernization and passenger experience requirements. Geographic expansion remains concentrated in developed markets with established aviation infrastructure, while emerging economies show accelerating adoption rates driven by airport development initiatives and rising passenger traffic standards.
Market expansion rests on three fundamental shifts driving adoption across the aviation and airport infrastructure sectors. 1. Passenger experience mandates create compelling operational advantages through boarding bridges that provide immediate boarding efficiency without weather delays, enabling airport facilities to meet service standards while maintaining operational productivity and reducing passenger inconvenience. 2. Airport modernization accelerates as facilities worldwide seek advanced systems that complement traditional boarding methods, enabling precise passenger flow control and operational management that align with aviation regulations and efficiency standards. 3. Infrastructure enhancement drives adoption from airport facilities and terminal operations requiring effective boarding solutions that minimize aircraft turnaround time while maintaining operational productivity during boarding and deplaning operations.
However, growth faces headwinds from equipment cost challenges that vary across suppliers regarding the pricing of specialized boarding equipment and bridge systems, which may limit adoption in budget-sensitive airport environments. Technical limitations also persist regarding bridge capabilities and operational conditions that may reduce effectiveness in extreme weather or challenging aircraft configurations, which affect bridge performance and operational consistency.
The passenger boarding bridge market represents a specialized yet critical opportunity driven by expanding aviation infrastructure projects, airport modernization programs, and the adoption of intelligent and automated boarding systems. The market will expand from USD 2.1B in 2025 to USD 3.4B by 2035, adding USD 1.3B in new value. Growth opportunities are concentrated around advanced telescopic bridges, glass-walled structures, intelligent docking systems, and smart terminal integration.
Primary Classification: The market segments by model type into telescopic bridges, apron drive bridge, dual boarding bridge system, commuter bridge, over-the-wing bridge, nose-loader bridge, and T-bridges, representing the evolution from basic boarding equipment to specialized passenger solutions for comprehensive airport optimization.
Secondary Classification: Structure segmentation divides the market into steel-walled boarding bridge, glass-walled boarding bridge, and glass-steel-walled boarding bridge sectors, reflecting distinct requirements for passenger experience, operational performance, and terminal aesthetic standards.
Tertiary Classification: Foundation segmentation covers fixed boarding bridge and movable boarding bridge, while tunnel type includes air-conditioned tunnel and non air-conditioned tunnel, and docking type spans manual docking system and intelligent docking system configurations.
Regional Classification: Geographic distribution covers North America, Latin America, Western Europe, Eastern Europe, East Asia, South Asia Pacific, and Middle East & Africa, with developed markets leading adoption while emerging economies show accelerating growth patterns driven by aviation expansion programs.
The segmentation structure reveals technology progression from standard boarding equipment toward specialized passenger systems with enhanced flexibility and automation capabilities, while application diversity spans from terminal facilities to aircraft operations requiring precise boarding solutions.
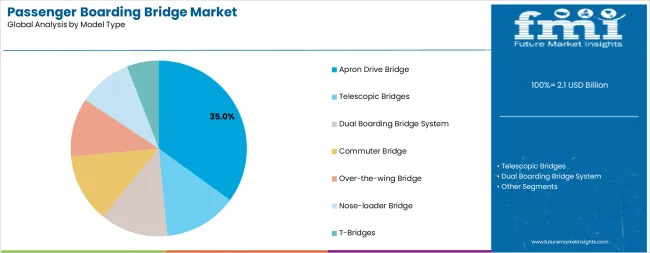
Market Position: Telescopic Bridges systems command the leading position in the passenger boarding bridge market with significant market share through advanced boarding features, including superior flexibility capability, operational adaptability, and airport optimization that enable terminal facilities to achieve optimal passenger boarding across diverse aircraft and terminal environments.
Value Drivers: The segment benefits from airport facility preference for reliable boarding systems that provide consistent flexibility performance, reduced setup time, and operational efficiency optimization without requiring significant infrastructure modifications. Advanced design features enable automated positioning systems, boarding consistency, and integration with existing terminal equipment, where operational performance and passenger safety represent critical facility requirements.
Competitive Advantages: Telescopic Bridges systems differentiate through proven operational stability, consistent boarding characteristics, and integration with automated terminal systems that enhance facility effectiveness while maintaining optimal safety standards for diverse aircraft and passenger applications.
Key market characteristics:
Apron Drive Bridge systems maintain a significant market position in the passenger boarding bridge market due to their specialized mobility properties and operational advantages. These systems appeal to facilities requiring specific positioning characteristics with competitive pricing for multi-gate terminal applications. Market growth is driven by airport expansion, emphasizing reliable boarding solutions and operational efficiency through optimized system designs.
Dual Boarding Bridge System captures market share through specialized boarding requirements in large aircraft facilities, wide-body operations, and high-capacity applications. These facilities demand advanced boarding systems capable of handling multiple aircraft doors while providing effective passenger flow capabilities and operational efficiency.
Commuter Bridge applications account for market share, including regional aircraft operations, smaller terminal applications, and specialized boarding operations requiring boarding capabilities for operational optimization and passenger flow control.
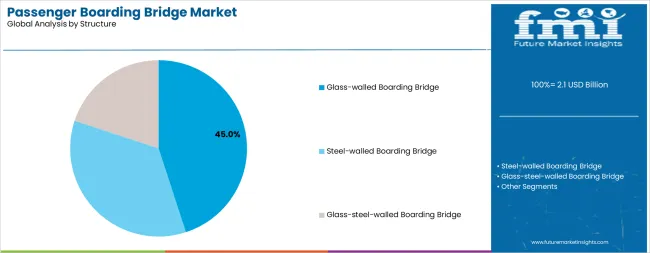
Market Context: Glass-walled boarding bridge applications demonstrate market leadership in the passenger boarding bridge market with significant share and strong growth due to widespread adoption of passenger experience enhancement systems and increasing focus on terminal aesthetics optimization, passenger comfort improvement, and facility modernization applications that maximize visual appeal while maintaining operational standards.
Appeal Factors: Glass-walled structure operators prioritize system aesthetics, passenger experience optimization, and integration with existing terminal architecture that enables coordinated boarding experience across multiple terminal operations. The segment benefits from substantial terminal modernization investment and passenger experience programs that emphasize the acquisition of glass-walled systems for visual enhancement and terminal efficiency applications.
Growth Drivers: Terminal modernization programs incorporate glass-walled structures as standard equipment for passenger operations, while airport facility growth increases demand for aesthetic boarding capabilities that comply with design standards and minimize visual complexity.
Market Challenges: Varying structural technology standards and maintenance infrastructure differences may limit system standardization across different facilities or operational scenarios.
Application dynamics include:
Steel-walled boarding bridge applications capture market share through traditional boarding requirements in industrial airports, cargo facilities, and heavy-duty applications. These facilities demand robust structural systems capable of operating in challenging environments while providing effective boarding capabilities and operational reliability.
Glass-steel-walled boarding bridge applications account for market share, including hybrid terminal operations, mixed environment applications, and flexible facility operations requiring adaptable structural capabilities for operational optimization and aesthetic balance.
Market Position: Movable boarding bridge systems command significant market position with strong growth through optimal flexibility range that balances positioning capability and operational versatility for diverse terminal applications.
Value Drivers: This foundation segment provides the ideal combination of positioning capability and operational flexibility, meeting requirements for multi-gate terminals, aircraft variety accommodation, and terminal efficiency applications without excessive infrastructure complexity or operational limitations.
Growth Characteristics: The segment benefits from broad applicability across terminal sectors, standardized equipment specifications, and established operational training programs that support widespread adoption and operational efficiency.
Market Context: Air-conditioned tunnel applications dominate the market with strong growth, reflecting the shift toward passenger comfort enhancement and climate control in boarding solutions.
Business Model Advantages: Air-conditioned systems provide enhanced passenger experience without environmental exposure, enabling airports to maintain comfort standards based on climate demands while maintaining boarding efficiency and passenger satisfaction.
Operational Benefits: Climate-controlled tunnels include comfort maintenance, weather protection, and passenger satisfaction enhancement that reduce operational complexity for airports while providing access to latest passenger comfort technologies.
Market Position: Intelligent docking system applications lead the market with strong growth, representing the advanced segment due to automation adoption and operational efficiency requirements.
Growth Drivers: Aviation sector expansion, terminal modernization projects, and operational automation enforcement drive consistent demand for intelligent docking solutions across commercial, cargo, and passenger terminal development projects.
Application Scope: Intelligent docking applications span aircraft positioning, automated alignment, operational monitoring, and safety compliance features requiring diverse docking capabilities and automation compliance features.
Growth Accelerators: Airport development drives primary adoption as passenger boarding bridges provide boarding efficiency capabilities that enable terminal facilities to meet passenger service standards without excessive weather delays, supporting airport operations and passenger missions that require precise boarding applications. Passenger experience demand accelerates market expansion as facilities seek effective systems that minimize boarding delays while maintaining operational effectiveness during passenger boarding and aircraft scenarios. Aviation technology spending increases worldwide, creating continued demand for bridge systems that complement traditional boarding methods and provide operational flexibility in complex terminal environments.
Growth Inhibitors: Equipment cost challenges vary across suppliers regarding the pricing of specialized bridge systems and boarding equipment, which may limit operational flexibility and market penetration in regions with budget constraints or cost-sensitive airport operations. Technical performance limitations persist regarding bridge capabilities and operational conditions that may reduce effectiveness in extreme weather, challenging aircraft configurations, or terminal environment conditions, affecting bridge performance and operational consistency. Market fragmentation across multiple aviation specifications and safety standards creates compatibility concerns between different equipment suppliers and existing terminal infrastructure.
Market Evolution Patterns: Adoption accelerates in aviation and airport sectors where passenger experience requirements justify bridge system costs, with geographic concentration in developed markets transitioning toward mainstream adoption in emerging economies driven by airport initiatives and aviation development. Technology development focuses on enhanced bridge capabilities, improved boarding efficiency, and integration with automated terminal systems that optimize passenger flow and airport effectiveness. The market could face disruption if alternative boarding technologies or aviation regulations significantly limit the deployment of traditional bridge equipment in terminal or aircraft applications.
The passenger boarding bridge market demonstrates varied regional dynamics with Growth Leaders including China (5.8% growth rate) and India (5.5% growth rate) driving expansion through aviation infrastructure initiatives and airport development. Steady Performers encompass United States (4.7% growth rate), Germany (4.5% growth rate), and developed regions, benefiting from established aviation industries and advanced bridge adoption.
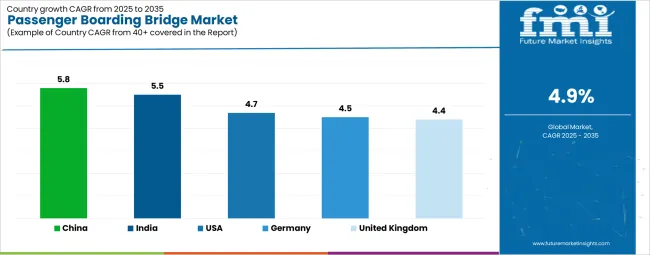
| Country | Growth Rate (2025-2035) |
|---|---|
| China | 5.8% |
| India | 5.5% |
| United States | 4.7% |
| Germany | 4.5% |
| United Kingdom | 4.4% |
Regional synthesis reveals East Asian markets leading adoption through aviation expansion and airport development, while North American countries maintain steady expansion supported by terminal technology advancement and passenger experience standardization requirements. European markets show moderate growth driven by terminal applications and passenger experience integration trends.
China establishes fastest market growth through aggressive aviation programs and comprehensive airport development, integrating advanced passenger boarding bridges as standard components in terminal construction and aviation infrastructure installations. The country's 5.8% growth rate reflects government initiatives promoting aviation technology and domestic manufacturing capabilities that mandate the use of advanced bridge systems in airport and terminal facilities. Growth concentrates in major aviation centers, including Beijing, Shanghai, and Guangzhou, where airport technology development showcases integrated bridge systems that appeal to airport operators seeking advanced facility optimization capabilities and passenger experience management applications.
Chinese manufacturers are developing cost-effective bridge solutions that combine domestic production advantages with advanced operational features, including automated docking systems and enhanced boarding capabilities. Distribution channels through airport suppliers and aviation equipment distributors expand market access, while government support for aviation development supports adoption across diverse terminal and aircraft segments.
Strategic Market Indicators:
In Delhi, Mumbai, and Bangalore, airport facilities and terminal operators are implementing advanced passenger boarding bridges as standard equipment for boarding optimization and passenger experience applications, driven by increasing government aviation investment and terminal modernization programs that emphasize the importance of passenger boarding capabilities. The market holds a 5.5% growth rate, supported by government aviation initiatives and airport infrastructure development programs that promote advanced bridge systems for terminal and aircraft facilities. Indian operators are adopting bridge systems that provide consistent operational performance and passenger experience features, particularly appealing in urban regions where boarding efficiency and passenger service standards represent critical operational requirements.
Market expansion benefits from growing aviation technology manufacturing capabilities and international technology transfer agreements that enable domestic production of advanced bridge systems for terminal and aircraft applications. Technology adoption follows patterns established in airport equipment, where reliability and performance drive procurement decisions and operational deployment.
Market Intelligence Brief:
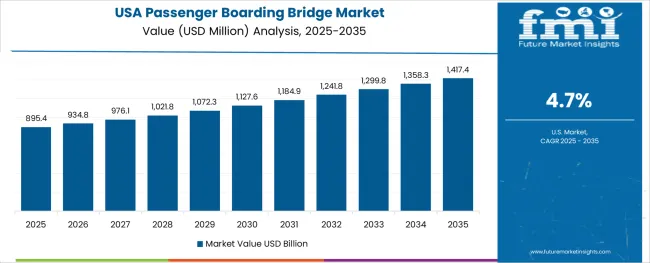
United States establishes market leadership through comprehensive aviation programs and advanced airport infrastructure development, integrating passenger boarding bridges across terminal and aviation applications. The country's 4.7% growth rate reflects established aviation industry relationships and mature bridge technology adoption that supports widespread use of boarding systems in airport and terminal facilities. Growth concentrates in major aviation centers, including Atlanta, Chicago, and Los Angeles, where airport technology showcases mature bridge deployment that appeals to airport operators seeking proven boarding capabilities and operational efficiency applications.
American bridge providers leverage established distribution networks and comprehensive service capabilities, including maintenance programs and technical support that create customer relationships and operational advantages. The market benefits from mature aviation regulations and airport standards that mandate bridge use while supporting technology advancement and operational optimization.
Market Intelligence Brief:
Germany's advanced aviation technology market demonstrates sophisticated passenger boarding bridge deployment with documented operational effectiveness in terminal applications and airport facilities through integration with existing passenger systems and terminal infrastructure. The country leverages engineering expertise in aviation technology and passenger systems integration to maintain a 4.5% growth rate. Airport centers, including Frankfurt, Munich, and Düsseldorf, showcase premium installations where bridge systems integrate with comprehensive terminal platforms and facility management systems to optimize boarding operations and passenger effectiveness.
German manufacturers prioritize system reliability and EU compliance in bridge equipment development, creating demand for premium systems with advanced features, including facility monitoring integration and automated boarding systems. The market benefits from established aviation technology infrastructure and a willingness to invest in advanced passenger technologies that provide long-term operational benefits and compliance with international aviation standards.
Market Intelligence Brief:
The United Kingdom shows steady market expansion for passenger boarding bridges, driven by airport modernization programs, fleet upgrades, and expansion of regional airports. Growth is underpinned by projects at Heathrow, Gatwick, Manchester, and regional hubs, where operators focus on upgrading boarding infrastructure to align with safety, accessibility, and passenger flow optimization standards.
Unlike China’s state-driven aviation buildout, the UK market is shaped by private-public partnerships and competitive tenders, with emphasis on operational efficiency, sustainability compliance, and passenger experience enhancements. Demand concentrates on automated, energy-efficient boarding bridges with integration into airport IT and passenger management systems.
International suppliers (e.g., Thyssenkrupp Airport Systems, ADELTE, CIMC-TianDa) dominate, while UK-based contractors focus on installation, refurbishment, and maintenance services. Local players leverage competitive service contracts rather than large-scale bridge manufacturing, aligning with the UK’s role as a technology integrator rather than primary equipment producer.
Market Intelligence Brief:
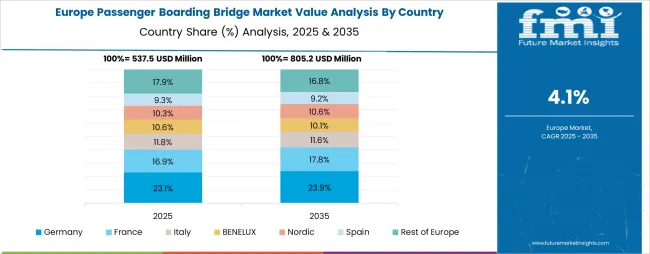
The passenger boarding bridge market in Europe is projected to grow from USD 0.6 billion in 2025 to USD 0.9 billion by 2035, registering a CAGR of 4.3% over the forecast period. Germany is expected to maintain its leadership position with a 29.2% market share in 2025, supported by its advanced aviation technology infrastructure and major airport centers.
United Kingdom follows with a 24.6% share in 2025, driven by comprehensive aviation programs and passenger experience development initiatives. Italy commands a 13.7% share, while Spain accounts for 13.4% in 2025. The Rest of Western Europe region is anticipated to gain momentum, expanding its collective share from 7.8% to 8.1% by 2035, attributed to increasing aviation adoption in Nordic countries and emerging terminal facilities implementing passenger experience modernization programs.
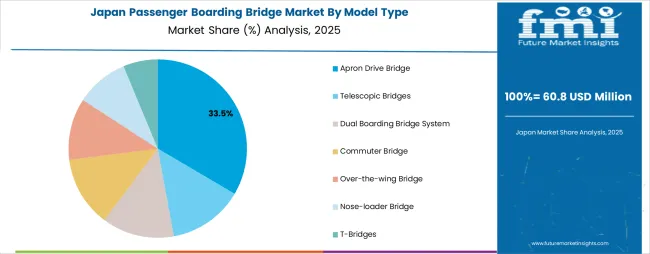
In Japan, the passenger boarding bridge market prioritizes telescopic bridge systems, which capture the dominant share of international and domestic terminal installations due to their advanced features, including precision alignment for high-frequency aircraft movements and seamless integration with automated passenger management platforms. Japanese airport operators emphasize efficiency, reliability, and adaptability, creating demand for telescopic bridge systems that provide consistent boarding capabilities and accommodate a wide range of aircraft sizes while maintaining strict safety and punctuality standards. Other bridge types remain secondary, serving regional airports and low-traffic terminals where compact or cost-effective bridge systems suffice without compromising operational stability.
Market Characteristics:
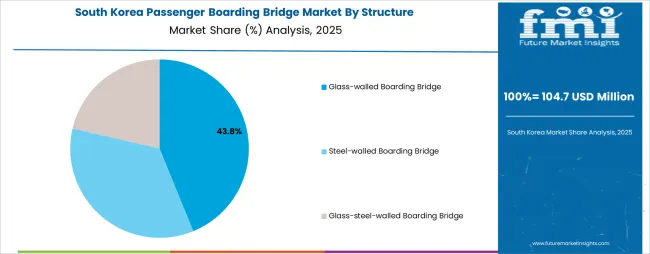
In South Korea, the market structure favors international airport equipment providers, including ADELTE, CIMC-TianDa, and ThyssenKrupp AG, which maintain dominant positions through advanced bridge portfolios and established aviation networks supporting both bridge supply and technical service contracts. These providers deliver integrated boarding solutions that combine advanced telescopic systems with installation and predictive maintenance services, appealing to South Korean airport operators seeking technology-driven reliability and passenger safety enhancements. Local service contractors and engineering firms capture a moderate share by delivering fast-response maintenance, refurbishment services, and cost-competitive installation, while domestic manufacturers remain focused on niche products and airport-specific customization tailored to the requirements of South Korea’s regional airports and budget airline hubs.
Channel Insights:
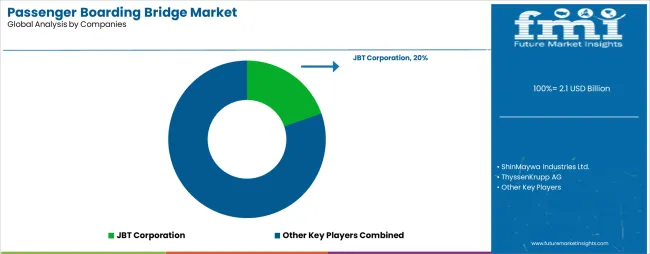
The passenger boarding bridge market operates with moderate concentration, featuring approximately 18-22 meaningful participants, where leading companies control roughly 55-60% of the global market share through established aviation industry relationships and comprehensive bridge portfolios. Competition emphasizes advanced boarding capabilities, system reliability, and terminal integration rather than price-based rivalry.
Market Leaders encompass JBT Corporation, ShinMaywa Industries Ltd., and ThyssenKrupp AG, which maintain competitive advantages through extensive aviation technology expertise, global airport contractor networks, and comprehensive system integration capabilities that create customer switching costs and support premium pricing. These companies leverage decades of bridge technology experience and ongoing research investments to develop advanced boarding systems with precision operational control and terminal monitoring features.
Technology Innovators include China International Marine Containers Co. Ltd., Mitsubishi Heavy Industries Ltd., and Adele S.L., which compete through specialized bridge technology focus and innovative operational interfaces that appeal to airport operators seeking advanced boarding capabilities and operational flexibility. These companies differentiate through rapid technology development cycles and specialized aviation application focus.
Regional Specialists feature companies like PT Bukaka Teknik Utama Tbk, Airport Equipment, and Vataple Machinery Co. Ltd., which focus on specific geographic markets and specialized applications, including intelligent docking systems and integrated terminal solutions. Market dynamics favor participants that combine reliable bridge capabilities with advanced operational software, including precision boarding control and automatic performance optimization capabilities. Competitive pressure intensifies as traditional airport equipment contractors expand into bridge systems, while specialized aviation companies challenge established players through innovative bridge solutions and cost-effective systems targeting specialized terminal segments.
| Item | Value |
|---|---|
| Quantitative Units | USD 2.1 billion |
| Model Type | Telescopic Bridges, Apron Drive Bridge, Dual Boarding Bridge System, Commuter Bridge, Over-the-wing Bridge, Nose-loader Bridge, T-Bridges |
| Structure | Steel-walled Boarding Bridge, Glass-walled Boarding Bridge, Glass-steel-walled Boarding Bridge |
| Foundation | Fixed Boarding Bridge, Movable Boarding Bridge |
| Tunnel Type | Air-conditioned Tunnel, Non Air-conditioned Tunnel |
| Docking Type | Manual Docking System, Intelligent Docking System |
| Regions Covered | North America, Latin America, Western Europe, Eastern Europe, East Asia, South Asia Pacific, Middle East & Africa |
| Countries Covered | United States, China, Germany, India, United Kingdom, Japan, Canada, Brazil, France, Australia, and 25+ additional countries |
| Key Companies Profiled | JBT Corporation, ShinMaywa Industries Ltd., ThyssenKrupp AG, China International Marine Containers Co. Ltd., Mitsubishi Heavy Industries Ltd., Adele S.L., PT Bukaka Teknik Utama Tbk |
| Additional Attributes | Dollar sales by model type and structure categories, regional adoption trends across East Asia, North America, and Western Europe, competitive landscape with aviation equipment manufacturers and terminal service suppliers, airport operator preferences for precision boarding control and system reliability, integration with terminal platforms and passenger monitoring systems, innovations in bridge technology and boarding enhancement, and development of automated boarding solutions with enhanced performance and terminal optimization capabilities. |
The global passenger boarding bridge market is estimated to be valued at USD 2.1 billion in 2025.
The market size for the passenger boarding bridge market is projected to reach USD 3.4 billion by 2035.
The passenger boarding bridge market is expected to grow at a 4.9% CAGR between 2025 and 2035.
The key product types in passenger boarding bridge market are apron drive bridge, telescopic bridges, dual boarding bridge system, commuter bridge, over-the-wing bridge, nose-loader bridge and t-bridges.
In terms of structure, glass-walled boarding bridge segment to command 45.0% share in the passenger boarding bridge market in 2025.


Full Research Suite comprises of:
Market outlook & trends analysis
Interviews & case studies
Strategic recommendations
Vendor profiles & capabilities analysis
5-year forecasts
8 regions and 60+ country-level data splits
Market segment data splits
12 months of continuous data updates
DELIVERED AS:
PDF EXCEL ONLINE
Assessing Passenger Boarding Bridge Market Share & Industry Trends
Airport Passenger Boarding Bridge Market Size and Share Forecast Outlook 2025 to 2035
Passenger Car Seat Market Forecast and Outlook 2025 to 2035
Passenger Ferries Market Size and Share Forecast Outlook 2025 to 2035
Passenger Vehicle ADAS Market Size and Share Forecast Outlook 2025 to 2035
Passenger Vehicles Market Size and Share Forecast Outlook 2025 to 2035
Passenger Vehicle Telematics Market Size and Share Forecast Outlook 2025 to 2035
Passenger Security Market Size and Share Forecast Outlook 2025 to 2035
Passenger Tire Market Size and Share Forecast Outlook 2025 to 2035
Passenger Vessel Propeller Market Size and Share Forecast Outlook 2025 to 2035
Passenger Car Bearing & Clutch Component Aftermarket Growth – Trends & Forecast 2024-2034
Used Passenger Car Sales Market
Electric Passenger Car MRO Market Growth – Trends & Forecast 2025 to 2035
Safeguards for Passenger Transfer Area Market Size and Share Forecast Outlook 2025 to 2035
Sales Training and Onboarding Software Market Size and Share Forecast Outlook 2025 to 2035
Bridge Structural Health Monitoring (SHM) Solution Market Size and Share Forecast Outlook 2025 to 2035
Bridge Expansion Joints Market Growth - Trends & Forecast 2025 to 2035
Bridge Bearing Market Growth – Trends & Forecast 2025-2035
Aerobridge Market Size and Share Forecast Outlook 2025 to 2035
FRP Bridge Market Growth – Trends & Forecast 2024-2034

Thank you!
You will receive an email from our Business Development Manager. Please be sure to check your SPAM/JUNK folder too.
Chat With
MaRIA