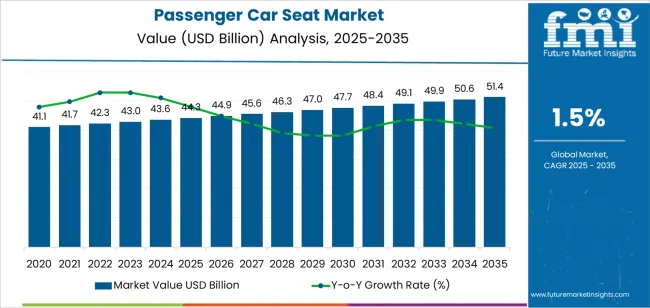
The Passenger Car Seat Market is projected to be worth USD 43.6 billion in 2024. The market is anticipated to reach USD 50.4 billion by 2034. The market is further expected to advance at a CAGR of 1.5% during the forecast period 2024 to 2034.
Key Market Trends and Highlights
Automotive manufacturers are increasingly utilizing lightweight materials such as high strength steel, aluminum, and carbon fiber composites to reduce vehicle weight and improve fuel efficiency. The trend is also influencing the design and construction of car seats, leading to the development of lighter and more fuel efficient seating solutions.
Attributes | Key Insights |
---|---|
Passenger Car Seat Market Estimated Size in 2024 | USD 43.6 billion |
Projected Market Value in 2034 | USD 50.4 billion |
Value-based CAGR from 2024 to 2034 | 1.5% |
The scope for passenger car seat rose at a 3.5% CAGR between 2019 and 2023. The global market is anticipated to rise at a sluggish CAGR of 1.5% over the forecast period 2024 to 2034.
Both historical analysis and forecast projections are likely to highlight the role of technological advancements in driving market growth. Over the years, advancements in materials science, manufacturing processes, and design technologies have enabled the development of more comfortable, safer, and feature rich car seats.
Understanding changing consumer preferences is crucial for the passenger car seat market. Historical analysis show shifts in consumer preferences towards premium seating options, customization features, and innovative comfort and safety features.
Forecast projections are anticipated to witness continued demand for personalized seating experiences and advanced features catering to diverse consumer needs. Compliance with regulatory standards and safety requirements significantly influences the design and manufacturing of car seats.
Historical analysis reflects the impact of evolving safety regulations on market dynamics, while forecast projections anticipate the need for continuous innovation to meet future regulatory standards and address emerging safety concerns.
The market is closely linked to trends in vehicle production and sales. Historical analysis examine fluctuations in vehicle production volumes and their impact on car seat demand, while forecast projections are expected to consider factors such as increasing vehicle electrification, autonomous driving technologies, and changing consumer preferences for vehicle types and sizes.
Consumers are increasingly demanding comfortable and safe seating options in passenger cars. Manufacturers are responding by incorporating advanced materials, ergonomic designs, and safety features into car seats.
The passenger car seat market is highly dependent on raw materials such as steel, aluminum, plastics, and textiles. Any significant fluctuations in the prices of these raw materials can impact production costs and profit margins for car seat manufacturers.
The below table showcases revenues in terms of the top 5 leading countries, spearheaded by Korea and Japan. The countries are expected to lead the market through 2034.
Countries | Forecast CAGRs from 2024 to 2034 |
---|---|
The United States | 1.7% |
China | 1.9% |
The United Kingdom | 2.6% |
Japan | 2.9% |
Korea | 3.4% |
The passenger car seat market in the United States expected to expand at a CAGR of 1.7% through 2034. The country is one of the largest automotive markets globally, with consistently high levels of vehicle sales. The demand for passenger car seats also increases, as vehicle sales continue to grow, driving market growth.
American consumers prioritize comfort and safety features in their vehicles, including high quality seating systems. Manufacturers respond by incorporating advanced materials, ergonomic designs, and safety features into car seats to meet consumer demands.
The passenger car seat market in the United Kingdom is anticipated to expand at a CAGR of 2.6% through 2034.
Technological innovations in the automotive industry, such as the integration of smart features, advanced materials, and connectivity options, are driving the demand for advanced seating systems in the country. Consumers seek seating solutions that offer convenience, connectivity, and enhanced driving experiences.
The country has stringent regulatory standards and safety requirements for automotive seating systems. Compliance with these regulations necessitates the development of innovative and safer car seat designs, driving market growth as manufacturers invest in meeting these standards.
Passenger car seat trends in China are taking a turn for the better. A 1.9% CAGR is forecast for the country from 2024 to 2034. The Chinese government has implemented policies and incentives to promote the adoption of electric vehicles as part of efforts to reduce air pollution and combat climate change.
The growth of the EV market presents opportunities for seating system manufacturers to develop specialized seating solutions tailored to electric vehicles.
China has a growing market for luxury and premium vehicles, driven by the increasing affluence of the middle class. Consumers in this segment demand high quality seating systems with advanced features, premium materials, and customizable options, driving growth in the passenger car seat market.
The passenger car seat market in Japan is poised to expand at a CAGR of 2.9% through 2034. The country has an aging population, with a growing number of elderly drivers and passengers.
Seating systems that offer features such as adjustable lumbar support, easy ingress and egress, and enhanced comfort cater to the needs of elderly drivers and passengers, driving market growth.
Japanese manufacturers are known for their innovative design and collaboration with automotive OEMs. Collaborations between seating system manufacturers and automotive companies drive the development of cutting edge seating solutions that meet the evolving needs of Japanese consumers.
The passenger car seat market in Korea is anticipated to expand at a CAGR of 3.4% through 2034. Korean consumers often prioritize vehicles equipped with advanced features and technology.
Seating systems that offer features such as integrated entertainment systems, massage functionality, and adjustable memory settings cater to the preferences of tech savvy consumers, driving demand in the market.
Comfort and ergonomic design are key considerations for Korean consumers when purchasing vehicles. Seating systems that offer ergonomic designs, adjustable features, and premium materials enhance the overall driving experience and appeal to discerning consumers.
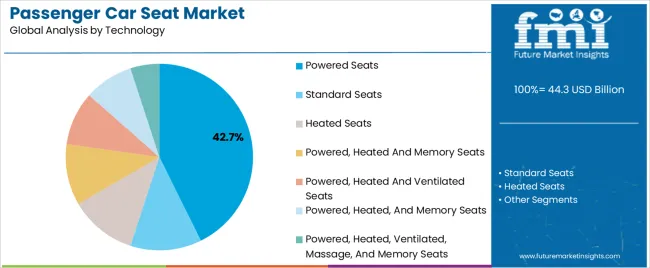
The below table highlights how bucket segment is projected to lead the market in terms of seat type, and is expected to account for a CAGR of 1.3% through 2034. Based on technology, the powered seats segment is expected to account for a CAGR of 1.0% through 2034.
Category | CAGR from 2024 to 2034 |
---|---|
Bucket | 1.3% |
Powered Seats | 1.0% |
Based on seat type, the bucket segment is expected to continue dominating the passenger car seat market. Bucket seats are commonly associated with sporty and performance oriented vehicles, including sports cars, coupes, and high performance sedans.
The increasing demand for these types of vehicles, driven by enthusiasts and performance minded consumers, contributes to the growth of the bucket seat segment.
Bucket seats are designed to provide enhanced comfort, support, and stability during aggressive driving maneuvers. Their ergonomic design and bolstered sides help keep passengers secure and comfortable, making them desirable for drivers who prioritize driving dynamics and performance.
In terms of technology, the powered seats segment is expected to continue dominating the passenger car seat market. Powered seats offer enhanced comfort and convenience features compared to manual seats.
Passengers, with powered seats, can adjust seat positions, recline angles, lumbar support, and other settings at the touch of a button, providing a more comfortable and customizable driving experience.
Powered seats improve accessibility for passengers, including individuals with mobility limitations or disabilities. The ability to adjust seat positions electronically makes it easier for passengers to enter and exit vehicles, enhancing overall convenience and accessibility.
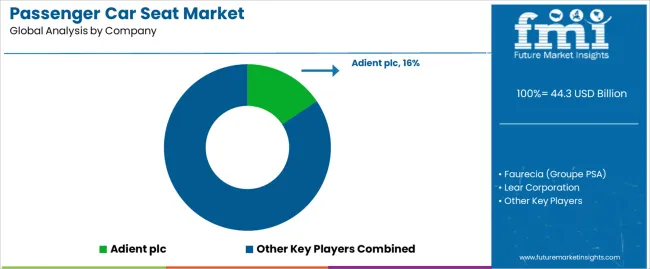
The competitive landscape of the passenger car seat market is characterized by intense competition among key players striving to maintain and expand their market share globally. Passenger car seats, as one of the integral components of automotive interiors, play a crucial role in shaping the overall driving experience, comfort, and safety for vehicle occupants.
Recent Development
Attribute | Details |
---|---|
Estimated Market Size in 2024 | USD 43.6 billion |
Projected Market Valuation in 2034 | USD 50.4 billion |
Value-based CAGR 2024 to 2034 | 1.5% |
Forecast Period | 2024 to 2034 |
Historical Data Available for | 2019 to 2023 |
Market Analysis | Value in USD billion |
Key Regions Covered | North America; Latin America; Western Europe; Eastern Europe; South Asia and Pacific; East Asia; The Middle East & Africa |
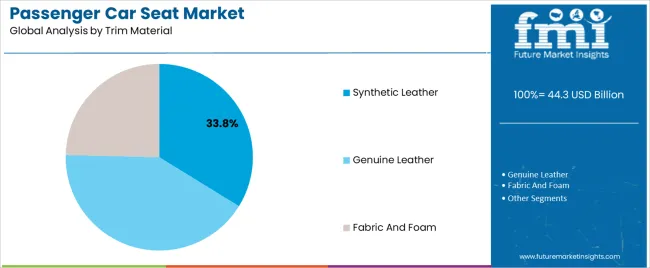
Key Market Segments Covered | Seat Type, Technology, Trim Material, Component Type, Application, End User, Region |
Key Countries Profiled | The United States, Canada, Brazil, Mexico, Germany, France, France, Spain, Italy, Russia, Poland, Czech Republic, Romania, India, Bangladesh, Australia, New Zealand, China, Japan, South Korea, GCC countries, South Africa, Israel |
Key Companies Profiled | Adient plc; Faurecia (Groupe PSA); Lear Corporation; Aisin Corporation (Toyota Motor Corporation); Magna International, Inc.; TS TECH Co., Ltd.; Johnson Controls International PLC; NHK Spring Co., Ltd; TACHI-S CO., LTD.; Gentherm Incorporated |
Table 1: Global Market Value (US$ Million) Forecast by Region, 2019 to 2034
Table 2: Global Market Volume (Units) Forecast by Region, 2019 to 2034
Table 3: Global Market Value (US$ Million) Forecast by Seat Type, 2019 to 2034
Table 4: Global Market Volume (Units) Forecast by Seat Type, 2019 to 2034
Table 5: Global Market Value (US$ Million) Forecast by Technology, 2019 to 2034
Table 6: Global Market Volume (Units) Forecast by Technology, 2019 to 2034
Table 7: Global Market Value (US$ Million) Forecast by Trim Material, 2019 to 2034
Table 8: Global Market Volume (Units) Forecast by Trim Material, 2019 to 2034
Table 9: Global Market Value (US$ Million) Forecast by Component Type, 2019 to 2034
Table 10: Global Market Volume (Units) Forecast by Component Type, 2019 to 2034
Table 11: North America Market Value (US$ Million) Forecast by Country, 2019 to 2034
Table 12: North America Market Volume (Units) Forecast by Country, 2019 to 2034
Table 13: North America Market Value (US$ Million) Forecast by Seat Type, 2019 to 2034
Table 14: North America Market Volume (Units) Forecast by Seat Type, 2019 to 2034
Table 15: North America Market Value (US$ Million) Forecast by Technology, 2019 to 2034
Table 16: North America Market Volume (Units) Forecast by Technology, 2019 to 2034
Table 17: North America Market Value (US$ Million) Forecast by Trim Material, 2019 to 2034
Table 18: North America Market Volume (Units) Forecast by Trim Material, 2019 to 2034
Table 19: North America Market Value (US$ Million) Forecast by Component Type, 2019 to 2034
Table 20: North America Market Volume (Units) Forecast by Component Type, 2019 to 2034
Table 21: Latin America Market Value (US$ Million) Forecast by Country, 2019 to 2034
Table 22: Latin America Market Volume (Units) Forecast by Country, 2019 to 2034
Table 23: Latin America Market Value (US$ Million) Forecast by Seat Type, 2019 to 2034
Table 24: Latin America Market Volume (Units) Forecast by Seat Type, 2019 to 2034
Table 25: Latin America Market Value (US$ Million) Forecast by Technology, 2019 to 2034
Table 26: Latin America Market Volume (Units) Forecast by Technology, 2019 to 2034
Table 27: Latin America Market Value (US$ Million) Forecast by Trim Material, 2019 to 2034
Table 28: Latin America Market Volume (Units) Forecast by Trim Material, 2019 to 2034
Table 29: Latin America Market Value (US$ Million) Forecast by Component Type, 2019 to 2034
Table 30: Latin America Market Volume (Units) Forecast by Component Type, 2019 to 2034
Table 31: Europe Market Value (US$ Million) Forecast by Country, 2019 to 2034
Table 32: Europe Market Volume (Units) Forecast by Country, 2019 to 2034
Table 33: Europe Market Value (US$ Million) Forecast by Seat Type, 2019 to 2034
Table 34: Europe Market Volume (Units) Forecast by Seat Type, 2019 to 2034
Table 35: Europe Market Value (US$ Million) Forecast by Technology, 2019 to 2034
Table 36: Europe Market Volume (Units) Forecast by Technology, 2019 to 2034
Table 37: Europe Market Value (US$ Million) Forecast by Trim Material, 2019 to 2034
Table 38: Europe Market Volume (Units) Forecast by Trim Material, 2019 to 2034
Table 39: Europe Market Value (US$ Million) Forecast by Component Type, 2019 to 2034
Table 40: Europe Market Volume (Units) Forecast by Component Type, 2019 to 2034
Table 41: East Asia Market Value (US$ Million) Forecast by Country, 2019 to 2034
Table 42: East Asia Market Volume (Units) Forecast by Country, 2019 to 2034
Table 43: East Asia Market Value (US$ Million) Forecast by Seat Type, 2019 to 2034
Table 44: East Asia Market Volume (Units) Forecast by Seat Type, 2019 to 2034
Table 45: East Asia Market Value (US$ Million) Forecast by Technology, 2019 to 2034
Table 46: East Asia Market Volume (Units) Forecast by Technology, 2019 to 2034
Table 47: East Asia Market Value (US$ Million) Forecast by Trim Material, 2019 to 2034
Table 48: East Asia Market Volume (Units) Forecast by Trim Material, 2019 to 2034
Table 49: East Asia Market Value (US$ Million) Forecast by Component Type, 2019 to 2034
Table 50: East Asia Market Volume (Units) Forecast by Component Type, 2019 to 2034
Table 51: South Asia Market Value (US$ Million) Forecast by Country, 2019 to 2034
Table 52: South Asia Market Volume (Units) Forecast by Country, 2019 to 2034
Table 53: South Asia Market Value (US$ Million) Forecast by Seat Type, 2019 to 2034
Table 54: South Asia Market Volume (Units) Forecast by Seat Type, 2019 to 2034
Table 55: South Asia Market Value (US$ Million) Forecast by Technology, 2019 to 2034
Table 56: South Asia Market Volume (Units) Forecast by Technology, 2019 to 2034
Table 57: South Asia Market Value (US$ Million) Forecast by Trim Material, 2019 to 2034
Table 58: South Asia Market Volume (Units) Forecast by Trim Material, 2019 to 2034
Table 59: South Asia Market Value (US$ Million) Forecast by Component Type, 2019 to 2034
Table 60: South Asia Market Volume (Units) Forecast by Component Type, 2019 to 2034
Table 61: Oceania Market Value (US$ Million) Forecast by Country, 2019 to 2034
Table 62: Oceania Market Volume (Units) Forecast by Country, 2019 to 2034
Table 63: Oceania Market Value (US$ Million) Forecast by Seat Type, 2019 to 2034
Table 64: Oceania Market Volume (Units) Forecast by Seat Type, 2019 to 2034
Table 65: Oceania Market Value (US$ Million) Forecast by Technology, 2019 to 2034
Table 66: Oceania Market Volume (Units) Forecast by Technology, 2019 to 2034
Table 67: Oceania Market Value (US$ Million) Forecast by Trim Material, 2019 to 2034
Table 68: Oceania Market Volume (Units) Forecast by Trim Material, 2019 to 2034
Table 69: Oceania Market Value (US$ Million) Forecast by Component Type, 2019 to 2034
Table 70: Oceania Market Volume (Units) Forecast by Component Type, 2019 to 2034
Table 71: MEA Market Value (US$ Million) Forecast by Country, 2019 to 2034
Table 72: MEA Market Volume (Units) Forecast by Country, 2019 to 2034
Table 73: MEA Market Value (US$ Million) Forecast by Seat Type, 2019 to 2034
Table 74: MEA Market Volume (Units) Forecast by Seat Type, 2019 to 2034
Table 75: MEA Market Value (US$ Million) Forecast by Technology, 2019 to 2034
Table 76: MEA Market Volume (Units) Forecast by Technology, 2019 to 2034
Table 77: MEA Market Value (US$ Million) Forecast by Trim Material, 2019 to 2034
Table 78: MEA Market Volume (Units) Forecast by Trim Material, 2019 to 2034
Table 79: MEA Market Value (US$ Million) Forecast by Component Type, 2019 to 2034
Table 80: MEA Market Volume (Units) Forecast by Component Type, 2019 to 2034
Figure 1: Global Market Value (US$ Million) by Seat Type, 2024 to 2034
Figure 2: Global Market Value (US$ Million) by Technology, 2024 to 2034
Figure 3: Global Market Value (US$ Million) by Trim Material, 2024 to 2034
Figure 4: Global Market Value (US$ Million) by Component Type, 2024 to 2034
Figure 5: Global Market Value (US$ Million) by Region, 2024 to 2034
Figure 6: Global Market Value (US$ Million) Analysis by Region, 2019 to 2034
Figure 7: Global Market Volume (Units) Analysis by Region, 2019 to 2034
Figure 8: Global Market Value Share (%) and BPS Analysis by Region, 2024 to 2034
Figure 9: Global Market Y-o-Y Growth (%) Projections by Region, 2024 to 2034
Figure 10: Global Market Value (US$ Million) Analysis by Seat Type, 2019 to 2034
Figure 11: Global Market Volume (Units) Analysis by Seat Type, 2019 to 2034
Figure 12: Global Market Value Share (%) and BPS Analysis by Seat Type, 2024 to 2034
Figure 13: Global Market Y-o-Y Growth (%) Projections by Seat Type, 2024 to 2034
Figure 14: Global Market Value (US$ Million) Analysis by Technology, 2019 to 2034
Figure 15: Global Market Volume (Units) Analysis by Technology, 2019 to 2034
Figure 16: Global Market Value Share (%) and BPS Analysis by Technology, 2024 to 2034
Figure 17: Global Market Y-o-Y Growth (%) Projections by Technology, 2024 to 2034
Figure 18: Global Market Value (US$ Million) Analysis by Trim Material, 2019 to 2034
Figure 19: Global Market Volume (Units) Analysis by Trim Material, 2019 to 2034
Figure 20: Global Market Value Share (%) and BPS Analysis by Trim Material, 2024 to 2034
Figure 21: Global Market Y-o-Y Growth (%) Projections by Trim Material, 2024 to 2034
Figure 22: Global Market Value (US$ Million) Analysis by Component Type, 2019 to 2034
Figure 23: Global Market Volume (Units) Analysis by Component Type, 2019 to 2034
Figure 24: Global Market Value Share (%) and BPS Analysis by Component Type, 2024 to 2034
Figure 25: Global Market Y-o-Y Growth (%) Projections by Component Type, 2024 to 2034
Figure 26: Global Market Attractiveness by Seat Type, 2024 to 2034
Figure 27: Global Market Attractiveness by Technology, 2024 to 2034
Figure 28: Global Market Attractiveness by Trim Material, 2024 to 2034
Figure 29: Global Market Attractiveness by Component Type, 2024 to 2034
Figure 30: Global Market Attractiveness by Region, 2024 to 2034
Figure 31: North America Market Value (US$ Million) by Seat Type, 2024 to 2034
Figure 32: North America Market Value (US$ Million) by Technology, 2024 to 2034
Figure 33: North America Market Value (US$ Million) by Trim Material, 2024 to 2034
Figure 34: North America Market Value (US$ Million) by Component Type, 2024 to 2034
Figure 35: North America Market Value (US$ Million) by Country, 2024 to 2034
Figure 36: North America Market Value (US$ Million) Analysis by Country, 2019 to 2034
Figure 37: North America Market Volume (Units) Analysis by Country, 2019 to 2034
Figure 38: North America Market Value Share (%) and BPS Analysis by Country, 2024 to 2034
Figure 39: North America Market Y-o-Y Growth (%) Projections by Country, 2024 to 2034
Figure 40: North America Market Value (US$ Million) Analysis by Seat Type, 2019 to 2034
Figure 41: North America Market Volume (Units) Analysis by Seat Type, 2019 to 2034
Figure 42: North America Market Value Share (%) and BPS Analysis by Seat Type, 2024 to 2034
Figure 43: North America Market Y-o-Y Growth (%) Projections by Seat Type, 2024 to 2034
Figure 44: North America Market Value (US$ Million) Analysis by Technology, 2019 to 2034
Figure 45: North America Market Volume (Units) Analysis by Technology, 2019 to 2034
Figure 46: North America Market Value Share (%) and BPS Analysis by Technology, 2024 to 2034
Figure 47: North America Market Y-o-Y Growth (%) Projections by Technology, 2024 to 2034
Figure 48: North America Market Value (US$ Million) Analysis by Trim Material, 2019 to 2034
Figure 49: North America Market Volume (Units) Analysis by Trim Material, 2019 to 2034
Figure 50: North America Market Value Share (%) and BPS Analysis by Trim Material, 2024 to 2034
Figure 51: North America Market Y-o-Y Growth (%) Projections by Trim Material, 2024 to 2034
Figure 52: North America Market Value (US$ Million) Analysis by Component Type, 2019 to 2034
Figure 53: North America Market Volume (Units) Analysis by Component Type, 2019 to 2034
Figure 54: North America Market Value Share (%) and BPS Analysis by Component Type, 2024 to 2034
Figure 55: North America Market Y-o-Y Growth (%) Projections by Component Type, 2024 to 2034
Figure 56: North America Market Attractiveness by Seat Type, 2024 to 2034
Figure 57: North America Market Attractiveness by Technology, 2024 to 2034
Figure 58: North America Market Attractiveness by Trim Material, 2024 to 2034
Figure 59: North America Market Attractiveness by Component Type, 2024 to 2034
Figure 60: North America Market Attractiveness by Country, 2024 to 2034
Figure 61: Latin America Market Value (US$ Million) by Seat Type, 2024 to 2034
Figure 62: Latin America Market Value (US$ Million) by Technology, 2024 to 2034
Figure 63: Latin America Market Value (US$ Million) by Trim Material, 2024 to 2034
Figure 64: Latin America Market Value (US$ Million) by Component Type, 2024 to 2034
Figure 65: Latin America Market Value (US$ Million) by Country, 2024 to 2034
Figure 66: Latin America Market Value (US$ Million) Analysis by Country, 2019 to 2034
Figure 67: Latin America Market Volume (Units) Analysis by Country, 2019 to 2034
Figure 68: Latin America Market Value Share (%) and BPS Analysis by Country, 2024 to 2034
Figure 69: Latin America Market Y-o-Y Growth (%) Projections by Country, 2024 to 2034
Figure 70: Latin America Market Value (US$ Million) Analysis by Seat Type, 2019 to 2034
Figure 71: Latin America Market Volume (Units) Analysis by Seat Type, 2019 to 2034
Figure 72: Latin America Market Value Share (%) and BPS Analysis by Seat Type, 2024 to 2034
Figure 73: Latin America Market Y-o-Y Growth (%) Projections by Seat Type, 2024 to 2034
Figure 74: Latin America Market Value (US$ Million) Analysis by Technology, 2019 to 2034
Figure 75: Latin America Market Volume (Units) Analysis by Technology, 2019 to 2034
Figure 76: Latin America Market Value Share (%) and BPS Analysis by Technology, 2024 to 2034
Figure 77: Latin America Market Y-o-Y Growth (%) Projections by Technology, 2024 to 2034
Figure 78: Latin America Market Value (US$ Million) Analysis by Trim Material, 2019 to 2034
Figure 79: Latin America Market Volume (Units) Analysis by Trim Material, 2019 to 2034
Figure 80: Latin America Market Value Share (%) and BPS Analysis by Trim Material, 2024 to 2034
Figure 81: Latin America Market Y-o-Y Growth (%) Projections by Trim Material, 2024 to 2034
Figure 82: Latin America Market Value (US$ Million) Analysis by Component Type, 2019 to 2034
Figure 83: Latin America Market Volume (Units) Analysis by Component Type, 2019 to 2034
Figure 84: Latin America Market Value Share (%) and BPS Analysis by Component Type, 2024 to 2034
Figure 85: Latin America Market Y-o-Y Growth (%) Projections by Component Type, 2024 to 2034
Figure 86: Latin America Market Attractiveness by Seat Type, 2024 to 2034
Figure 87: Latin America Market Attractiveness by Technology, 2024 to 2034
Figure 88: Latin America Market Attractiveness by Trim Material, 2024 to 2034
Figure 89: Latin America Market Attractiveness by Component Type, 2024 to 2034
Figure 90: Latin America Market Attractiveness by Country, 2024 to 2034
Figure 91: Europe Market Value (US$ Million) by Seat Type, 2024 to 2034
Figure 92: Europe Market Value (US$ Million) by Technology, 2024 to 2034
Figure 93: Europe Market Value (US$ Million) by Trim Material, 2024 to 2034
Figure 94: Europe Market Value (US$ Million) by Component Type, 2024 to 2034
Figure 95: Europe Market Value (US$ Million) by Country, 2024 to 2034
Figure 96: Europe Market Value (US$ Million) Analysis by Country, 2019 to 2034
Figure 97: Europe Market Volume (Units) Analysis by Country, 2019 to 2034
Figure 98: Europe Market Value Share (%) and BPS Analysis by Country, 2024 to 2034
Figure 99: Europe Market Y-o-Y Growth (%) Projections by Country, 2024 to 2034
Figure 100: Europe Market Value (US$ Million) Analysis by Seat Type, 2019 to 2034
Figure 101: Europe Market Volume (Units) Analysis by Seat Type, 2019 to 2034
Figure 102: Europe Market Value Share (%) and BPS Analysis by Seat Type, 2024 to 2034
Figure 103: Europe Market Y-o-Y Growth (%) Projections by Seat Type, 2024 to 2034
Figure 104: Europe Market Value (US$ Million) Analysis by Technology, 2019 to 2034
Figure 105: Europe Market Volume (Units) Analysis by Technology, 2019 to 2034
Figure 106: Europe Market Value Share (%) and BPS Analysis by Technology, 2024 to 2034
Figure 107: Europe Market Y-o-Y Growth (%) Projections by Technology, 2024 to 2034
Figure 108: Europe Market Value (US$ Million) Analysis by Trim Material, 2019 to 2034
Figure 109: Europe Market Volume (Units) Analysis by Trim Material, 2019 to 2034
Figure 110: Europe Market Value Share (%) and BPS Analysis by Trim Material, 2024 to 2034
Figure 111: Europe Market Y-o-Y Growth (%) Projections by Trim Material, 2024 to 2034
Figure 112: Europe Market Value (US$ Million) Analysis by Component Type, 2019 to 2034
Figure 113: Europe Market Volume (Units) Analysis by Component Type, 2019 to 2034
Figure 114: Europe Market Value Share (%) and BPS Analysis by Component Type, 2024 to 2034
Figure 115: Europe Market Y-o-Y Growth (%) Projections by Component Type, 2024 to 2034
Figure 116: Europe Market Attractiveness by Seat Type, 2024 to 2034
Figure 117: Europe Market Attractiveness by Technology, 2024 to 2034
Figure 118: Europe Market Attractiveness by Trim Material, 2024 to 2034
Figure 119: Europe Market Attractiveness by Component Type, 2024 to 2034
Figure 120: Europe Market Attractiveness by Country, 2024 to 2034
Figure 121: East Asia Market Value (US$ Million) by Seat Type, 2024 to 2034
Figure 122: East Asia Market Value (US$ Million) by Technology, 2024 to 2034
Figure 123: East Asia Market Value (US$ Million) by Trim Material, 2024 to 2034
Figure 124: East Asia Market Value (US$ Million) by Component Type, 2024 to 2034
Figure 125: East Asia Market Value (US$ Million) by Country, 2024 to 2034
Figure 126: East Asia Market Value (US$ Million) Analysis by Country, 2019 to 2034
Figure 127: East Asia Market Volume (Units) Analysis by Country, 2019 to 2034
Figure 128: East Asia Market Value Share (%) and BPS Analysis by Country, 2024 to 2034
Figure 129: East Asia Market Y-o-Y Growth (%) Projections by Country, 2024 to 2034
Figure 130: East Asia Market Value (US$ Million) Analysis by Seat Type, 2019 to 2034
Figure 131: East Asia Market Volume (Units) Analysis by Seat Type, 2019 to 2034
Figure 132: East Asia Market Value Share (%) and BPS Analysis by Seat Type, 2024 to 2034
Figure 133: East Asia Market Y-o-Y Growth (%) Projections by Seat Type, 2024 to 2034
Figure 134: East Asia Market Value (US$ Million) Analysis by Technology, 2019 to 2034
Figure 135: East Asia Market Volume (Units) Analysis by Technology, 2019 to 2034
Figure 136: East Asia Market Value Share (%) and BPS Analysis by Technology, 2024 to 2034
Figure 137: East Asia Market Y-o-Y Growth (%) Projections by Technology, 2024 to 2034
Figure 138: East Asia Market Value (US$ Million) Analysis by Trim Material, 2019 to 2034
Figure 139: East Asia Market Volume (Units) Analysis by Trim Material, 2019 to 2034
Figure 140: East Asia Market Value Share (%) and BPS Analysis by Trim Material, 2024 to 2034
Figure 141: East Asia Market Y-o-Y Growth (%) Projections by Trim Material, 2024 to 2034
Figure 142: East Asia Market Value (US$ Million) Analysis by Component Type, 2019 to 2034
Figure 143: East Asia Market Volume (Units) Analysis by Component Type, 2019 to 2034
Figure 144: East Asia Market Value Share (%) and BPS Analysis by Component Type, 2024 to 2034
Figure 145: East Asia Market Y-o-Y Growth (%) Projections by Component Type, 2024 to 2034
Figure 146: East Asia Market Attractiveness by Seat Type, 2024 to 2034
Figure 147: East Asia Market Attractiveness by Technology, 2024 to 2034
Figure 148: East Asia Market Attractiveness by Trim Material, 2024 to 2034
Figure 149: East Asia Market Attractiveness by Component Type, 2024 to 2034
Figure 150: East Asia Market Attractiveness by Country, 2024 to 2034
Figure 151: South Asia Market Value (US$ Million) by Seat Type, 2024 to 2034
Figure 152: South Asia Market Value (US$ Million) by Technology, 2024 to 2034
Figure 153: South Asia Market Value (US$ Million) by Trim Material, 2024 to 2034
Figure 154: South Asia Market Value (US$ Million) by Component Type, 2024 to 2034
Figure 155: South Asia Market Value (US$ Million) by Country, 2024 to 2034
Figure 156: South Asia Market Value (US$ Million) Analysis by Country, 2019 to 2034
Figure 157: South Asia Market Volume (Units) Analysis by Country, 2019 to 2034
Figure 158: South Asia Market Value Share (%) and BPS Analysis by Country, 2024 to 2034
Figure 159: South Asia Market Y-o-Y Growth (%) Projections by Country, 2024 to 2034
Figure 160: South Asia Market Value (US$ Million) Analysis by Seat Type, 2019 to 2034
Figure 161: South Asia Market Volume (Units) Analysis by Seat Type, 2019 to 2034
Figure 162: South Asia Market Value Share (%) and BPS Analysis by Seat Type, 2024 to 2034
Figure 163: South Asia Market Y-o-Y Growth (%) Projections by Seat Type, 2024 to 2034
Figure 164: South Asia Market Value (US$ Million) Analysis by Technology, 2019 to 2034
Figure 165: South Asia Market Volume (Units) Analysis by Technology, 2019 to 2034
Figure 166: South Asia Market Value Share (%) and BPS Analysis by Technology, 2024 to 2034
Figure 167: South Asia Market Y-o-Y Growth (%) Projections by Technology, 2024 to 2034
Figure 168: South Asia Market Value (US$ Million) Analysis by Trim Material, 2019 to 2034
Figure 169: South Asia Market Volume (Units) Analysis by Trim Material, 2019 to 2034
Figure 170: South Asia Market Value Share (%) and BPS Analysis by Trim Material, 2024 to 2034
Figure 171: South Asia Market Y-o-Y Growth (%) Projections by Trim Material, 2024 to 2034
Figure 172: South Asia Market Value (US$ Million) Analysis by Component Type, 2019 to 2034
Figure 173: South Asia Market Volume (Units) Analysis by Component Type, 2019 to 2034
Figure 174: South Asia Market Value Share (%) and BPS Analysis by Component Type, 2024 to 2034
Figure 175: South Asia Market Y-o-Y Growth (%) Projections by Component Type, 2024 to 2034
Figure 176: South Asia Market Attractiveness by Seat Type, 2024 to 2034
Figure 177: South Asia Market Attractiveness by Technology, 2024 to 2034
Figure 178: South Asia Market Attractiveness by Trim Material, 2024 to 2034
Figure 179: South Asia Market Attractiveness by Component Type, 2024 to 2034
Figure 180: South Asia Market Attractiveness by Country, 2024 to 2034
Figure 181: Oceania Market Value (US$ Million) by Seat Type, 2024 to 2034
Figure 182: Oceania Market Value (US$ Million) by Technology, 2024 to 2034
Figure 183: Oceania Market Value (US$ Million) by Trim Material, 2024 to 2034
Figure 184: Oceania Market Value (US$ Million) by Component Type, 2024 to 2034
Figure 185: Oceania Market Value (US$ Million) by Country, 2024 to 2034
Figure 186: Oceania Market Value (US$ Million) Analysis by Country, 2019 to 2034
Figure 187: Oceania Market Volume (Units) Analysis by Country, 2019 to 2034
Figure 188: Oceania Market Value Share (%) and BPS Analysis by Country, 2024 to 2034
Figure 189: Oceania Market Y-o-Y Growth (%) Projections by Country, 2024 to 2034
Figure 190: Oceania Market Value (US$ Million) Analysis by Seat Type, 2019 to 2034
Figure 191: Oceania Market Volume (Units) Analysis by Seat Type, 2019 to 2034
Figure 192: Oceania Market Value Share (%) and BPS Analysis by Seat Type, 2024 to 2034
Figure 193: Oceania Market Y-o-Y Growth (%) Projections by Seat Type, 2024 to 2034
Figure 194: Oceania Market Value (US$ Million) Analysis by Technology, 2019 to 2034
Figure 195: Oceania Market Volume (Units) Analysis by Technology, 2019 to 2034
Figure 196: Oceania Market Value Share (%) and BPS Analysis by Technology, 2024 to 2034
Figure 197: Oceania Market Y-o-Y Growth (%) Projections by Technology, 2024 to 2034
Figure 198: Oceania Market Value (US$ Million) Analysis by Trim Material, 2019 to 2034
Figure 199: Oceania Market Volume (Units) Analysis by Trim Material, 2019 to 2034
Figure 200: Oceania Market Value Share (%) and BPS Analysis by Trim Material, 2024 to 2034
Figure 201: Oceania Market Y-o-Y Growth (%) Projections by Trim Material, 2024 to 2034
Figure 202: Oceania Market Value (US$ Million) Analysis by Component Type, 2019 to 2034
Figure 203: Oceania Market Volume (Units) Analysis by Component Type, 2019 to 2034
Figure 204: Oceania Market Value Share (%) and BPS Analysis by Component Type, 2024 to 2034
Figure 205: Oceania Market Y-o-Y Growth (%) Projections by Component Type, 2024 to 2034
Figure 206: Oceania Market Attractiveness by Seat Type, 2024 to 2034
Figure 207: Oceania Market Attractiveness by Technology, 2024 to 2034
Figure 208: Oceania Market Attractiveness by Trim Material, 2024 to 2034
Figure 209: Oceania Market Attractiveness by Component Type, 2024 to 2034
Figure 210: Oceania Market Attractiveness by Country, 2024 to 2034
Figure 211: MEA Market Value (US$ Million) by Seat Type, 2024 to 2034
Figure 212: MEA Market Value (US$ Million) by Technology, 2024 to 2034
Figure 213: MEA Market Value (US$ Million) by Trim Material, 2024 to 2034
Figure 214: MEA Market Value (US$ Million) by Component Type, 2024 to 2034
Figure 215: MEA Market Value (US$ Million) by Country, 2024 to 2034
Figure 216: MEA Market Value (US$ Million) Analysis by Country, 2019 to 2034
Figure 217: MEA Market Volume (Units) Analysis by Country, 2019 to 2034
Figure 218: MEA Market Value Share (%) and BPS Analysis by Country, 2024 to 2034
Figure 219: MEA Market Y-o-Y Growth (%) Projections by Country, 2024 to 2034
Figure 220: MEA Market Value (US$ Million) Analysis by Seat Type, 2019 to 2034
Figure 221: MEA Market Volume (Units) Analysis by Seat Type, 2019 to 2034
Figure 222: MEA Market Value Share (%) and BPS Analysis by Seat Type, 2024 to 2034
Figure 223: MEA Market Y-o-Y Growth (%) Projections by Seat Type, 2024 to 2034
Figure 224: MEA Market Value (US$ Million) Analysis by Technology, 2019 to 2034
Figure 225: MEA Market Volume (Units) Analysis by Technology, 2019 to 2034
Figure 226: MEA Market Value Share (%) and BPS Analysis by Technology, 2024 to 2034
Figure 227: MEA Market Y-o-Y Growth (%) Projections by Technology, 2024 to 2034
Figure 228: MEA Market Value (US$ Million) Analysis by Trim Material, 2019 to 2034
Figure 229: MEA Market Volume (Units) Analysis by Trim Material, 2019 to 2034
Figure 230: MEA Market Value Share (%) and BPS Analysis by Trim Material, 2024 to 2034
Figure 231: MEA Market Y-o-Y Growth (%) Projections by Trim Material, 2024 to 2034
Figure 232: MEA Market Value (US$ Million) Analysis by Component Type, 2019 to 2034
Figure 233: MEA Market Volume (Units) Analysis by Component Type, 2019 to 2034
Figure 234: MEA Market Value Share (%) and BPS Analysis by Component Type, 2024 to 2034
Figure 235: MEA Market Y-o-Y Growth (%) Projections by Component Type, 2024 to 2034
Figure 236: MEA Market Attractiveness by Seat Type, 2024 to 2034
Figure 237: MEA Market Attractiveness by Technology, 2024 to 2034
Figure 238: MEA Market Attractiveness by Trim Material, 2024 to 2034
Figure 239: MEA Market Attractiveness by Component Type, 2024 to 2034
Figure 240: MEA Market Attractiveness by Country, 2024 to 2034
The passenger car seat market is projected to reach a valuation of USD 43.6 billion in 2024.
The passenger car seat industry is set to expand by a CAGR of 1.5% through 2034.
The passenger car seat market is forecast to reach USD 50.4 billion by 2034.
Korea is expected to be the top performing market, exhibiting a CAGR of 3.4% through 2034.
Bucket segment is preferred, and is expected to account for a CAGR of 1.3% through 2034.
Explore Similar Insights
Thank you!
You will receive an email from our Business Development Manager. Please be sure to check your SPAM/JUNK folder too.