Phospholipid Market Size and Share Forecast Outlook 2025 to 2035

The phospholipid market is estimated to be valued at USD 2.0 billion in 2025 and is projected to reach USD 6.0 billion by 2035, registering a compound annual growth rate (CAGR) of 11.6% over the forecast period. This represents an absolute dollar opportunity of USD 4.0 billion, reflecting nearly 3x growth across the decade.
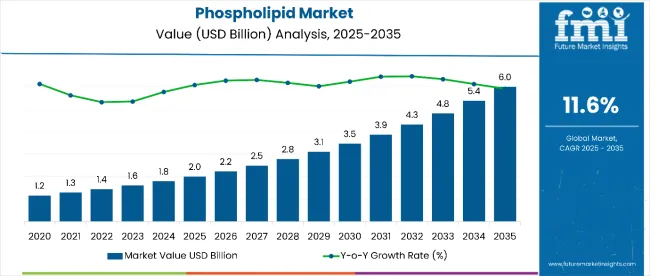
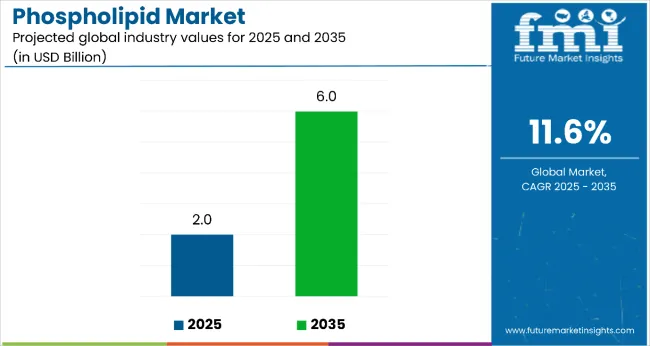
Phospholipid Market Value Analysis

Quick Stats for Phospholipid Market

  • Phospholipid Market Value (2025): USD 2.0 billion
  • Phospholipid Market Forecast Value (2035): USD 6.0 billion
  • Phospholipid Market Forecast CAGR: 11.6%
  • Leading Segment in Phospholipid Market in 2025: Soy (44.0%)
  • Key Growth Regions in Phospholipid Market: North America, Asia-Pacific, Europe
  • Top Key Players in Phospholipid Market: Avanti Polar Lipids Inc., Bunge Ltd., Cargill Inc., DowDuPont Inc., Kewpie Corporation, LasenorEmul SL, Lecico GmbH, Lipoid GmbH, Wilmar International Ltd, VAV Life Sciences Pvt. Ltd.

Phospholipid Market

Market expansion is expected to be driven by the rising demand for natural emulsifiers, advanced drug delivery systems, and functional food ingredients, particularly where biocompatibility and membrane stability are essential.

By 2030, the market is expected to reach approximately USD 3.5 billion, contributing USD 1.5 billion in incremental value during the first half of the forecast period. The remaining USD 2.5 billion will likely materialize in the second half, indicating a back-loaded growth pattern. Product innovation in liposomal formulations and nanoencapsulation technologies is accelerating adoption, given phospholipids’ ability to enhance bioavailability and support cell membrane integration.

Leading companies such as Cargill and Lipoid GmbH are strengthening their competitive positions through investments in extraction technologies and scalable production systems. Innovation-driven procurement strategies are enabling deeper penetration into pharmaceutical drug delivery, nutraceutical formulations, and premium cosmetic applications. Market performance will remain heavily dependent on regulatory compliance, stringent purity standards, and evolving sourcing benchmarks.

The phospholipid market holds approximately 42% share of the natural emulsifiers market, driven by its biocompatibility, membrane stability, and compatibility with pharmaceutical and nutraceutical applications. It accounts for around 35% of the functional lipids market, supported by its critical role in drug delivery systems and cellular membrane enhancement.

The market contributes nearly 28% to the specialty ingredients segment, particularly for liposomal formulations, dietary supplements, and cosmetic applications. It represents close to 24% of the pharmaceutical excipients market, where phospholipids are utilized for solubility improvement and controlled-release mechanisms. In the nutraceutical ingredients market, its share reaches about 32%, reflecting preference among manufacturers for bioactive compounds targeting cognitive health and cardiovascular wellness.

The market is undergoing a structural transformation driven by rising demand for natural and functional ingredients across pharmaceutical, nutraceutical, and cosmetic sectors. Advanced processing technologies such as enzymatic extraction and membrane filtration have improved purity, bioactivity, and stability, making phospholipids a compelling alternative to synthetic emulsifiers and drug carriers.

Manufacturers are introducing standardized grades and specialized formulations tailored for targeted applications in pharmaceuticals, nutraceuticals, and cosmetics, expanding beyond traditional food-based roles. Strategic partnerships between ingredient suppliers and pharmaceutical firms are accelerating adoption in advanced drug delivery platforms. Additionally, regulatory approvals and adherence to stringent quality certifications have enhanced global market access, supporting premium positioning strategies and reinforcing trust in high-purity phospholipid solutions.

Why is the Phospholipid Market Growing?

Phospholipids offer proven biocompatibility, membrane integration properties, and superior emulsification capabilities, making them a preferred alternative to synthetic ingredients in pharmaceutical, nutraceutical, and cosmetic formulations. Increasing awareness of natural and functional ingredients is accelerating their adoption, particularly in drug delivery systems and cognitive health supplements.

Rising consumer preference for clean-label products, coupled with advancements in extraction and purification technologies, is enhancing product quality and expanding application scope. As pharmaceutical and nutraceutical industries continue to emphasize bioactive compounds and advanced delivery solutions, the market outlook remains strong. With both manufacturers and consumers prioritizing efficacy, natural origin, and safety, phospholipids are positioned to achieve significant growth across diverse end-use sectors.

Segmental Analysis

The market is segmented by source, form, application, and region. By source, the market includes soy, eggs, and others. Based on Form, the market is bifurcated into powder and granule. In terms of application, the market is divide into nutrition & supplements, pharmaceuticals, and others. Regionally, the market is classified into North America, Latin America, Europe, Asia Pacific, and the Middle East & Africa.
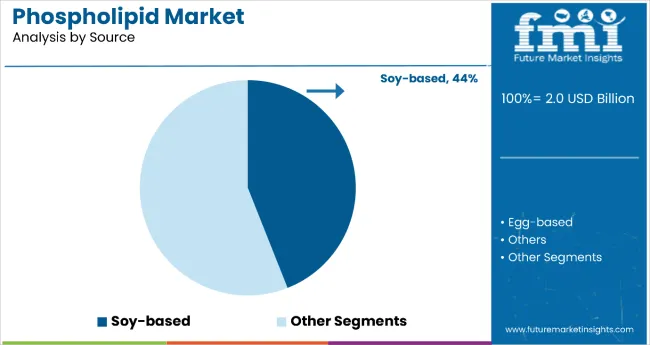
By Source, Soy Accounts for 44.0% of the Market Share in 2025

Phospholipid Market By Source

The soy segment holds a leading 44.0% share in the source category, reflecting its abundant availability, cost-effectiveness, and well-established extraction processes. Soy-derived phospholipids are increasingly preferred due to their plant-based origin, non-GMO availability, and compliance with vegan and vegetarian dietary preferences.

The segment benefits from rising consumer demand for plant-based ingredients that align with sustainability and clean-label trends. Manufacturers are focusing on expanding organic and non-GMO soy phospholipid production capabilities, catering to both pharmaceutical and nutraceutical markets.

As regulatory standards for plant-based ingredients become more favorable and consumer awareness of sustainable sourcing increases, soy phospholipids' role as a preferred natural emulsifier and functional ingredient is expected to strengthen, supporting steady growth trajectory across global markets.
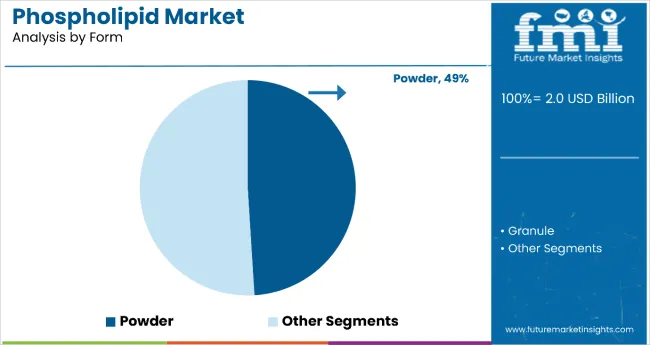
By Form, the Powder Segment Accounts for 49.0% of the Market Share

Phospholipid Market By Form

The powder segment dominates the form category with a 49.0% market share, driven by enhanced stability, longer shelf life, and superior handling characteristics in pharmaceutical and nutraceutical manufacturing. Powder phospholipids eliminate moisture-related degradation issues and provide consistent flowability for various formulation requirements.

The segment continues to benefit from pharmaceutical companies' preference for stable, standardized ingredients that support quality control and regulatory compliance. Innovations in spray-drying and microencapsulation technologies have made powder phospholipids more effective for specialized applications.

As the pharmaceutical and nutraceutical industries continue to prioritize ingredient stability and processing efficiency, powder phospholipids are expected to maintain strong demand within the broader functional ingredients landscape, particularly in drug delivery and supplement formulations.
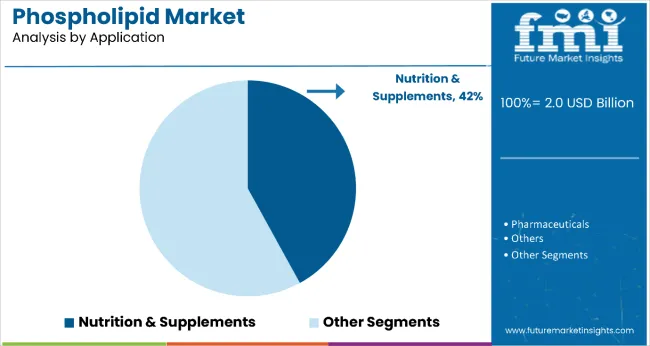
By Application, Nutrition and Supplements Account for 42% of the Market Share

Phospholipid Market By Application

The nutrition and supplements segment accounts for 42% of the application category, reflecting the increasing demand for cognitive health supplements, cardiovascular wellness products, and functional food ingredients. Phospholipids are gaining popularity for their proven cell membrane support and bioavailability enhancement properties.

Manufacturers are enhancing application capabilities within this segment by incorporating specialized phospholipid complexes and standardized extracts, making them highly effective for both standalone supplements and fortified functional foods.

The segment's sustained adoption is supported by its compatibility with various delivery systems and proven health benefits. With increasing consumer awareness of cognitive health and preventive nutrition, phospholipids are positioned for continued market expansion across multiple nutraceutical and functional food applications.

What are the Drivers, Restraints, and Key Trends of the Phospholipid Market?

From 2025 to 2035, pharmaceutical companies are adopting advanced drug delivery technologies to improve bioavailability, minimize side effects, and enhance therapeutic performance. This shift positions phospholipid suppliers providing high-purity, pharmaceutical-grade materials as strategic partners in next-generation drug formulations and targeted delivery systems. As pharmaceutical and nutraceutical sectors continue to expand, phospholipids are emerging as essential components in advanced applications, reinforcing their role in global healthcare innovation.

Rising Pharmaceutical Innovation Drives Phospholipid Market Growth

The steady increase in pharmaceutical R&D investments and the growing focus on advanced drug delivery systems are the primary growth drivers for the phospholipid market. In 2024, breakthroughs in liposomal delivery systems accelerated the incorporation of phospholipids in innovative drug formulations worldwide.

By 2025, manufacturers are expected to adopt bioavailability enhancers and membrane-targeting molecules to meet regulatory requirements and improve clinical outcomes. These developments confirm that sustained pharmaceutical innovation, rather than short-term demand fluctuations, is propelling market growth. Producers offering high-purity, pharmaceutical-grade phospholipids with proven biocompatibility are well-positioned to capture consistent demand from drug developers.

Regulatory Challenges and High Production Costs Limit Growth

Despite strong demand, the phospholipid market faces significant challenges due to high production costs and stringent regulatory requirements. Advanced extraction and purification processes increase operational expenses, making it difficult for smaller manufacturers to compete effectively.

In addition, global compliance frameworks governing pharmaceutical and nutraceutical formulations require rigorous testing and certification, extending product approval timelines. These factors, combined with volatility in raw material availability, create structural barriers to rapid market scalability. Companies lacking advanced technical capabilities or financial resources may find it challenging to maintain competitiveness in this evolving landscape.

Key Trends Shaping Phospholipid Market Evolution

The integration of nanotechnology with phospholipid-based carriers has become a defining trend, improving drug solubility and optimizing therapeutic performance. Liposomal platforms are gaining prominence in oncology treatments and chronic disease management, while cognitive health supplements are fueling nutraceutical demand. Growing interest in plant-based sourcing and clean-label formulations is influencing purchasing decisions across pharmaceutical and personal care sectors.

In parallel, technological improvements in enzyme-assisted extraction and membrane filtration are enhancing yield and quality, paving the way for wider applications in high-value markets such as advanced therapeutics, functional foods, and premium cosmetics.
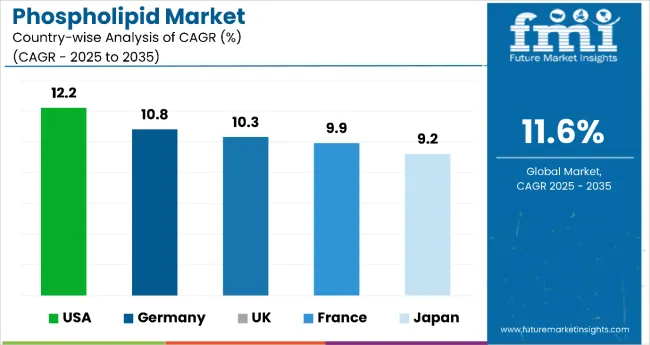
Analysis of the Phospholipid Market By Key Countries

Country Wise Analysis Of Phospholipid Market

Country CAGR
USA 12.2%
Germany 10.8%
UK 10.3%
France 9.9%
Japan 9.2%

In the phospholipid market, the United States leads among developed economies with a CAGR of 12.2%, driven by strong pharmaceutical and nutraceutical demand. Germany follows at 10.8%, supported by biotechnology research and high-quality drug delivery applications. The United Kingdom posts a 10.3% CAGR, with growth fueled by innovation in functional health ingredients.

France sees a 9.9% CAGR, reflecting its focus on cognitive health and R&D-driven therapies. Japan, with a 9.2% CAGR, shows steady growth led by aging population needs and advanced pharmaceutical applications. All five countries demonstrate strong, innovation-led momentum in phospholipid adoption across health sectors.

The report covers an in-depth analysis of 40+ countries; five top-performing OECD countries are highlighted below.

Phospholipid Market Outlook in the United States

The USA phospholipid market is projected to expand at a CAGR of 12.2%, driven by growing demand for advanced drug delivery systems and high-end nutraceuticals. USA based pharmaceutical giants are integrating phospholipids into liposomal formulations and nanoparticle-based therapies. The increasing prevalence of neurodegenerative and metabolic disorders is also fueling the adoption of phosphatidylcholine and phosphatidylserine-based products.

  • Liposomal drug delivery and nano-formulations are driving phospholipid integration in advanced therapeutics.
  • Nutraceutical brands are adopting phospholipids for brain, liver, and cardiovascular health supplements.
  • FDA-regulated manufacturing supports global exports of high-purity phospholipid products.

Growth Analysis of Phospholipid Market in the UK

The phospholipid market in the UK is projected to grow at a CAGR of 10.3%, shaped by pharmaceutical innovation and increasing demand for functional health ingredients. British pharmaceutical companies are investing in phospholipid-based drug delivery systems to enhance therapeutic efficacy and ensure regulatory compliance. Nutraceutical firms are incorporating phospholipids into premium dietary supplements aimed at cognitive performance and healthy aging.

  • Pharmaceutical innovation is driving adoption of phospholipid-based delivery systems.
  • Nutraceutical companies are prioritizing phospholipids for premium health supplement formulations.
  • Regulatory support is facilitating development of advanced therapeutic applications.

Demand Forecast for Phospholipids in Germany

Revenue from phospholipids in Germany is anticipated to expand at a CAGR of 10.8%, driven by stringent pharmaceutical quality standards and advanced biotechnology research. Leading pharmaceutical companies are developing specialized phospholipid formulations for targeted drug delivery applications. A strong regulatory framework is supporting innovation in liposomal therapeutics and advanced drug carrier systems.

  • Pharmaceutical companies are prioritizing high-purity phospholipids for drug delivery applications.
  • Biotechnology innovations are enhancing phospholipid functionality and therapeutic efficacy.
  • Regulatory compliance is ensuring quality standards for global pharmaceutical markets.

Growth Analysis of the Phospholipid Market in France

Phospholipid sales in France are expected to rise at a CAGR of 9.9%, supported by the country’s strong pharmaceutical sector and premium nutraceutical market. French companies are integrating phospholipids into innovative drug formulations and high-end cognitive health supplements targeting global markets. A strong focus on research and development is driving advanced applications in personalized medicine and functional nutrition.

  • Pharmaceutical companies are incorporating phospholipids into innovative drug delivery systems.
  • Premium nutraceutical brands are using phospholipids for cognitive health formulations.
  • R&D investments are driving advanced applications in personalized therapeutic solutions.

Phospholipid Market Outlook in Japan

The phospholipid market in Japan is projected to grow at a CAGR of 9.2%, driven by rising demand for cognitive health products and advanced pharmaceutical formulations. Domestic companies are incorporating phospholipids into supplements targeting aging populations, while pharmaceutical firms are focusing on liposomal drug delivery technologies. Japan’s emphasis on health and wellness across sectors such as cosmetics, functional foods, and precision medicine is expanding the application scope of phospholipids.

  • Nutrition and supplements dominate due to an aging population and cognitive health awareness.
  • Pharmaceutical applications highlight Japan’s leadership in drug delivery technology innovation.
  • Market distribution reflects Japan’s focus on health and wellness across multiple sectors.

Competitive Landscape of the Phospholipid Market

The phospholipid market is moderately consolidated, characterized by established ingredient suppliers with varying levels of extraction expertise and application specialization. Cargill Inc. and Lipoid GmbH dominate the pharmaceutical-grade segment, supplying high-purity phospholipids for advanced drug delivery systems and therapeutic formulations. Their competitive advantage lies in advanced purification technologies and strong regulatory compliance capabilities.

Avanti Polar Lipids Inc. differentiates itself through research-grade solutions, offering specialized phospholipid variants and custom synthesis services for pharmaceutical research and biotechnology applications. Bunge Ltd. and Wilmar International Ltd. focus on large-scale production and cost-efficient extraction processes to meet rising demand for food-grade and nutraceutical phospholipids in mainstream markets.

Regional manufacturers such as Kewpie Corporation and VAV Life Sciences leverage local market knowledge and specialized formulations to maintain quality consistency and ensure reliable supply chains for domestic pharmaceutical and nutraceutical firms. Meanwhile, established chemical companies like DowDuPont are investing in phospholipid production capabilities to strengthen and diversify their specialty ingredient portfolios.

Entry barriers remain high due to challenges in purification technology optimization, stringent regulatory compliance, and quality standardization across pharmaceutical and nutraceutical applications. Competitive advantage is increasingly determined by purity levels, regulatory certifications, and demonstrated efficacy across therapeutic and functional food domains.

Key Developments in the Phospholipid Market

In September 2024, Avanti Polar Lipids rebranded as Avanti Research under Croda, expanding its focus on lipid molecules and tools for therapeutic lipid delivery. This change improves global access to its phospholipid products for pharmaceutical and biotech research.

Scope of the Report

Item Value
Quantitative Units USD 2.0 Billion
Source Soy, Eggs, and Others
Form Powder and Granule
Application Nutrition & Supplements, Pharmaceuticals, and Others
Regions Covered North America, Europe, Asia-Pacific, Latin America, Middle East & Africa
Country Covered United States, Canada, Germany, France, United Kingdom, China, Japan, India, Brazil, South Africa, and 40+ countries
Key Companies Profiled Avanti Polar Lipids, Inc., Bunge Ltd., Cargill, Inc., DowDuPont, Inc., Kewpie Corporation, Lasenor Emul SL, Lecico GmbH, Lipoid GmbH, Wilmar International Ltd, and VAV Life Sciences Pvt. Ltd.
Additional Attributes Dollar sales by source and application sector, growing usage in drug delivery and nutraceutical applications for pharmaceutical and wellness products, stable demand in functional food and cosmetic applications, innovations in extraction technology and purification methods improve purity, bioavailability, and regulatory compliance

Key Segmentation

By Source:

  • Soy
  • Eggs
  • Others

By Form:

  • Powder
  • Granule

By Application:

  • Nutrition & Supplements
  • Pharmaceuticals
  • Others

By Region:

  • North America
  • Latin America
  • Western Europe
  • South Asia & Pacific
  • East Asia
  • Middle East
  • Africa

Table of Content

  1. Executive Summary
    • Global Market Outlook
    • Demand-side Trends
    • Supply-side Trends
    • Technology Roadmap Analysis
    • Analysis and Recommendations
  2. Market Overview
    • Market Coverage / Taxonomy
    • Market Definition / Scope / Limitations
  3. Market Background
    • Market Dynamics
      • Drivers
      • Restraints
      • Opportunity
      • Trends
    • Scenario Forecast
      • Demand in Optimistic Scenario
      • Demand in Likely Scenario
      • Demand in Conservative Scenario
    • Opportunity Map Analysis
    • Product Life Cycle Analysis
    • Supply Chain Analysis
      • Supply Side Participants and their Roles
        • Producers
        • Mid-Level Participants (Traders/ Agents/ Brokers)
        • Wholesalers and Distributors
      • Value Added and Value Created at Node in the Supply Chain
      • List of Raw Material Suppliers
      • List of Existing and Potential Buyer’s
    • Investment Feasibility Matrix
    • Value Chain Analysis
      • Profit Margin Analysis
      • Wholesalers and Distributors
      • Retailers
    • PESTLE and Porter’s Analysis
    • Regulatory Landscape
      • By Key Regions
      • By Key Countries
    • Regional Parent Market Outlook
    • Production and Consumption Statistics
    • Import and Export Statistics
  4. Global Market Analysis 2020 to 2024 and Forecast, 2025 to 2035
    • Historical Market Size Value (USD Billion) & Volume (Metric Tons) Analysis, 2020 to 2024
    • Current and Future Market Size Value (USD Billion) & Volume (Metric Tons) Projections, 2025 to 2035
      • Y-o-Y Growth Trend Analysis
      • Absolute $ Opportunity Analysis
  5. Global Market Pricing Analysis 2020 to 2024 and Forecast 2025 to 2035
  6. Global Market Analysis 2020 to 2024 and Forecast 2025 to 2035, By Source
    • Introduction / Key Findings
    • Historical Market Size Value (USD Billion) & Volume (Metric Tons) Analysis By Source, 2020 to 2024
    • Current and Future Market Size Value (USD Billion) & Volume (Metric Tons) Analysis and Forecast By Source, 2025 to 2035
      • Soy
      • Eggs
      • Others
    • Y-o-Y Growth Trend Analysis By Source, 2020 to 2024
    • Absolute $ Opportunity Analysis By Source, 2025 to 2035
  7. Global Market Analysis 2020 to 2024 and Forecast 2025 to 2035, By Form
    • Introduction / Key Findings
    • Historical Market Size Value (USD Billion) & Volume (Metric Tons) Analysis By Form, 2020 to 2024
    • Current and Future Market Size Value (USD Billion) & Volume (Metric Tons) Analysis and Forecast By Form, 2025 to 2035
      • Powder
      • Granule
    • Y-o-Y Growth Trend Analysis By Form, 2020 to 2024
    • Absolute $ Opportunity Analysis By Form, 2025 to 2035
  8. Global Market Analysis 2020 to 2024 and Forecast 2025 to 2035, By Application
    • Introduction / Key Findings
    • Historical Market Size Value (USD Billion) & Volume (Metric Tons) Analysis By Application, 2020 to 2024
    • Current and Future Market Size Value (USD Billion) & Volume (Metric Tons) Analysis and Forecast By Application, 2025 to 2035
      • Nutrition & Supplements
      • Pharmaceuticals
      • Others
    • Y-o-Y Growth Trend Analysis By Application, 2020 to 2024
    • Absolute $ Opportunity Analysis By Application, 2025 to 2035
  9. Global Market Analysis 2020 to 2024 and Forecast 2025 to 2035, By Region
    • Introduction
    • Historical Market Size Value (USD Billion) & Volume (Metric Tons) Analysis By Region, 2020 to 2024
    • Current Market Size Value (USD Billion) & Volume (Metric Tons) Analysis and Forecast By Region, 2025 to 2035
      • North America
      • Latin America
      • Western Europe
      • Eastern Europe
      • East Asia
      • South Asia & Pacific
      • Middle East and Africa
    • Market Attractiveness Analysis By Region
  10. North America Market Analysis 2020 to 2024 and Forecast 2025 to 2035, By Country
    • Historical Market Size Value (USD Billion) & Volume (Metric Tons) Trend Analysis By Market Taxonomy, 2020 to 2024
    • Market Size Value (USD Billion) & Volume (Metric Tons) Forecast By Market Taxonomy, 2025 to 2035
      • By Country
        • USA
        • Canada
        • Mexico
      • By Source
      • By Form
      • By Application
    • Market Attractiveness Analysis
      • By Country
      • By Source
      • By Form
      • By Application
    • Key Takeaways
  11. Latin America Market Analysis 2020 to 2024 and Forecast 2025 to 2035, By Country
    • Historical Market Size Value (USD Billion) & Volume (Metric Tons) Trend Analysis By Market Taxonomy, 2020 to 2024
    • Market Size Value (USD Billion) & Volume (Metric Tons) Forecast By Market Taxonomy, 2025 to 2035
      • By Country
        • Brazil
        • Argentina
        • Rest of LATAM
      • By Source
      • By Form
      • By Application
    • Market Attractiveness Analysis
      • By Country
      • By Source
      • By Form
      • By Application
    • Key Takeaways
  12. Western Europe Market Analysis 2020 to 2024 and Forecast 2025 to 2035, By Country
    • Historical Market Size Value (USD Billion) & Volume (Metric Tons) Trend Analysis By Market Taxonomy, 2020 to 2024
    • Market Size Value (USD Billion) & Volume (Metric Tons) Forecast By Market Taxonomy, 2025 to 2035
      • By Country
        • Germany
        • Italy
        • France
        • UK
        • Spain
        • BENELUX
        • Nordic
        • Rest of W.Europe
      • By Source
      • By Form
      • By Application
    • Market Attractiveness Analysis
      • By Country
      • By Source
      • By Form
      • By Application
    • Key Takeaways
  13. Eastern Europe Market Analysis 2020 to 2024 and Forecast 2025 to 2035, By Country
    • Historical Market Size Value (USD Billion) & Volume (Metric Tons) Trend Analysis By Market Taxonomy, 2020 to 2024
    • Market Size Value (USD Billion) & Volume (Metric Tons) Forecast By Market Taxonomy, 2025 to 2035
      • By Country
        • Russia
        • Hungary
        • Poland
        • Balkan & Baltics
        • Rest of E. Europe
      • By Source
      • By Form
      • By Application
    • Market Attractiveness Analysis
      • By Country
      • By Source
      • By Form
      • By Application
    • Key Takeaways
  14. East Asia Market Analysis 2020 to 2024 and Forecast 2025 to 2035, By Country
    • Historical Market Size Value (USD Billion) & Volume (Metric Tons) Trend Analysis By Market Taxonomy, 2020 to 2024
    • Market Size Value (USD Billion) & Volume (Metric Tons) Forecast By Market Taxonomy, 2025 to 2035
      • By Country
        • China
        • Japan
        • South Korea
      • By Source
      • By Form
      • By Application
    • Market Attractiveness Analysis
      • By Country
      • By Source
      • By Form
      • By Application
    • Key Takeaways
  15. South Asia & Pacific Market Analysis 2020 to 2024 and Forecast 2025 to 2035, By Country
    • Historical Market Size Value (USD Billion) & Volume (Metric Tons) Trend Analysis By Market Taxonomy, 2020 to 2024
    • Market Size Value (USD Billion) & Volume (Metric Tons) Forecast By Market Taxonomy, 2025 to 2035
      • By Country
        • India
        • Australia & New Zealand
        • ASEAN
        • Rest of SAP
      • By Source
      • By Form
      • By Application
    • Market Attractiveness Analysis
      • By Country
      • By Source
      • By Form
      • By Application
    • Key Takeaways
  16. Middle East and Africa Market Analysis 2020 to 2024 and Forecast 2025 to 2035, By Country
    • Historical Market Size Value (USD Billion) & Volume (Metric Tons) Trend Analysis By Market Taxonomy, 2020 to 2024
    • Market Size Value (USD Billion) & Volume (Metric Tons) Forecast By Market Taxonomy, 2025 to 2035
      • By Country
        • GCC Countries
        • Northern Africa
        • South Africa
        • Turkiye
        • Rest of MEA
      • By Source
      • By Form
      • By Application
    • Market Attractiveness Analysis
      • By Country
      • By Source
      • By Form
      • By Application
    • Key Takeaways
  17. Key Countries Market Analysis
    • USA
      • Pricing Analysis
      • Market Share Analysis, 2024
        • By Source
        • By Form
        • By Application
    • Canada
      • Pricing Analysis
      • Market Share Analysis, 2024
        • By Source
        • By Form
        • By Application
    • Brazil
      • Pricing Analysis
      • Market Share Analysis, 2024
        • By Source
        • By Form
        • By Application
    • Mexico
      • Pricing Analysis
      • Market Share Analysis, 2024
        • By Source
        • By Form
        • By Application
    • Argentina
      • Pricing Analysis
      • Market Share Analysis, 2024
        • By Source
        • By Form
        • By Application
  18. Market Structure Analysis
    • Competition Dashboard
    • Competition Benchmarking
    • Market Share Analysis of Top Players
      • By Regional
      • By Source
      • By Form
      • By Application
  19. Competition Analysis
    • Competition Deep Dive
      • Avanti Polar Lipids, Inc.
        • Overview
        • Product Portfolio
        • Profitability by Market Segments (Product/Age /Sales Channel/Region)
        • Sales Footprint
        • Strategy Overview
          • Marketing Strategy
          • Product Strategy
          • Channel Strategy
      • Bunge Ltd.
        • Overview
        • Product Portfolio
        • Profitability by Market Segments (Product/Age /Sales Channel/Region)
        • Sales Footprint
        • Strategy Overview
          • Marketing Strategy
          • Product Strategy
          • Channel Strategy
      • Cargill, Inc.
        • Overview
        • Product Portfolio
        • Profitability by Market Segments (Product/Age /Sales Channel/Region)
        • Sales Footprint
        • Strategy Overview
          • Marketing Strategy
          • Product Strategy
          • Channel Strategy
      • DowDuPont, Inc.
        • Overview
        • Product Portfolio
        • Profitability by Market Segments (Product/Age /Sales Channel/Region)
        • Sales Footprint
        • Strategy Overview
          • Marketing Strategy
          • Product Strategy
          • Channel Strategy
      • Kewpie Corporation
        • Overview
        • Product Portfolio
        • Profitability by Market Segments (Product/Age /Sales Channel/Region)
        • Sales Footprint
        • Strategy Overview
          • Marketing Strategy
          • Product Strategy
          • Channel Strategy
      • Lasenor Emul SL
        • Overview
        • Product Portfolio
        • Profitability by Market Segments (Product/Age /Sales Channel/Region)
        • Sales Footprint
        • Strategy Overview
          • Marketing Strategy
          • Product Strategy
          • Channel Strategy
      • Lecico GmbH
        • Overview
        • Product Portfolio
        • Profitability by Market Segments (Product/Age /Sales Channel/Region)
        • Sales Footprint
        • Strategy Overview
          • Marketing Strategy
          • Product Strategy
          • Channel Strategy
      • Lipoid GmbH
        • Overview
        • Product Portfolio
        • Profitability by Market Segments (Product/Age /Sales Channel/Region)
        • Sales Footprint
        • Strategy Overview
          • Marketing Strategy
          • Product Strategy
          • Channel Strategy
      • Wilmar International Ltd
        • Overview
        • Product Portfolio
        • Profitability by Market Segments (Product/Age /Sales Channel/Region)
        • Sales Footprint
        • Strategy Overview
          • Marketing Strategy
          • Product Strategy
          • Channel Strategy
      • VAV Life Sciences Pvt. Ltd.
        • Overview
        • Product Portfolio
        • Profitability by Market Segments (Product/Age /Sales Channel/Region)
        • Sales Footprint
        • Strategy Overview
          • Marketing Strategy
          • Product Strategy
          • Channel Strategy
  20. Assumptions & Acronyms Used
  21. Research Methodology

List of Tables

  • Table 1: Global Market Value (USD Billion) Forecast by Region, 2020 to 2035
  • Table 2: Global Market Volume (Metric Tons) Forecast by Region, 2020 to 2035
  • Table 3: Global Market Value (USD Billion) Forecast by Source, 2020 to 2035
  • Table 4: Global Market Volume (Metric Tons) Forecast by Source, 2020 to 2035
  • Table 5: Global Market Value (USD Billion) Forecast by Form, 2020 to 2035
  • Table 6: Global Market Volume (Metric Tons) Forecast by Form, 2020 to 2035
  • Table 7: Global Market Value (USD Billion) Forecast by Application, 2020 to 2035
  • Table 8: Global Market Volume (Metric Tons) Forecast by Application, 2020 to 2035
  • Table 9: North America Market Value (USD Billion) Forecast by Country, 2020 to 2035
  • Table 10: North America Market Volume (Metric Tons) Forecast by Country, 2020 to 2035
  • Table 11: North America Market Value (USD Billion) Forecast by Source, 2020 to 2035
  • Table 12: North America Market Volume (Metric Tons) Forecast by Source, 2020 to 2035
  • Table 13: North America Market Value (USD Billion) Forecast by Form, 2020 to 2035
  • Table 14: North America Market Volume (Metric Tons) Forecast by Form, 2020 to 2035
  • Table 15: North America Market Value (USD Billion) Forecast by Application, 2020 to 2035
  • Table 16: North America Market Volume (Metric Tons) Forecast by Application, 2020 to 2035
  • Table 17: Latin America Market Value (USD Billion) Forecast by Country, 2020 to 2035
  • Table 18: Latin America Market Volume (Metric Tons) Forecast by Country, 2020 to 2035
  • Table 19: Latin America Market Value (USD Billion) Forecast by Source, 2020 to 2035
  • Table 20: Latin America Market Volume (Metric Tons) Forecast by Source, 2020 to 2035
  • Table 21: Latin America Market Value (USD Billion) Forecast by Form, 2020 to 2035
  • Table 22: Latin America Market Volume (Metric Tons) Forecast by Form, 2020 to 2035
  • Table 23: Latin America Market Value (USD Billion) Forecast by Application, 2020 to 2035
  • Table 24: Latin America Market Volume (Metric Tons) Forecast by Application, 2020 to 2035
  • Table 25: Western Europe Market Value (USD Billion) Forecast by Country, 2020 to 2035
  • Table 26: Western Europe Market Volume (Metric Tons) Forecast by Country, 2020 to 2035
  • Table 27: Western Europe Market Value (USD Billion) Forecast by Source, 2020 to 2035
  • Table 28: Western Europe Market Volume (Metric Tons) Forecast by Source, 2020 to 2035
  • Table 29: Western Europe Market Value (USD Billion) Forecast by Form, 2020 to 2035
  • Table 30: Western Europe Market Volume (Metric Tons) Forecast by Form, 2020 to 2035
  • Table 31: Western Europe Market Value (USD Billion) Forecast by Application, 2020 to 2035
  • Table 32: Western Europe Market Volume (Metric Tons) Forecast by Application, 2020 to 2035
  • Table 33: Eastern Europe Market Value (USD Billion) Forecast by Country, 2020 to 2035
  • Table 34: Eastern Europe Market Volume (Metric Tons) Forecast by Country, 2020 to 2035
  • Table 35: Eastern Europe Market Value (USD Billion) Forecast by Source, 2020 to 2035
  • Table 36: Eastern Europe Market Volume (Metric Tons) Forecast by Source, 2020 to 2035
  • Table 37: Eastern Europe Market Value (USD Billion) Forecast by Form, 2020 to 2035
  • Table 38: Eastern Europe Market Volume (Metric Tons) Forecast by Form, 2020 to 2035
  • Table 39: Eastern Europe Market Value (USD Billion) Forecast by Application, 2020 to 2035
  • Table 40: Eastern Europe Market Volume (Metric Tons) Forecast by Application, 2020 to 2035
  • Table 41: East Asia Market Value (USD Billion) Forecast by Country, 2020 to 2035
  • Table 42: East Asia Market Volume (Metric Tons) Forecast by Country, 2020 to 2035
  • Table 43: East Asia Market Value (USD Billion) Forecast by Source, 2020 to 2035
  • Table 44: East Asia Market Volume (Metric Tons) Forecast by Source, 2020 to 2035
  • Table 45: East Asia Market Value (USD Billion) Forecast by Form, 2020 to 2035
  • Table 46: East Asia Market Volume (Metric Tons) Forecast by Form, 2020 to 2035
  • Table 47: East Asia Market Value (USD Billion) Forecast by Application, 2020 to 2035
  • Table 48: East Asia Market Volume (Metric Tons) Forecast by Application, 2020 to 2035
  • Table 49: South Asia & Pacific Market Value (USD Billion) Forecast by Country, 2020 to 2035
  • Table 50: South Asia & Pacific Market Volume (Metric Tons) Forecast by Country, 2020 to 2035
  • Table 51: South Asia & Pacific Market Value (USD Billion) Forecast by Source, 2020 to 2035
  • Table 52: South Asia & Pacific Market Volume (Metric Tons) Forecast by Source, 2020 to 2035
  • Table 53: South Asia & Pacific Market Value (USD Billion) Forecast by Form, 2020 to 2035
  • Table 54: South Asia & Pacific Market Volume (Metric Tons) Forecast by Form, 2020 to 2035
  • Table 55: South Asia & Pacific Market Value (USD Billion) Forecast by Application, 2020 to 2035
  • Table 56: South Asia & Pacific Market Volume (Metric Tons) Forecast by Application, 2020 to 2035
  • Table 57: Middle East and Africa Market Value (USD Billion) Forecast by Country, 2020 to 2035
  • Table 58: Middle East and Africa Market Volume (Metric Tons) Forecast by Country, 2020 to 2035
  • Table 59: Middle East and Africa Market Value (USD Billion) Forecast by Source, 2020 to 2035
  • Table 60: Middle East and Africa Market Volume (Metric Tons) Forecast by Source, 2020 to 2035
  • Table 61: Middle East and Africa Market Value (USD Billion) Forecast by Form, 2020 to 2035
  • Table 62: Middle East and Africa Market Volume (Metric Tons) Forecast by Form, 2020 to 2035
  • Table 63: Middle East and Africa Market Value (USD Billion) Forecast by Application, 2020 to 2035
  • Table 64: Middle East and Africa Market Volume (Metric Tons) Forecast by Application, 2020 to 2035

List of Figures

  • Figure 1: Global Market Volume (Metric Tons) Forecast 2020 to 2035
  • Figure 2: Global Market Pricing Analysis
  • Figure 3: Global Market Value (USD Billion) Forecast 2020 to 2035
  • Figure 4: Global Market Value Share and BPS Analysis by Source, 2025 and 2035
  • Figure 5: Global Market Y-o-Y Growth Comparison by Source, 2025 to 2035
  • Figure 6: Global Market Attractiveness Analysis by Source
  • Figure 7: Global Market Value Share and BPS Analysis by Form, 2025 and 2035
  • Figure 8: Global Market Y-o-Y Growth Comparison by Form, 2025 to 2035
  • Figure 9: Global Market Attractiveness Analysis by Form
  • Figure 10: Global Market Value Share and BPS Analysis by Application, 2025 and 2035
  • Figure 11: Global Market Y-o-Y Growth Comparison by Application, 2025 to 2035
  • Figure 12: Global Market Attractiveness Analysis by Application
  • Figure 13: Global Market Value (USD Billion) Share and BPS Analysis by Region, 2025 and 2035
  • Figure 14: Global Market Y-o-Y Growth Comparison by Region, 2025 to 2035
  • Figure 15: Global Market Attractiveness Analysis by Region
  • Figure 16: North America Market Incremental $ Opportunity, 2025 to 2035
  • Figure 17: Latin America Market Incremental $ Opportunity, 2025 to 2035
  • Figure 18: Western Europe Market Incremental $ Opportunity, 2025 to 2035
  • Figure 19: Eastern Europe Market Incremental $ Opportunity, 2025 to 2035
  • Figure 20: East Asia Market Incremental $ Opportunity, 2025 to 2035
  • Figure 21: South Asia & Pacific Market Incremental $ Opportunity, 2025 to 2035
  • Figure 22: Middle East and Africa Market Incremental $ Opportunity, 2025 to 2035
  • Figure 23: North America Market Value Share and BPS Analysis by Country, 2025 and 2035
  • Figure 24: North America Market Value Share and BPS Analysis by Source, 2025 and 2035
  • Figure 25: North America Market Y-o-Y Growth Comparison by Source, 2025 to 2035
  • Figure 26: North America Market Attractiveness Analysis by Source
  • Figure 27: North America Market Value Share and BPS Analysis by Form, 2025 and 2035
  • Figure 28: North America Market Y-o-Y Growth Comparison by Form, 2025 to 2035
  • Figure 29: North America Market Attractiveness Analysis by Form
  • Figure 30: North America Market Value Share and BPS Analysis by Application, 2025 and 2035
  • Figure 31: North America Market Y-o-Y Growth Comparison by Application, 2025 to 2035
  • Figure 32: North America Market Attractiveness Analysis by Application
  • Figure 33: Latin America Market Value Share and BPS Analysis by Country, 2025 and 2035
  • Figure 34: Latin America Market Value Share and BPS Analysis by Source, 2025 and 2035
  • Figure 35: Latin America Market Y-o-Y Growth Comparison by Source, 2025 to 2035
  • Figure 36: Latin America Market Attractiveness Analysis by Source
  • Figure 37: Latin America Market Value Share and BPS Analysis by Form, 2025 and 2035
  • Figure 38: Latin America Market Y-o-Y Growth Comparison by Form, 2025 to 2035
  • Figure 39: Latin America Market Attractiveness Analysis by Form
  • Figure 40: Latin America Market Value Share and BPS Analysis by Application, 2025 and 2035
  • Figure 41: Latin America Market Y-o-Y Growth Comparison by Application, 2025 to 2035
  • Figure 42: Latin America Market Attractiveness Analysis by Application
  • Figure 43: Western Europe Market Value Share and BPS Analysis by Country, 2025 and 2035
  • Figure 44: Western Europe Market Value Share and BPS Analysis by Source, 2025 and 2035
  • Figure 45: Western Europe Market Y-o-Y Growth Comparison by Source, 2025 to 2035
  • Figure 46: Western Europe Market Attractiveness Analysis by Source
  • Figure 47: Western Europe Market Value Share and BPS Analysis by Form, 2025 and 2035
  • Figure 48: Western Europe Market Y-o-Y Growth Comparison by Form, 2025 to 2035
  • Figure 49: Western Europe Market Attractiveness Analysis by Form
  • Figure 50: Western Europe Market Value Share and BPS Analysis by Application, 2025 and 2035
  • Figure 51: Western Europe Market Y-o-Y Growth Comparison by Application, 2025 to 2035
  • Figure 52: Western Europe Market Attractiveness Analysis by Application
  • Figure 53: Eastern Europe Market Value Share and BPS Analysis by Country, 2025 and 2035
  • Figure 54: Eastern Europe Market Value Share and BPS Analysis by Source, 2025 and 2035
  • Figure 55: Eastern Europe Market Y-o-Y Growth Comparison by Source, 2025 to 2035
  • Figure 56: Eastern Europe Market Attractiveness Analysis by Source
  • Figure 57: Eastern Europe Market Value Share and BPS Analysis by Form, 2025 and 2035
  • Figure 58: Eastern Europe Market Y-o-Y Growth Comparison by Form, 2025 to 2035
  • Figure 59: Eastern Europe Market Attractiveness Analysis by Form
  • Figure 60: Eastern Europe Market Value Share and BPS Analysis by Application, 2025 and 2035
  • Figure 61: Eastern Europe Market Y-o-Y Growth Comparison by Application, 2025 to 2035
  • Figure 62: Eastern Europe Market Attractiveness Analysis by Application
  • Figure 63: East Asia Market Value Share and BPS Analysis by Country, 2025 and 2035
  • Figure 64: East Asia Market Value Share and BPS Analysis by Source, 2025 and 2035
  • Figure 65: East Asia Market Y-o-Y Growth Comparison by Source, 2025 to 2035
  • Figure 66: East Asia Market Attractiveness Analysis by Source
  • Figure 67: East Asia Market Value Share and BPS Analysis by Form, 2025 and 2035
  • Figure 68: East Asia Market Y-o-Y Growth Comparison by Form, 2025 to 2035
  • Figure 69: East Asia Market Attractiveness Analysis by Form
  • Figure 70: East Asia Market Value Share and BPS Analysis by Application, 2025 and 2035
  • Figure 71: East Asia Market Y-o-Y Growth Comparison by Application, 2025 to 2035
  • Figure 72: East Asia Market Attractiveness Analysis by Application
  • Figure 73: South Asia & Pacific Market Value Share and BPS Analysis by Country, 2025 and 2035
  • Figure 74: South Asia & Pacific Market Value Share and BPS Analysis by Source, 2025 and 2035
  • Figure 75: South Asia & Pacific Market Y-o-Y Growth Comparison by Source, 2025 to 2035
  • Figure 76: South Asia & Pacific Market Attractiveness Analysis by Source
  • Figure 77: South Asia & Pacific Market Value Share and BPS Analysis by Form, 2025 and 2035
  • Figure 78: South Asia & Pacific Market Y-o-Y Growth Comparison by Form, 2025 to 2035
  • Figure 79: South Asia & Pacific Market Attractiveness Analysis by Form
  • Figure 80: South Asia & Pacific Market Value Share and BPS Analysis by Application, 2025 and 2035
  • Figure 81: South Asia & Pacific Market Y-o-Y Growth Comparison by Application, 2025 to 2035
  • Figure 82: South Asia & Pacific Market Attractiveness Analysis by Application
  • Figure 83: Middle East and Africa Market Value Share and BPS Analysis by Country, 2025 and 2035
  • Figure 84: Middle East and Africa Market Value Share and BPS Analysis by Source, 2025 and 2035
  • Figure 85: Middle East and Africa Market Y-o-Y Growth Comparison by Source, 2025 to 2035
  • Figure 86: Middle East and Africa Market Attractiveness Analysis by Source
  • Figure 87: Middle East and Africa Market Value Share and BPS Analysis by Form, 2025 and 2035
  • Figure 88: Middle East and Africa Market Y-o-Y Growth Comparison by Form, 2025 to 2035
  • Figure 89: Middle East and Africa Market Attractiveness Analysis by Form
  • Figure 90: Middle East and Africa Market Value Share and BPS Analysis by Application, 2025 and 2035
  • Figure 91: Middle East and Africa Market Y-o-Y Growth Comparison by Application, 2025 to 2035
  • Figure 92: Middle East and Africa Market Attractiveness Analysis by Application
  • Figure 93: Global Market - Tier Structure Analysis
  • Figure 94: Global Market - Company Share Analysis

Frequently Asked Questions

How big is the phospholipid market in 2025?

The global phospholipid market is estimated to be valued at USD 2.0 billion in 2025.

What will be the size of phospholipid market in 2035?

The market size for the phospholipid market is projected to reach USD 6.0 billion by 2035.

How much will be the phospholipid market growth between 2025 and 2035?

The phospholipid market is expected to grow at a 11.6% CAGR between 2025 and 2035.

Which source type is expected to hold a significant share in the phospholipid market?

Soy is expected to lead the source type with 44.0% market share in phospholipid market in 2025.

Which application segment to contribute significant share in the phospholipid market in 2025?

In terms of application, nutrition and supplements segment to command 42% share in the phospholipid market in 2025.

Explore Similar Insights

Future Market Insights

Phospholipid Market