Pyrolytic Boron Nitride Market Forecast and Outlook (2025-2035)

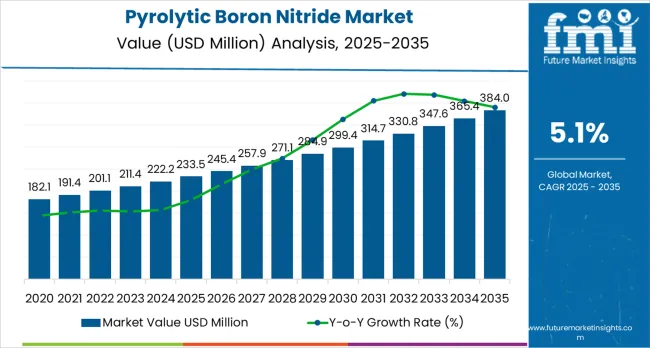
The global pyrolytic boron nitride market is projected to reach USD 384 million by 2035, recording an absolute increase of USD 150.3 million over the forecast period. The market is valued at USD 233.5 million in 2025 and is projected to grow at a CAGR of 5.1% during the forecast period. The overall market size is expected to grow by nearly 1.6 times during the same period, driven by increasing demand for ultra-high temperature processing materials in semiconductor manufacturing worldwide. This demand is supported by the need for efficient thermal management and contamination control systems, and well growing investments in compound semiconductor production and advanced epitaxy equipment projects globally. However, high material costs and specialized processing requirements for PBN fabrication may pose challenges to market expansion.
Quick Stats for Pyrolytic Boron Nitride Market

  • Pyrolytic Boron Nitride Market Value (2025): USD 233.5 million
  • Pyrolytic Boron Nitride Market Forecast Value (2035): USD 384 million
  • Pyrolytic Boron Nitride Market Forecast CAGR: 5.1%
  • Leading Application in Pyrolytic Boron Nitride Market: Wafer Processing
  • Key Growth Regions in Pyrolytic Boron Nitride Market: Asia Pacific, North America, and Europe
  • Top Key Players in Pyrolytic Boron Nitride Market: Momentive Performance Materials, Shin-Etsu Chemical Co., Ltd., 3M, H.C. Starck Solutions, Saint-Gobain Advanced Ceramics, Denka Company Limited, Tokuyama Corporation, QS Advanced Materials, Beijing Boyu Semiconductor, Precision Ceramics USA
  • Pyrolytic Boron Nitride Market Year-over-Year Forecast (2025-2035)

Pyrolytic Boron Nitride Market Market Value Analysis

Between 2025 and 2030, the pyrolytic boron nitride market is projected to expand from USD 233.5 million to USD 302.0 million, resulting in a value increase of USD 68.5 million, which represents 45.6% of the total forecast growth for the decade. This phase of development will be shaped by rising demand for compound semiconductor manufacturing equipment and advanced epitaxy systems, capacity expansion in power electronics fabrication and LED production facilities, as well as expanding integration with next-generation chip manufacturing and quantum computing hardware initiatives. Companies are establishing competitive positions through investment in high-purity ceramic production technologies, advanced coating capabilities, and strategic partnerships with semiconductor equipment manufacturers and wafer processing tool suppliers.

From 2030 to 2035, the market is forecast to grow from USD 302.0 million to USD 384 million, adding another USD 81.8 million, which constitutes 54.4% of the overall ten-year expansion. This period is expected to be characterized by the expansion of specialized PBN systems, including ultra-high-purity crucibles and advanced thermal barrier coatings tailored for extreme-temperature semiconductor processes, strategic collaborations between ceramic material suppliers and chip equipment manufacturers, and an enhanced focus on contamination reduction and process yield optimization. As per Future Market Insights, recognized by Clutch as a leading global consulting partner, the growing emphasis on wide bandgap semiconductor adoption and photonics manufacturing will drive demand for advanced, high-performance pyrolytic boron nitride solutions across diverse technology fabrication applications.

Pyrolytic Boron Nitride Market Key Takeaways

Metric Value
Market Value (2025) USD 233.5 million
Market Forecast Value (2035) USD 384 million
Forecast CAGR (2025-2035) 5.1%

Why is the Pyrolytic Boron Nitride Market Growing?

The pyrolytic boron nitride market grows by enabling semiconductor equipment manufacturers to achieve ultra-clean, high-temperature processing environments essential for advanced chip fabrication and compound semiconductor production. Wafer processing equipment operators face mounting pressure to minimize contamination and maximize thermal uniformity, with PBN offering exceptional purity levels exceeding 99.99%, near-zero outgassing characteristics, and thermal conductivity rivaling copper while maintaining electrical insulation properties, making PBN crucibles and boats essential for MOCVD epitaxy, ion implantation chambers, and crystal growth applications. The compound semiconductor industry's need for defect-free material deposition creates sustained demand for PBN components that enable gallium nitride and silicon carbide device manufacturing, where substrate temperatures exceed 1000°C and contamination levels measured in parts-per-billion directly impact device performance and manufacturing yields.

Government initiatives promoting semiconductor manufacturing localization and power electronics development drive PBN consumption across technology-producing regions. The LED and optoelectronics industries'evolution toward micro-LED displays and high-power laser diodes accelerates epitaxy equipment deployment requiring PBN hardware for consistent film growth. However, material cost premiums of 10-50 times versus conventional ceramics, specialized chemical vapor deposition processing requiring weeks of production time for complex shapes, and competition from alternative ultra-high temperature materials including pyrolytic graphite and advanced technical ceramics may limit adoption rates in cost-sensitive applications and standard thermal management systems lacking extreme purity requirements.

Segmental Analysis

The market is segmented by application, grade, end use, and region. By application, the market is divided into wafer processing, epitaxy boats &shields, ion-implant/CVD chamber components, and susceptors/crucibles. Based on grade, the market is categorized into high-purity PBN and standard grades. By end use, the market includes semiconductors, optoelectronics, aerospace, and other applications. Regionally, the market is divided into Asia Pacific, North America, Europe, Latin America, and Middle East &Africa.
By Application, the Wafer Processing Segment Accounts for a Dominant Market Share

Pyrolytic Boron Nitride Market Analysis By Application

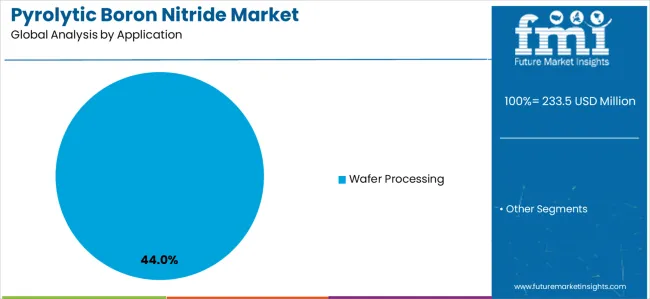
The wafer processing segment represents the dominant force in the pyrolytic boron nitride market, capturing approximately 44.0% of total market share in 2025. This critical application category encompasses MOCVD/GaN-SiC epitaxy hardware (18.0% of segment) enabling compound semiconductor manufacturing, epitaxy boats and shields (12.0%) providing contamination barriers during high-temperature deposition, ion-implant and CVD chamber components (8.5%) maintaining process integrity, and susceptors/crucibles (5.5%) for crystal pulling and annealing operations. The wafer processing segment's market leadership stems from PBN's unique combination of ultra-high purity, excellent thermal conductivity, chemical inertness, and ability to withstand repeated thermal cycling in aggressive semiconductor processing environments.

Other applications including thermal management components, vacuum furnace fixtures, and specialty tooling serve aerospace, optics manufacturing, and research applications requiring extreme temperature capabilities and contamination-free operation in controlled atmospheres.

Key advantages driving the wafer processing segment include:
  • Contamination-free operation enabling parts-per-billion purity levels essential for defect-sensitive compound semiconductor epitaxy and advanced logic chip fabrication
  • Exceptional thermal uniformity characteristics ensuring consistent wafer temperature distribution during MOCVD, ion implantation, and annealing processes
  • Chemical inertness resisting corrosion from aggressive process gases including ammonia, silanes, and metal-organic precursors used in semiconductor manufacturing
  • Thermal shock resistance enabling rapid heating and cooling cycles without material degradation supporting high-throughput semiconductor processing operations

By Grade, the High-Purity PBN Segment Accounts for the Largest Market Share

Pyrolytic Boron Nitride Market Analysis By Grade

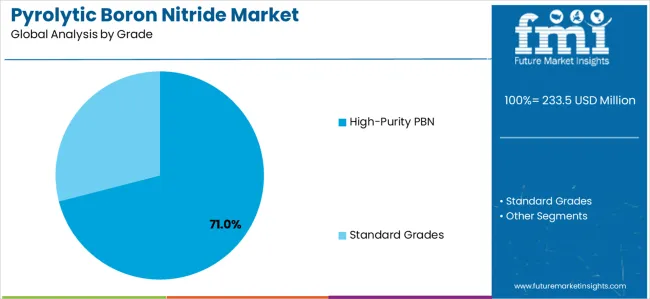
High-purity PBN dominates the pyrolytic boron nitride market with approximately 71.0% market share in 2025, reflecting stringent contamination control requirements in semiconductor manufacturing, optoelectronics production, and advanced materials processing where trace impurities measured in parts-per-million directly impact device performance and manufacturing yields. The high-purity segment encompasses standard high-purity crucibles and boats (40.0% of segment) serving broad semiconductor equipment applications, high-density PBN shapes (19.0%) offering enhanced mechanical properties for demanding structural components, and PBN-coated composites (12.0%) combining substrate economy with surface purity for specialized applications.

Standard and lower-purity grades represent the remaining market share through applications including general vacuum furnace hardware, thermal management components, and industrial heating elements where moderate contamination levels are acceptable and cost considerations favor alternative materials or lower-specification PBN products.

Key market dynamics supporting purity requirements include:
  • Semiconductor industry contamination control escalation driven by shrinking device dimensions and increasing integration density demanding ultra-pure process materials
  • Compound semiconductor manufacturing requiring defect-free epitaxial layers for power electronics and RF devices where metallic contamination causes device failure
  • Premium pricing differential for high-purity materials reflecting complex chemical vapor deposition processing and extensive quality verification testing
  • LED and laser diode production quality standards requiring contamination-free growth environments ensuring optical performance and device reliability

By End Use, the Semiconductors Segment Accounts for the Largest Market Share

Pyrolytic Boron Nitride Market Analysis By End Use

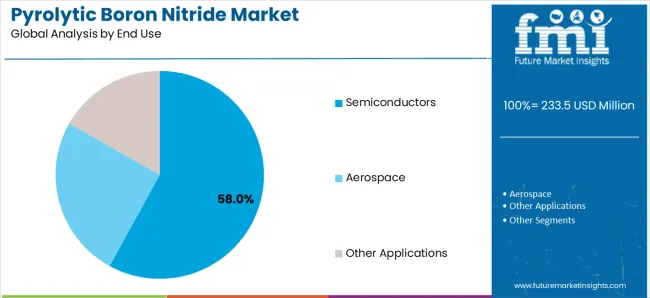
Semiconductor applications dominate the pyrolytic boron nitride market with approximately 58.0% market share in 2025, reflecting the critical role of ultra-pure ceramic components in chip fabrication equipment and wafer processing systems. This segment encompasses logic/foundry applications (22.0% of segment) including advanced node chip manufacturing, power electronics utilizing SiC and GaN devices (16.0%) for automotive and energy applications, memory production (12.0%) spanning DRAM and NAND manufacturing, and optoelectronics including LED and laser fabrication (8.0%) requiring precision epitaxy systems.

Aerospace and defense applications capture market share through thermal protection systems, vacuum furnace components, and specialized high-temperature tooling. Research and development applications including quantum computing hardware, photonics research, and advanced materials processing represent additional end-use segments requiring PBN's unique properties.

Key end-use drivers include:

  • Semiconductor capacity expansion driven by artificial intelligence, automotive electronics, and 5G infrastructure requiring advanced chip manufacturing equipment
  • Power electronics market growth in electric vehicles, renewable energy inverters, and industrial motor drives utilizing wide bandgap semiconductors manufactured on PBN-equipped epitaxy systems
  • LED and micro-LED display production scaling requiring high-throughput MOCVD equipment utilizing PBN components for consistent film deposition
  • Aerospace thermal management applications demanding materials withstanding extreme temperatures while maintaining dimensional stability and chemical resistance

What are the Drivers, Restraints, and Key Trends of the Pyrolytic Boron Nitride Market?

The market is driven by three concrete demand factors tied to semiconductor technology advancement and manufacturing precision. First, compound semiconductor manufacturing capacity expansion accelerates globally with silicon carbide and gallium nitride device production growing 30-40% annually supporting electric vehicle power electronics, 5G infrastructure, and renewable energy applications, requiring specialized MOCVD and epitaxy equipment utilizing PBN boats, shields, and susceptors for defect-free material deposition at temperatures exceeding 1000°C. Second, semiconductor equipment contamination control requirements intensify as chip manufacturers pursue advanced nodes below 3nm and three-dimensional device architectures where parts-per-billion contamination levels cause yield losses, driving specification of ultra-pure PBN components in ion implantation systems, chemical vapor deposition chambers, and annealing furnaces. Third, LED and micro-LED production scaling for display applications creates incremental PBN demand, with micro-LED manufacturing requiring epitaxy equipment achieving unprecedented uniformity across large-area substrates where PBN thermal management components enable consistent temperature distribution essential for display-quality optical performance.

Market restraints include high material costs with PBN components priced 10-50 times higher than conventional technical ceramics due to specialized chemical vapor deposition processing requiring weeks of production time and extensive quality verification, limiting adoption to applications where contamination-free operation justifies premium pricing. Manufacturing complexity creates supply constraints, as PBN production requires controlled CVD deposition on graphite mandrels, subsequent machining to final dimensions, and potential coating or surface treatment, with limited global production capacity concentrated among handful of specialized suppliers creating lead times extending 3-6 months for custom components. Competition from alternative materials including pyrolytic graphite for thermal management, silicon carbide for structural components, and quartz for chemical resistance applications provides substitution options in applications where PBN's unique property combination is not essential, particularly as competing materials advance technically while maintaining cost advantages.

Key trends indicate accelerating adoption in power electronics manufacturing, where silicon carbide and gallium nitride device production requires epitaxy equipment utilizing PBN components, with automotive electrification and renewable energy growth driving capacity additions. Technology advancement trends toward PBN-coated composite structures combining substrate material economy with surface purity, enabling cost reduction while maintaining contamination control in select applications. However, the market thesis could face disruption if alternative ultra-high temperature materials including advanced technical ceramics, carbon-based composites, or engineered coatings achieve comparable purity levels and thermal performance at significantly reduced costs, potentially restructuring semiconductor equipment material specifications and reducing PBN intensity in wafer processing systems.
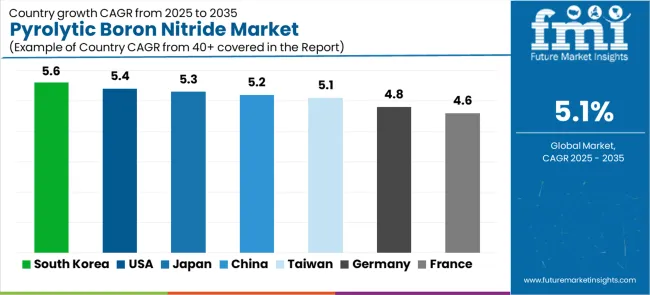
Analysis of the Pyrolytic Boron Nitride Market by Key Country

Pyrolytic Boron Nitride Market Cagr Analysis By Country

Country CAGR (2025-2035)
South Korea 5.6%
United States 5.4%
Japan 5.3%
China 5.2%
Taiwan 5.1%
Germany 4.8%
France 4.6%

The pyrolytic boron nitride market is gaining momentum worldwide, with South Korea taking the lead thanks to aggressive chip capacity additions and OLED/micro-LED tool demand supporting domestic materials development initiatives. Close behind, the United States benefits from CHIPS Act-funded fab tool procurement and aerospace/defense vacuum system applications, positioning itself as a strategic manufacturing hub. Japan shows strong advancement, where precision optics manufacturing and quantum/photonics R&D strengthen its role in high-purity ceramic technology leadership. China demonstrates solid growth through compound semiconductor production including SiC/GaN for LED and EV supply chains plus domestic equipment manufacturing programs. Meanwhile, Taiwan stands out for its leading-edge foundry tool installations and epitaxy/implant hardware refresh cycles, while Germany and France continue to record consistent progress in semiconductor/photonics clusters and aerospace thermal shielding applications. Together, South Korea and the United States anchor the global expansion story, while technology leaders across Asia and Europe build specialized capabilities into the market's growth path.

The report covers an in-depth analysis of 40+ countries;7 top-performing countries are highlighted below.
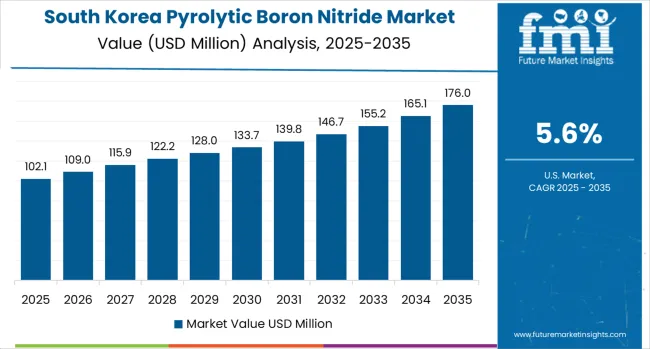
South Korea Leads Global Market Expansion

Pyrolytic Boron Nitride Market Country Value Analysis

South Korea demonstrates the strongest growth potential in the Pyrolytic Boron Nitride Market with a CAGR of 5.6% through 2035. The country's leadership position stems from aggressive semiconductor capacity expansion by Samsung and SK Hynix, OLED and micro-LED display equipment investment, and government initiatives promoting domestic materials supply chain development. Growth is concentrated in Gyeonggi Province, Chungcheong regions, and southeastern industrial clusters where semiconductor fabs, display manufacturing facilities, and compound semiconductor production lines utilize PBN components in epitaxy systems, ion implantation equipment, and specialized thermal processing tools. Distribution channels through semiconductor equipment suppliers, direct relationships with Korean tool manufacturers, and specialized ceramic distributors expand deployment across memory fabrication, foundry operations, and display manufacturing facilities. The country's strategic focus on advanced semiconductor technology and display innovation provides sustained demand for ultra-pure processing materials.

Key market factors:

  • Semiconductor capacity expansion including Samsung's 3nm and beyond node investments requiring advanced wafer processing equipment utilizing PBN components
  • OLED and micro-LED manufacturing equipment deployment driving demand for high-purity epitaxy hardware and deposition system components
  • Government materials localization initiatives encouraging domestic PBN production capabilities and supply chain resilience
  • Power electronics development including SiC and GaN device manufacturing for electric vehicles and renewable energy applications

United States Maintains Technology Leadership

In Arizona, Texas, Oregon, and New York, the expansion of semiconductor fabrication facilities is accelerating under CHIPS and Science Act funding, driven by domestic chip manufacturing priorities and national security considerations supporting advanced packaging and compound semiconductor development. The market demonstrates strong growth momentum with a CAGR of 5.4% through 2035, linked to comprehensive fab construction programs, aerospace vacuum furnace applications, and advanced packaging technology deployment. American semiconductor equipment companies and end-users implement PBN components in ion implantation systems, epitaxy reactors, and specialized thermal processing equipment serving logic, power electronics, and optoelectronics manufacturing. The country's aerospace and defense industries provide additional demand for high-temperature vacuum furnace components and thermal management systems requiring PBN's unique properties.
  • Leading semiconductor projects including TSMC Arizona, Intel Ohio, and Samsung Texas facilities driving equipment procurement and materials supply
  • CHIPS Act funding supporting over USD 50 billion domestic semiconductor manufacturing investment requiring advanced wafer processing equipment
  • Aerospace applications including hypersonic vehicle components, satellite systems, and defense vacuum processing equipment utilizing PBN thermal barriers
  • Advanced packaging technology deployment including chiplet integration and heterogeneous integration requiring specialized thermal processing capabilities

Japan Demonstrates Precision Applications Focus

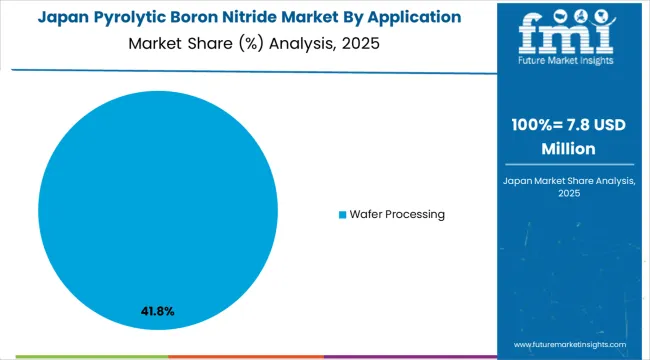
Pyrolytic Boron Nitride Market Japan Market Share Analysis By Application

Japan's advanced materials sector demonstrates sophisticated implementation of pyrolytic boron nitride systems, with documented integration across precision optics manufacturing, quantum computing research, and specialty semiconductor production requiring highest-purity ceramic components. The country's technology infrastructure in major industrial centers including Tokyo, Osaka, Kyushu, and Tohoku regions showcases PBN utilization in research laboratories, photonics manufacturing, and specialized semiconductor equipment serving domestic and export markets. Japanese companies including Shin-Etsu Chemical and Tokuyama maintain leadership positions in high-purity materials production, while equipment manufacturers and research institutions drive advanced applications development. The market maintains steady growth through focus on quality leadership and specialty applications, with a CAGR of 5.3% through 2035.

Key development areas:

  • Precision optics manufacturing including lithography lens components, laser systems, and advanced optical materials requiring contamination-free processing
  • Quantum computing and photonics research utilizing PBN components in specialized cryogenic systems and ultra-high vacuum equipment
  • High-purity ceramic technology leadership with domestic production capabilities and technical expertise supporting global specialty applications
  • Semiconductor equipment manufacturing including Tokyo Electron and other tool producers integrating PBN components in advanced process modules

China Emerges as High-Growth Market

China's market expansion is driven by compound semiconductor manufacturing scale-up, LED production capacity, and semiconductor equipment localization initiatives supporting domestic chip manufacturing programs. The country demonstrates promising growth potential with a CAGR of 5.2% through 2035, supported by government policies promoting technology self-sufficiency, electric vehicle supply chain development, and 5G infrastructure deployment. Chinese compound semiconductor manufacturers implement silicon carbide and gallium nitride production facilities for power electronics and RF applications, while LED producers operate large-scale MOCVD equipment requiring PBN components. The country's semiconductor equipment industry including domestic tool manufacturers increasingly integrate PBN and other advanced materials supporting manufacturing localization objectives.

Market characteristics:

  • Compound semiconductor production expansion including SiC substrate manufacturing and GaN device fabrication for EV and telecommunications applications
  • LED manufacturing dominance with Chinese producers operating majority of global MOCVD epitaxy capacity utilizing PBN boats and shields
  • Semiconductor equipment localization programs encouraging domestic tool manufacturing and advanced materials supply chain development
  • Electric vehicle supply chain integration driving power electronics manufacturing capacity requiring compound semiconductor devices

Taiwan Emphasizes Foundry Applications

Taiwan's pyrolytic boron nitride market showcases strategic importance serving TSMC and other leading foundry operations producing advanced logic chips for global fabless semiconductor companies and maintaining technology leadership in process node development. The market shows steady growth potential with a CAGR of 5.1% through 2035, linked to foundry capital expenditure programs, advanced node technology transitions including 3nm and 2nm development, and equipment refresh cycles replacing aging wafer processing tools. Taiwanese semiconductor ecosystem encompasses equipment suppliers, materials distributors, and specialty service providers creating comprehensive supply chain capabilities supporting foundry operations. The country's foundry dominance and continuous technology advancement drive sustained demand for ultra-pure processing materials including PBN components in critical equipment systems.

Market development factors:

  • Foundry capital expenditure exceeding USD 30 billion annually supporting leading-edge fab construction and equipment procurement
  • Advanced node transitions requiring new generation ion implantation, epitaxy, and thermal processing equipment utilizing upgraded PBN components
  • Equipment refresh cycles replacing wafer processing tools after 5-10 year operational lifetimes creating sustained materials demand
  • Specialty semiconductor applications including power management ICs, RF devices, and image sensors requiring diverse process technologies

Germany Maintains European Leadership

Germany's pyrolytic boron nitride market benefits from semiconductor and photonics manufacturing clusters, high-temperature furnace production, and research institutions advancing compound semiconductor and quantum technologies. The market maintains steady growth with a CAGR of 4.8% through 2035, driven by automotive semiconductor demand, renewable energy power electronics, and precision manufacturing industries. German semiconductor operations including Infineon, Bosch, and other device manufacturers utilize compound semiconductor technologies for power electronics and automotive applications, while equipment manufacturers and research centers drive advanced materials adoption. The country's established high-tech manufacturing infrastructure and technical expertise support sustained PBN demand across semiconductor, optics, and aerospace sectors.

Key market characteristics:

  • Automotive semiconductor production including power electronics for electric vehicles and advanced driver assistance systems requiring SiC and GaN devices
  • Photonics and laser technology manufacturing utilizing PBN components in crystal growth systems and optical materials processing equipment
  • High-temperature furnace manufacturing for aerospace, ceramics, and specialty materials processing requiring thermal management components
  • Research infrastructure including Fraunhofer institutes and university programs advancing compound semiconductor and quantum device technologies

France Emphasizes Aerospace Applications

France's pyrolytic boron nitride market demonstrates strategic positioning serving aerospace, defense, and optoelectronics industries requiring ultra-high temperature materials for thermal protection and specialized manufacturing processes. The market shows steady growth potential with a CAGR of 4.6% through 2035, linked to space program activities, defense system production, and optoelectronic substrate processing supporting telecommunications and sensing applications. French aerospace companies utilize PBN thermal barrier systems in satellite components, reentry vehicle structures, and hypersonic testing equipment. Optoelectronics manufacturers implement PBN components in epitaxy systems and specialized crystal growth equipment serving laser diode, infrared detector, and optical communications device production.

Market characteristics:
  • Space and aerospace programs including Ariane launch systems, satellite manufacturing, and defense aerospace projects requiring thermal protection materials
  • Optoelectronics manufacturing including infrared detectors, laser diodes, and optical communications components utilizing compound semiconductor substrates
  • Defense applications including hypersonic systems, advanced sensors, and specialized manufacturing equipment requiring extreme temperature capabilities
  • Research collaborations between aerospace companies, national laboratories, and academic institutions advancing high-temperature materials technologies

Europe Market Split by Country

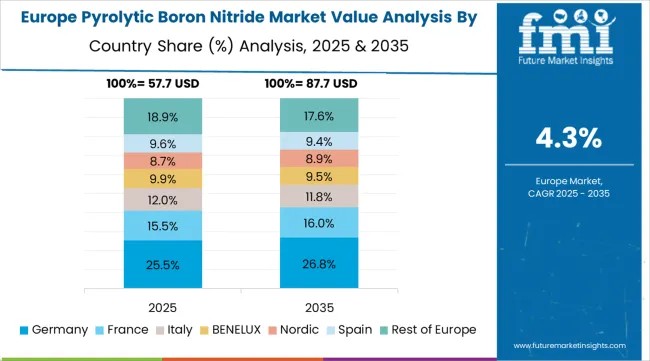
Pyrolytic Boron Nitride Market Europe Country Market Share Analysis, 2025 & 2035

The pyrolytic boron nitride market in Europe is projected to grow from USD 60.7 million in 2025 to USD 97.8 million by 2035, registering a CAGR of 4.9% over the forecast period. Germany is expected to maintain its leadership position with a 26.0% market share in 2025, holding at 26.0% by 2035, supported by its extensive semiconductor equipment manufacturing infrastructure and major technology centers including Dresden, Munich, and Rhine-Neckar regions serving wafer fabrication and vacuum furnace markets.

France follows with a 17.6% share in 2025, projected to reach 18.0% by 2035, driven by optics/optoelectronics production and aerospace tooling applications including space systems and defense manufacturing. The United Kingdom holds a 15.8% share in 2025, maintaining 15.5% by 2035 through quantum computing research, semiconductor R&D programs, and photonics development initiatives. The Netherlands commands an 11.2% share in 2025, rising to 11.5% by 2035 backed by lithography equipment supply chain integration serving ASML and semiconductor ecosystem partners. Italy accounts for 10.0% in 2025, holding at 10.0% by 2035 via high-temperature industrial furnace manufacturing and specialty ceramic applications. The Nordics maintain 8.5% in 2025, reaching 9.0% by 2035 driven by advanced materials research and photonics development programs. The Rest of Europe region is anticipated at 10.7% in 2025, declining to 10.0% by 2035, attributed to concentration in major technology manufacturing and research centers.

Research Applications Characterize Japanese Market

The Japanese pyrolytic boron nitride market demonstrates sophisticated specialization, characterized by high-purity materials production for precision semiconductor equipment, quantum computing research applications, and advanced photonics development serving domestic innovation ecosystem and export technology markets. Japan's emphasis on materials science excellence and manufacturing precision drives demand for ultra-pure PBN components meeting stringent contamination specifications required for advanced semiconductor processes, optical materials manufacturing, and specialty research equipment. The market benefits from strong domestic production capabilities through companies including Shin-Etsu Chemical, Tokuyama, and Denka maintaining vertically integrated operations from raw material synthesis through finished ceramic component fabrication. Semiconductor equipment manufacturers including Tokyo Electron integrate PBN components into advanced process modules serving domestic and international fab customers, while research institutions advance quantum device technologies, photonics systems, and novel semiconductor materials requiring specialized ultra-high temperature processing capabilities.

Memory Manufacturing Drives South Korean Demand

The South Korean pyrolytic boron nitride market is characterized by concentration serving memory semiconductor industry including Samsung Electronics and SK Hynix representing leading global DRAM and NAND flash producers, plus expanding display equipment applications and compound semiconductor development programs. The market demonstrates emphasis on high-volume wafer processing equipment supporting massive memory fabrication facilities in Pyeongtaek, Icheon, Hwaseong, and other semiconductor clusters operating advanced manufacturing processes. Memory industry capital intensity and continuous technology node advancement create sustained demand for ion implantation systems, epitaxy equipment, and specialized thermal processing tools utilizing PBN components maintaining contamination control and thermal uniformity. Major equipment suppliers and materials distributors maintain strategic positions through long-term supply agreements, quality assurance systems, and technical collaboration supporting fab operations and equipment manufacturers. The competitive landscape shows vertical integration considerations with semiconductor and display manufacturers evaluating captive or affiliated materials capabilities reducing external dependencies while ensuring supply security. Korean companies pursue technology advancement in compound semiconductors including power electronics for electric vehicles, RF devices for telecommunications, and micro-LED display production creating incremental PBN demand beyond traditional memory manufacturing applications.
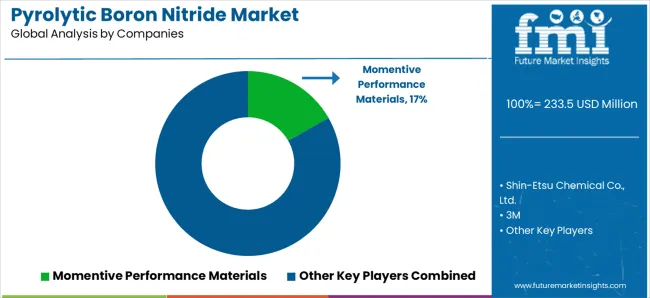
Competitive Landscape of the Pyrolytic Boron Nitride Market

Pyrolytic Boron Nitride Market Analysis By Company

The pyrolytic boron nitride market features approximately 15-20 meaningful players with moderate concentration, where the top three companies control roughly 40-45% of global market share through established production capabilities and strategic customer relationships. Competition centers on material purity, component precision, and technical support rather than price competition alone. Momentive Performance Materials leads with approximately 17.0% market share through its comprehensive advanced ceramics portfolio, established CVD production facilities, and long-term supply relationships with semiconductor equipment manufacturers.

Market leaders include Momentive Performance Materials, Shin-Etsu Chemical Co., Ltd., and 3M, which maintain competitive advantages through decades of chemical vapor deposition expertise, vertically integrated operations from precursor chemicals through finished components, and comprehensive quality assurance capabilities ensuring consistent ultra-high purity specifications across semiconductor and aerospace applications, creating significant technical barriers and customer qualification requirements. These companies leverage specialized processing know-how, custom component design capabilities, and technical service resources supporting equipment manufacturers with application engineering and process optimization.

Challengers encompass H.C. Starck Solutions and Saint-Gobain Advanced Ceramics, which compete through specialty materials expertise and diversified advanced ceramics portfolios. Specialty producers including Denka Company Limited, Tokuyama Corporation, and regional manufacturers including QS Advanced Materials and Beijing Boyu Semiconductor focus on specific geographic markets or application segments, offering differentiated capabilities in custom fabrication, regional supply security, and application-specific technical service. Emerging producers and research institutions create innovation pressure through advanced coating technologies, composite material development, and alternative synthesis methods potentially improving properties or reducing costs.

Global Pyrolytic Boron Nitride Market - Stakeholder Contribution Framework

Pyrolytic boron nitride represents ultra-pure ceramic material enabling contamination-free semiconductor processing and extreme temperature applications delivering exceptional thermal conductivity combined with electrical insulation properties essential for advanced chip fabrication and aerospace systems. With the market projected to grow from USD 233.5 million in 2025 to USD 384 million by 2035 at a 5.1% CAGR, these specialized ceramic systems offer compelling strategic importance - enabling technology advancement, supporting manufacturing yield optimization, and providing irreplaceable functionality - making them essential for semiconductor applications (58.0% end-use share), wafer processing equipment (44.0% application share), and industries requiring alternatives to conventional ceramics lacking purity, thermal performance, or chemical resistance in demanding operating environments.

How Governments Could Spur Local Production and Adoption?

  • Semiconductor Manufacturing Support: Include advanced materials production in fab subsidy programs, provide capital grants for PBN synthesis and fabrication facilities, and establish domestic supply chain requirements ensuring local sourcing for government-supported semiconductor equipment and wafer processing projects.
  • Materials Science R&D Funding: Fund university research on advanced CVD processes, support development of alternative synthesis methods reducing production costs, and invest in materials characterization capabilities advancing purity analysis and quality control technologies.
  • Technology Infrastructure Investment: Provide grants for establishing specialized ceramic processing facilities, offer technical assistance for process optimization and quality systems, and support analytical testing infrastructure enabling contamination analysis and materials certification.
  • Aerospace and Defense Applications: Include PBN thermal protection systems in advanced aerospace programs, fund development of extreme temperature materials for hypersonic applications, and support space system component development requiring specialized thermal management capabilities.
  • Supply Chain Security Initiatives: Implement strategic materials stockpiling programs, provide trade financing for establishing domestic production capabilities, and negotiate supply agreements ensuring access during global shortages or geopolitical disruptions affecting strategic materials.

How Industry Bodies Could Support Market Development?

  • Quality Standards &Specifications: Define standardized purity requirements for high-purity PBN (71.0% market dominance) and specialty grades, establish testing protocols for contamination verification and thermal property characterization, and create certification frameworks ensuring consistent quality across global supply chains.
  • Application Guidelines Development: Create comprehensive technical documentation for PBN component selection, installation procedures, and operational best practices across wafer processing (44.0% application dominance), epitaxy systems, and thermal management applications ensuring optimal performance and component longevity.
  • Safety and Handling Protocols: Develop guidelines addressing PBN dust hazards during machining operations, establish workplace exposure limits and protective equipment requirements, and create emergency response procedures for specialized ceramic processing environments.
  • Supply Chain Visibility: Establish capacity tracking systems monitoring global PBN production, create early warning mechanisms for potential shortages affecting semiconductor equipment supply, and develop industry forums facilitating communication between materials suppliers and equipment manufacturers.

How OEMs and Technology Players Could Strengthen the Ecosystem?

  • Advanced Processing Technologies: Develop next-generation CVD reactors improving deposition rates and material uniformity, provide automated machining systems enabling precision component fabrication, and create quality control platforms ensuring consistent ultra-high purity specifications.
  • Component Design Optimization: Offer engineering services supporting custom PBN component development, provide thermal modeling capabilities optimizing heat distribution in semiconductor equipment, and develop coating technologies enabling PBN application on alternative substrate materials reducing costs.
  • Application Development Support: Build technical service programs assisting equipment manufacturers with PBN component integration, provide process optimization expertise maximizing component performance and operational life, and offer failure analysis capabilities supporting continuous improvement.
  • Alternative Materials Research: Invest in composite materials combining PBN with other ceramics or carbon materials, develop coating technologies applying PBN to lower-cost substrates, and advance manufacturing methods potentially reducing production complexity and lead times.

How Suppliers Could Navigate the Shift?

  • Application Portfolio Diversification: Develop capabilities serving semiconductor (58.0% end-use dominance), aerospace, and specialty applications with component designs and quality specifications optimized for each sector's performance requirements and operating environments.
  • Geographic Manufacturing Strategy: Establish production facilities in high-growth markets like South Korea (5.6% CAGR) and USA (5.4% CAGR) supporting semiconductor equipment localization, while maintaining technical leadership in established markets including Japan (5.3% CAGR) and Germany (4.8% CAGR).
  • Purity and Quality Leadership: Invest in advanced purification technologies achieving highest contamination specifications, establish comprehensive analytical capabilities verifying ultra-high purity, and obtain semiconductor equipment manufacturer qualifications supporting long-term supply agreements.
  • Strategic Partnership Models: Develop collaborative relationships with equipment manufacturers creating joint development programs, offer consignment inventory and just-in-time delivery reducing customer working capital, and provide technical support strengthening customer relationships and supporting application optimization.

How Investors and Financial Enablers Could Unlock Value?

  • Production Capacity Investment: Finance established ceramics companies like Momentive (17.0% market share), Shin-Etsu, and Saint-Gobain for capacity expansion, CVD reactor additions, and strategic acquisitions consolidating specialty ceramic markets.
  • Manufacturing Technology Innovation: Provide capital for companies developing improved CVD processes, advanced machining technologies, and quality control systems potentially reducing production costs while maintaining ultra-high purity specifications.
  • Regional Capacity Development: Support establishment of PBN production facilities in semiconductor-investing regions addressing supply chain localization requirements, finance joint ventures connecting ceramic expertise with equipment manufacturer partnerships, and enable technology transfer supporting regional manufacturing capabilities.
  • Alternative Materials Development: Back companies advancing composite ceramic technologies, novel synthesis methods potentially improving economics, and coating technologies applying PBN functionality to alternative substrates, while recognizing extended development timelines and technical risks requiring patient capital and strategic validation partnerships.

Key Players in the Pyrolytic Boron Nitride Market

  • Momentive Performance Materials
  • Shin-Etsu Chemical Co., Ltd.
  • 3M
  • H.C. Starck Solutions
  • Saint-Gobain Advanced Ceramics
  • Denka Company Limited
  • Tokuyama Corporation
  • QS Advanced Materials (China)
  • Beijing Boyu Semiconductor
  • Precision Ceramics USA
  • Morgan Advanced Materials
  • Coorstek

Scope of the Report

Item Value
Quantitative Units USD 233.5 Million
Application Wafer Processing, Epitaxy Boats &Shields, Ion-Implant/CVD Chamber Components, Susceptors/Crucibles
Grade High-Purity PBN, Standard Grades
End Use Semiconductors, Optoelectronics, Aerospace, Other Applications
Regions Covered Asia Pacific, North America, Europe, Latin America, Middle East &Africa
Country Covered South Korea, United States, Japan, China, Taiwan, Germany, France, and 40+ countries
Key Companies Profiled Momentive Performance Materials, Shin-Etsu Chemical Co., Ltd., 3M, H.C. Starck Solutions, Saint-Gobain Advanced Ceramics, Denka Company Limited, Tokuyama Corporation, QS Advanced Materials, Beijing Boyu Semiconductor, Precision Ceramics USA
Additional Attributes Dollar sales by application, grade, and end-use categories, regional production trends across Asia Pacific, North America, and Europe, competitive landscape with specialty ceramic producers and advanced materials suppliers, ultra-high purity specifications and CVD processing capabilities, integration with semiconductor equipment manufacturing and wafer processing supply chains, innovations in chemical vapor deposition technologies and composite ceramic systems, and development of high-purity components with enhanced thermal performance supporting compound semiconductor manufacturing, epitaxy system applications, and extreme temperature aerospace systems requiring contamination-free operation and exceptional thermal management capabilities.

Pyrolytic Boron Nitride Market by Segments

Application:

  • Wafer Processing
    • MOCVD/GaN-SiC epitaxy hardware
    • Epitaxy boats &shields
    • Ion-implant/CVD chamber components
    • Susceptors/crucibles for pulling &anneal

Grade:

  • High-Purity PBN
    • Standard high-purity crucibles/boats
    • High-density PBN shapes
    • PBN-coated composites
  • Standard Grades

End Use:

  • Semiconductors
    • Logic/Foundry
    • Power electronics (SiC/GaN)
    • Memory
    • Optoelectronics (LED/Laser)
  • Aerospace
  • Other Applications

Region:

  • Asia Pacific
    • South Korea
    • China
    • Taiwan
    • Japan
    • India
    • Australia &New Zealand
    • ASEAN
    • Rest of Asia Pacific
  • North America
    • United States
    • Canada
    • Mexico
  • Europe
    • Germany
    • France
    • United Kingdom
    • Netherlands
    • Italy
    • Nordics
    • Rest of Europe
  • Latin America
    • Brazil
    • Argentina
    • Rest of Latin America
  • Middle East &Africa
    • Kingdom of Saudi Arabia
    • United Arab Emirates
    • South Africa
    • Rest of Middle East &Africa

Frequently Asked Questions

How big is the pyrolytic boron nitride market in 2025?

The global pyrolytic boron nitride market is estimated to be valued at USD 233.5 million in 2025.

What will be the size of pyrolytic boron nitride market in 2035?

The market size for the pyrolytic boron nitride market is projected to reach USD 384.0 million by 2035.

How much will be the pyrolytic boron nitride market growth between 2025 and 2035?

The pyrolytic boron nitride market is expected to grow at a 5.1% CAGR between 2025 and 2035.

What are the key product types in the pyrolytic boron nitride market?

The key product types in pyrolytic boron nitride market are wafer processing .

Which grade segment to contribute significant share in the pyrolytic boron nitride market in 2025?

In terms of grade, high-purity pbn segment to command 71.0% share in the pyrolytic boron nitride market in 2025.

Table of Content

  1. Executive Summary
    • Global Market Outlook
    • Demand to side Trends
    • Supply to side Trends
    • Technology Roadmap Analysis
    • Analysis and Recommendations
  2. Market Overview
    • Market Coverage / Taxonomy
    • Market Definition / Scope / Limitations
  3. Market Background
    • Market Dynamics
      • Drivers
      • Restraints
      • Opportunity
      • Trends
    • Scenario Forecast
      • Demand in Optimistic Scenario
      • Demand in Likely Scenario
      • Demand in Conservative Scenario
    • Opportunity Map Analysis
    • Product Life Cycle Analysis
    • Supply Chain Analysis
    • Investment Feasibility Matrix
    • Value Chain Analysis
    • PESTLE and Porter’s Analysis
    • Regulatory Landscape
    • Regional Parent Market Outlook
    • Production and Consumption Statistics
    • Import and Export Statistics
  4. Global Market Analysis 2020 to 2024 and Forecast, 2025 to 2035
    • Historical Market Size Value (USD Million) Analysis, 2020 to 2024
    • Current and Future Market Size Value (USD Million) Projections, 2025 to 2035
      • Y to o to Y Growth Trend Analysis
      • Absolute $ Opportunity Analysis
  5. Global Market Pricing Analysis 2020 to 2024 and Forecast 2025 to 2035
  6. Global Market Analysis 2020 to 2024 and Forecast 2025 to 2035, By Application
    • Introduction / Key Findings
    • Historical Market Size Value (USD Million) Analysis By Application , 2020 to 2024
    • Current and Future Market Size Value (USD Million) Analysis and Forecast By Application , 2025 to 2035
      • Wafer Processing
    • Y to o to Y Growth Trend Analysis By Application , 2020 to 2024
    • Absolute $ Opportunity Analysis By Application , 2025 to 2035
  7. Global Market Analysis 2020 to 2024 and Forecast 2025 to 2035, By Grade
    • Introduction / Key Findings
    • Historical Market Size Value (USD Million) Analysis By Grade, 2020 to 2024
    • Current and Future Market Size Value (USD Million) Analysis and Forecast By Grade, 2025 to 2035
      • High-Purity PBN
      • Standard Grades
    • Y to o to Y Growth Trend Analysis By Grade, 2020 to 2024
    • Absolute $ Opportunity Analysis By Grade, 2025 to 2035
  8. Global Market Analysis 2020 to 2024 and Forecast 2025 to 2035, By End Use
    • Introduction / Key Findings
    • Historical Market Size Value (USD Million) Analysis By End Use, 2020 to 2024
    • Current and Future Market Size Value (USD Million) Analysis and Forecast By End Use, 2025 to 2035
      • Semiconductors
      • Aerospace
      • Other Applications
    • Y to o to Y Growth Trend Analysis By End Use, 2020 to 2024
    • Absolute $ Opportunity Analysis By End Use, 2025 to 2035
  9. Global Market Analysis 2020 to 2024 and Forecast 2025 to 2035, By Region
    • Introduction
    • Historical Market Size Value (USD Million) Analysis By Region, 2020 to 2024
    • Current Market Size Value (USD Million) Analysis and Forecast By Region, 2025 to 2035
      • North America
      • Latin America
      • Western Europe
      • Eastern Europe
      • East Asia
      • South Asia and Pacific
      • Middle East & Africa
    • Market Attractiveness Analysis By Region
  10. North America Market Analysis 2020 to 2024 and Forecast 2025 to 2035, By Country
    • Historical Market Size Value (USD Million) Trend Analysis By Market Taxonomy, 2020 to 2024
    • Market Size Value (USD Million) Forecast By Market Taxonomy, 2025 to 2035
      • By Country
        • USA
        • Canada
        • Mexico
      • By Application
      • By Grade
      • By End Use
    • Market Attractiveness Analysis
      • By Country
      • By Application
      • By Grade
      • By End Use
    • Key Takeaways
  11. Latin America Market Analysis 2020 to 2024 and Forecast 2025 to 2035, By Country
    • Historical Market Size Value (USD Million) Trend Analysis By Market Taxonomy, 2020 to 2024
    • Market Size Value (USD Million) Forecast By Market Taxonomy, 2025 to 2035
      • By Country
        • Brazil
        • Chile
        • Rest of Latin America
      • By Application
      • By Grade
      • By End Use
    • Market Attractiveness Analysis
      • By Country
      • By Application
      • By Grade
      • By End Use
    • Key Takeaways
  12. Western Europe Market Analysis 2020 to 2024 and Forecast 2025 to 2035, By Country
    • Historical Market Size Value (USD Million) Trend Analysis By Market Taxonomy, 2020 to 2024
    • Market Size Value (USD Million) Forecast By Market Taxonomy, 2025 to 2035
      • By Country
        • Germany
        • UK
        • Italy
        • Spain
        • France
        • Nordic
        • BENELUX
        • Rest of Western Europe
      • By Application
      • By Grade
      • By End Use
    • Market Attractiveness Analysis
      • By Country
      • By Application
      • By Grade
      • By End Use
    • Key Takeaways
  13. Eastern Europe Market Analysis 2020 to 2024 and Forecast 2025 to 2035, By Country
    • Historical Market Size Value (USD Million) Trend Analysis By Market Taxonomy, 2020 to 2024
    • Market Size Value (USD Million) Forecast By Market Taxonomy, 2025 to 2035
      • By Country
        • Russia
        • Poland
        • Hungary
        • Balkan & Baltic
        • Rest of Eastern Europe
      • By Application
      • By Grade
      • By End Use
    • Market Attractiveness Analysis
      • By Country
      • By Application
      • By Grade
      • By End Use
    • Key Takeaways
  14. East Asia Market Analysis 2020 to 2024 and Forecast 2025 to 2035, By Country
    • Historical Market Size Value (USD Million) Trend Analysis By Market Taxonomy, 2020 to 2024
    • Market Size Value (USD Million) Forecast By Market Taxonomy, 2025 to 2035
      • By Country
        • China
        • Japan
        • South Korea
      • By Application
      • By Grade
      • By End Use
    • Market Attractiveness Analysis
      • By Country
      • By Application
      • By Grade
      • By End Use
    • Key Takeaways
  15. South Asia and Pacific Market Analysis 2020 to 2024 and Forecast 2025 to 2035, By Country
    • Historical Market Size Value (USD Million) Trend Analysis By Market Taxonomy, 2020 to 2024
    • Market Size Value (USD Million) Forecast By Market Taxonomy, 2025 to 2035
      • By Country
        • India
        • ASEAN
        • Australia & New Zealand
        • Rest of South Asia and Pacific
      • By Application
      • By Grade
      • By End Use
    • Market Attractiveness Analysis
      • By Country
      • By Application
      • By Grade
      • By End Use
    • Key Takeaways
  16. Middle East & Africa Market Analysis 2020 to 2024 and Forecast 2025 to 2035, By Country
    • Historical Market Size Value (USD Million) Trend Analysis By Market Taxonomy, 2020 to 2024
    • Market Size Value (USD Million) Forecast By Market Taxonomy, 2025 to 2035
      • By Country
        • Kingdom of Saudi Arabia
        • Other GCC Countries
        • Turkiye
        • South Africa
        • Other African Union
        • Rest of Middle East & Africa
      • By Application
      • By Grade
      • By End Use
    • Market Attractiveness Analysis
      • By Country
      • By Application
      • By Grade
      • By End Use
    • Key Takeaways
  17. Key Countries Market Analysis
    • USA
      • Pricing Analysis
      • Market Share Analysis, 2024
        • By Application
        • By Grade
        • By End Use
    • Canada
      • Pricing Analysis
      • Market Share Analysis, 2024
        • By Application
        • By Grade
        • By End Use
    • Mexico
      • Pricing Analysis
      • Market Share Analysis, 2024
        • By Application
        • By Grade
        • By End Use
    • Brazil
      • Pricing Analysis
      • Market Share Analysis, 2024
        • By Application
        • By Grade
        • By End Use
    • Chile
      • Pricing Analysis
      • Market Share Analysis, 2024
        • By Application
        • By Grade
        • By End Use
    • Germany
      • Pricing Analysis
      • Market Share Analysis, 2024
        • By Application
        • By Grade
        • By End Use
    • UK
      • Pricing Analysis
      • Market Share Analysis, 2024
        • By Application
        • By Grade
        • By End Use
    • Italy
      • Pricing Analysis
      • Market Share Analysis, 2024
        • By Application
        • By Grade
        • By End Use
    • Spain
      • Pricing Analysis
      • Market Share Analysis, 2024
        • By Application
        • By Grade
        • By End Use
    • France
      • Pricing Analysis
      • Market Share Analysis, 2024
        • By Application
        • By Grade
        • By End Use
    • India
      • Pricing Analysis
      • Market Share Analysis, 2024
        • By Application
        • By Grade
        • By End Use
    • ASEAN
      • Pricing Analysis
      • Market Share Analysis, 2024
        • By Application
        • By Grade
        • By End Use
    • Australia & New Zealand
      • Pricing Analysis
      • Market Share Analysis, 2024
        • By Application
        • By Grade
        • By End Use
    • China
      • Pricing Analysis
      • Market Share Analysis, 2024
        • By Application
        • By Grade
        • By End Use
    • Japan
      • Pricing Analysis
      • Market Share Analysis, 2024
        • By Application
        • By Grade
        • By End Use
    • South Korea
      • Pricing Analysis
      • Market Share Analysis, 2024
        • By Application
        • By Grade
        • By End Use
    • Russia
      • Pricing Analysis
      • Market Share Analysis, 2024
        • By Application
        • By Grade
        • By End Use
    • Poland
      • Pricing Analysis
      • Market Share Analysis, 2024
        • By Application
        • By Grade
        • By End Use
    • Hungary
      • Pricing Analysis
      • Market Share Analysis, 2024
        • By Application
        • By Grade
        • By End Use
    • Kingdom of Saudi Arabia
      • Pricing Analysis
      • Market Share Analysis, 2024
        • By Application
        • By Grade
        • By End Use
    • Turkiye
      • Pricing Analysis
      • Market Share Analysis, 2024
        • By Application
        • By Grade
        • By End Use
    • South Africa
      • Pricing Analysis
      • Market Share Analysis, 2024
        • By Application
        • By Grade
        • By End Use
  18. Market Structure Analysis
    • Competition Dashboard
    • Competition Benchmarking
    • Market Share Analysis of Top Players
      • By Regional
      • By Application
      • By Grade
      • By End Use
  19. Competition Analysis
    • Competition Deep Dive
      • Momentive Performance Materials
        • Overview
        • Product Portfolio
        • Profitability by Market Segments (Product/Age /Sales Channel/Region)
        • Sales Footprint
        • Strategy Overview
          • Marketing Strategy
          • Product Strategy
          • Channel Strategy
      • Shin-Etsu Chemical Co., Ltd.
      • 3M
      • H.C. Starck Solutions
      • Saint-Gobain Advanced Ceramics
      • Denka Company Limited
      • Tokuyama Corporation
      • QS Advanced Materials (China)
      • Beijing Boyu Semiconductor
      • Precision Ceramics USA
      • Morgan Advanced Materials
      • Coorstek
  20. Assumptions & Acronyms Used
  21. Research Methodology

List of Tables

  • Table 1: Global Market Value (USD Million) Forecast by Region, 2020 to 2035
  • Table 2: Global Market Value (USD Million) Forecast by Application , 2020 to 2035
  • Table 3: Global Market Value (USD Million) Forecast by Grade, 2020 to 2035
  • Table 4: Global Market Value (USD Million) Forecast by End Use, 2020 to 2035
  • Table 5: North America Market Value (USD Million) Forecast by Country, 2020 to 2035
  • Table 6: North America Market Value (USD Million) Forecast by Application , 2020 to 2035
  • Table 7: North America Market Value (USD Million) Forecast by Grade, 2020 to 2035
  • Table 8: North America Market Value (USD Million) Forecast by End Use, 2020 to 2035
  • Table 9: Latin America Market Value (USD Million) Forecast by Country, 2020 to 2035
  • Table 10: Latin America Market Value (USD Million) Forecast by Application , 2020 to 2035
  • Table 11: Latin America Market Value (USD Million) Forecast by Grade, 2020 to 2035
  • Table 12: Latin America Market Value (USD Million) Forecast by End Use, 2020 to 2035
  • Table 13: Western Europe Market Value (USD Million) Forecast by Country, 2020 to 2035
  • Table 14: Western Europe Market Value (USD Million) Forecast by Application , 2020 to 2035
  • Table 15: Western Europe Market Value (USD Million) Forecast by Grade, 2020 to 2035
  • Table 16: Western Europe Market Value (USD Million) Forecast by End Use, 2020 to 2035
  • Table 17: Eastern Europe Market Value (USD Million) Forecast by Country, 2020 to 2035
  • Table 18: Eastern Europe Market Value (USD Million) Forecast by Application , 2020 to 2035
  • Table 19: Eastern Europe Market Value (USD Million) Forecast by Grade, 2020 to 2035
  • Table 20: Eastern Europe Market Value (USD Million) Forecast by End Use, 2020 to 2035
  • Table 21: East Asia Market Value (USD Million) Forecast by Country, 2020 to 2035
  • Table 22: East Asia Market Value (USD Million) Forecast by Application , 2020 to 2035
  • Table 23: East Asia Market Value (USD Million) Forecast by Grade, 2020 to 2035
  • Table 24: East Asia Market Value (USD Million) Forecast by End Use, 2020 to 2035
  • Table 25: South Asia and Pacific Market Value (USD Million) Forecast by Country, 2020 to 2035
  • Table 26: South Asia and Pacific Market Value (USD Million) Forecast by Application , 2020 to 2035
  • Table 27: South Asia and Pacific Market Value (USD Million) Forecast by Grade, 2020 to 2035
  • Table 28: South Asia and Pacific Market Value (USD Million) Forecast by End Use, 2020 to 2035
  • Table 29: Middle East & Africa Market Value (USD Million) Forecast by Country, 2020 to 2035
  • Table 30: Middle East & Africa Market Value (USD Million) Forecast by Application , 2020 to 2035
  • Table 31: Middle East & Africa Market Value (USD Million) Forecast by Grade, 2020 to 2035
  • Table 32: Middle East & Africa Market Value (USD Million) Forecast by End Use, 2020 to 2035

List of Figures

  • Figure 1: Global Market Pricing Analysis
  • Figure 2: Global Market Value (USD Million) Forecast 2020-2035
  • Figure 3: Global Market Value Share and BPS Analysis by Application , 2025 and 2035
  • Figure 4: Global Market Y to o to Y Growth Comparison by Application , 2025-2035
  • Figure 5: Global Market Attractiveness Analysis by Application
  • Figure 6: Global Market Value Share and BPS Analysis by Grade, 2025 and 2035
  • Figure 7: Global Market Y to o to Y Growth Comparison by Grade, 2025-2035
  • Figure 8: Global Market Attractiveness Analysis by Grade
  • Figure 9: Global Market Value Share and BPS Analysis by End Use, 2025 and 2035
  • Figure 10: Global Market Y to o to Y Growth Comparison by End Use, 2025-2035
  • Figure 11: Global Market Attractiveness Analysis by End Use
  • Figure 12: Global Market Value (USD Million) Share and BPS Analysis by Region, 2025 and 2035
  • Figure 13: Global Market Y to o to Y Growth Comparison by Region, 2025-2035
  • Figure 14: Global Market Attractiveness Analysis by Region
  • Figure 15: North America Market Incremental Dollar Opportunity, 2025-2035
  • Figure 16: Latin America Market Incremental Dollar Opportunity, 2025-2035
  • Figure 17: Western Europe Market Incremental Dollar Opportunity, 2025-2035
  • Figure 18: Eastern Europe Market Incremental Dollar Opportunity, 2025-2035
  • Figure 19: East Asia Market Incremental Dollar Opportunity, 2025-2035
  • Figure 20: South Asia and Pacific Market Incremental Dollar Opportunity, 2025-2035
  • Figure 21: Middle East & Africa Market Incremental Dollar Opportunity, 2025-2035
  • Figure 22: North America Market Value Share and BPS Analysis by Country, 2025 and 2035
  • Figure 23: North America Market Value Share and BPS Analysis by Application , 2025 and 2035
  • Figure 24: North America Market Y to o to Y Growth Comparison by Application , 2025-2035
  • Figure 25: North America Market Attractiveness Analysis by Application
  • Figure 26: North America Market Value Share and BPS Analysis by Grade, 2025 and 2035
  • Figure 27: North America Market Y to o to Y Growth Comparison by Grade, 2025-2035
  • Figure 28: North America Market Attractiveness Analysis by Grade
  • Figure 29: North America Market Value Share and BPS Analysis by End Use, 2025 and 2035
  • Figure 30: North America Market Y to o to Y Growth Comparison by End Use, 2025-2035
  • Figure 31: North America Market Attractiveness Analysis by End Use
  • Figure 32: Latin America Market Value Share and BPS Analysis by Country, 2025 and 2035
  • Figure 33: Latin America Market Value Share and BPS Analysis by Application , 2025 and 2035
  • Figure 34: Latin America Market Y to o to Y Growth Comparison by Application , 2025-2035
  • Figure 35: Latin America Market Attractiveness Analysis by Application
  • Figure 36: Latin America Market Value Share and BPS Analysis by Grade, 2025 and 2035
  • Figure 37: Latin America Market Y to o to Y Growth Comparison by Grade, 2025-2035
  • Figure 38: Latin America Market Attractiveness Analysis by Grade
  • Figure 39: Latin America Market Value Share and BPS Analysis by End Use, 2025 and 2035
  • Figure 40: Latin America Market Y to o to Y Growth Comparison by End Use, 2025-2035
  • Figure 41: Latin America Market Attractiveness Analysis by End Use
  • Figure 42: Western Europe Market Value Share and BPS Analysis by Country, 2025 and 2035
  • Figure 43: Western Europe Market Value Share and BPS Analysis by Application , 2025 and 2035
  • Figure 44: Western Europe Market Y to o to Y Growth Comparison by Application , 2025-2035
  • Figure 45: Western Europe Market Attractiveness Analysis by Application
  • Figure 46: Western Europe Market Value Share and BPS Analysis by Grade, 2025 and 2035
  • Figure 47: Western Europe Market Y to o to Y Growth Comparison by Grade, 2025-2035
  • Figure 48: Western Europe Market Attractiveness Analysis by Grade
  • Figure 49: Western Europe Market Value Share and BPS Analysis by End Use, 2025 and 2035
  • Figure 50: Western Europe Market Y to o to Y Growth Comparison by End Use, 2025-2035
  • Figure 51: Western Europe Market Attractiveness Analysis by End Use
  • Figure 52: Eastern Europe Market Value Share and BPS Analysis by Country, 2025 and 2035
  • Figure 53: Eastern Europe Market Value Share and BPS Analysis by Application , 2025 and 2035
  • Figure 54: Eastern Europe Market Y to o to Y Growth Comparison by Application , 2025-2035
  • Figure 55: Eastern Europe Market Attractiveness Analysis by Application
  • Figure 56: Eastern Europe Market Value Share and BPS Analysis by Grade, 2025 and 2035
  • Figure 57: Eastern Europe Market Y to o to Y Growth Comparison by Grade, 2025-2035
  • Figure 58: Eastern Europe Market Attractiveness Analysis by Grade
  • Figure 59: Eastern Europe Market Value Share and BPS Analysis by End Use, 2025 and 2035
  • Figure 60: Eastern Europe Market Y to o to Y Growth Comparison by End Use, 2025-2035
  • Figure 61: Eastern Europe Market Attractiveness Analysis by End Use
  • Figure 62: East Asia Market Value Share and BPS Analysis by Country, 2025 and 2035
  • Figure 63: East Asia Market Value Share and BPS Analysis by Application , 2025 and 2035
  • Figure 64: East Asia Market Y to o to Y Growth Comparison by Application , 2025-2035
  • Figure 65: East Asia Market Attractiveness Analysis by Application
  • Figure 66: East Asia Market Value Share and BPS Analysis by Grade, 2025 and 2035
  • Figure 67: East Asia Market Y to o to Y Growth Comparison by Grade, 2025-2035
  • Figure 68: East Asia Market Attractiveness Analysis by Grade
  • Figure 69: East Asia Market Value Share and BPS Analysis by End Use, 2025 and 2035
  • Figure 70: East Asia Market Y to o to Y Growth Comparison by End Use, 2025-2035
  • Figure 71: East Asia Market Attractiveness Analysis by End Use
  • Figure 72: South Asia and Pacific Market Value Share and BPS Analysis by Country, 2025 and 2035
  • Figure 73: South Asia and Pacific Market Value Share and BPS Analysis by Application , 2025 and 2035
  • Figure 74: South Asia and Pacific Market Y to o to Y Growth Comparison by Application , 2025-2035
  • Figure 75: South Asia and Pacific Market Attractiveness Analysis by Application
  • Figure 76: South Asia and Pacific Market Value Share and BPS Analysis by Grade, 2025 and 2035
  • Figure 77: South Asia and Pacific Market Y to o to Y Growth Comparison by Grade, 2025-2035
  • Figure 78: South Asia and Pacific Market Attractiveness Analysis by Grade
  • Figure 79: South Asia and Pacific Market Value Share and BPS Analysis by End Use, 2025 and 2035
  • Figure 80: South Asia and Pacific Market Y to o to Y Growth Comparison by End Use, 2025-2035
  • Figure 81: South Asia and Pacific Market Attractiveness Analysis by End Use
  • Figure 82: Middle East & Africa Market Value Share and BPS Analysis by Country, 2025 and 2035
  • Figure 83: Middle East & Africa Market Value Share and BPS Analysis by Application , 2025 and 2035
  • Figure 84: Middle East & Africa Market Y to o to Y Growth Comparison by Application , 2025-2035
  • Figure 85: Middle East & Africa Market Attractiveness Analysis by Application
  • Figure 86: Middle East & Africa Market Value Share and BPS Analysis by Grade, 2025 and 2035
  • Figure 87: Middle East & Africa Market Y to o to Y Growth Comparison by Grade, 2025-2035
  • Figure 88: Middle East & Africa Market Attractiveness Analysis by Grade
  • Figure 89: Middle East & Africa Market Value Share and BPS Analysis by End Use, 2025 and 2035
  • Figure 90: Middle East & Africa Market Y to o to Y Growth Comparison by End Use, 2025-2035
  • Figure 91: Middle East & Africa Market Attractiveness Analysis by End Use
  • Figure 92: Global Market - Tier Structure Analysis
  • Figure 93: Global Market - Company Share Analysis
Dashboard
Dashboard
Dashboard
Dashboard
Dashboard
Dashboard

Full Research Suite comprises of:

Market outlook & trends analysis

Market outlook & trends analysis

Interviews & case studies

Interviews & case studies

Strategic recommendations

Strategic recommendations

Vendor profiles & capabilities analysis

Vendor profiles & capabilities analysis

5-year forecasts

5-year forecasts

8 regions and 60+ country-level data splits

8 regions and 60+ country-level data splits

Market segment data splits

Market segment data splits

12 months of continuous data updates

12 months of continuous data updates

DELIVERED AS:

PDF EXCEL ONLINE

Full Research Suite


$5000

$7500

$10000

Buy Report Now
Similar Industry Reports

Similar Industry Reports

Boron Analyzer Market

Boron Analyzer Market Size and Share Forecast Outlook 2025 to 2035

Boron Arsenide Bas Market

Boron Arsenide Bas Market Size and Share Forecast Outlook 2025 to 2035

Boron Minerals and Chemicals Market

Boron Minerals and Chemicals Market Size and Share Forecast Outlook 2025 to 2035

Boron Trifluoride and Complexes Market

Boron Trifluoride and Complexes Market 2025 to 2035

Boron Carbide Market

Boron Carbide Market Analysis & Trends 2025 to 2035

Hexagonal boron nitride powder (h-BN) Market

Hexagonal boron nitride powder (h-BN) Market Forecast Outlook 2025 to 2035

4-Ethylphenylboronic Acid Market

4-Ethylphenylboronic Acid Market Forecast and Outlook 2025 to 2035

3-Methoxynaphthalene-2-Boronic Acid Market

3-Methoxynaphthalene-2-Boronic Acid Market Forecast and Outlook 2025 to 2035

2-Methoxynaphthalene-1-Boronic Acid Market

2-Methoxynaphthalene-1-Boronic Acid Market Forecast and Outlook 2025 to 2035

1-Methoxynaphthalene-2-Boronic Acid Market

1-Methoxynaphthalene-2-Boronic Acid Market Forecast and Outlook 2025 to 2035

Metal Nitride Nanoparticles Market

Metal Nitride Nanoparticles Market

Silicon Nitride Market

Silicon Nitride Market Size and Share Forecast Outlook 2025 to 2035

Titanium Nitride Coating Market

Titanium Nitride Coating Market Size and Share Forecast Outlook 2025 to 2035

Aluminium Nitride Market

Aluminium Nitride Market

2D Transition Metal Carbides Nitrides Market

2D Transition Metal Carbides Nitrides Market Size and Share Forecast Outlook 2025 to 2035

Future Market Insights

Pyrolytic Boron Nitride Market

Chat With MaRIA

Chat With

MaRIA

Hi There, I am MaRIA, Your Market Research Intelligence Assistant. How may I help you?