Reports

- Global Locations -

Headquarters

Future Market Insights, Inc.

Christiana Corporate, 200
Continental Drive, Suite 401,
Newark, Delaware - 19713,
United States

T: +1-845-579-5705

Americas

Future Market Insights, Inc.

616 Corporate Way, Suite 2-9018,
Valley Cottage, NY 10989, United States

T: +1-347-918-3531

MEA

Future Market Insights

1602-6 Jumeirah Bay X2 Tower, Plot No: JLT-PH2-X2A,
Jumeirah Lakes Towers, Dubai,
United Arab Emirates

Europe

Future Market Insights

3rd Floor, 207 Regent Street,
W1B 3HH London
United Kingdom

T: + 44 (0) 20 8123 9659
D: +44 (0) 20 3287 4268

Asia Pacific

Future Market Insights

IndiaLand Global Tech Park, Unit UG-1, Behind Grand HighStreet, Phase 1, Hinjawadi, MH, Pune – 411057, India

Rotel Market Outlook from 2024 to 2034

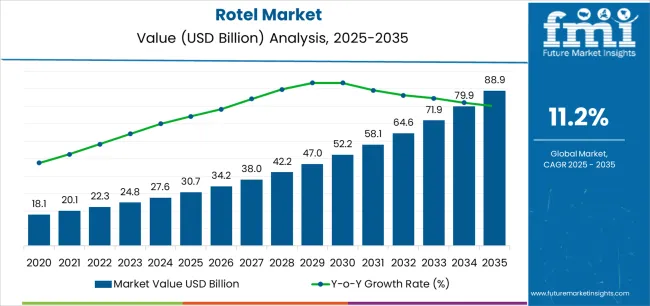
The rotel market is projected to be worth US$ 27.47 billion in 2024. The market is anticipated to reach US$ 83.81 billion by 2034. The market is further expected to surge at a CAGR of 11.8% during the forecast period 2024 to 2034.

Attributes Key Insights
Rotel Market Estimated Size in 2024 US$ 27.47 billion
Projected Market Value in 2034 US$ 83.81 billion
Value-based CAGR from 2024 to 2034 11.8%

Don't pay for what you don't need

Customize your report by selecting specific countries or regions and save 30%!

Key Market Trends and Highlights

Rotels can target niche markets such as luxury travelers, adventure seekers, and eco conscious individuals who are willing to pay premium prices for unique travel experiences.

  • Collaborating with travel agencies, tour operators, and other stakeholders in the tourism industry can help Rotels reach a wider audience and enhance their market visibility.
  • Offering personalized experiences tailored to the preferences of travelers can be a significant competitive advantage. Rotels can incorporate customization options such as themed trips, special amenities, and curated experiences to cater to diverse traveler interests and preferences.
  • Integrating advanced technologies such as smart controls, entertainment systems, and connectivity options can enhance the overall travel experience onboard Rotels. Features like Wi-Fi connectivity, streaming services, and interactive touchscreens can appeal to tech savvy travelers and differentiate Rotels from traditional modes of transportation.

2019 to 2023 Historical Analysis vs. 2024 to 2034 Market Forecast Projections

The scope for rotel rose at an 11.4% CAGR between 2019 and 2023. The global market is anticipated to witness a downwards CAGR of 11.8% over the forecast period 2024 to 2034.

The market experienced steady growth driven by factors such as increasing demand for unique travel experiences, rising disposable incomes among affluent travelers, and growing interest in luxury tourism, during the historical period.

The market saw the emergence of Rotels as a niche segment within the luxury travel industry, offering travelers the convenience of mobile accommodations combined with the comforts and amenities of a luxury hotel.

Technological advancements, such as the integration of smart features and digital innovations onboard Rotels, are expected to enhance the overall travel experience and appeal to tech savvy travelers seeking convenience and connectivity while on the road.

Consumers are seeking memorable and immersive travel experiences, driving demand for novel and unconventional accommodations such as Rotels. Integration of advanced technologies enhances the onboard experience, making Rotels more appealing to modern travelers who prioritize convenience and connectivity.

Collaboration with industry stakeholders and targeted marketing efforts help raise awareness and promote the unique offerings of Rotels to diverse market segments. Penetration into new geographic markets presents opportunities for growth and diversification, allowing Rotels to tap into emerging trends and consumer preferences.

Ronak Shah
Ronak Shah

Principal Consultant

Talk to Analyst

Find your sweet spots for generating winning opportunities in this market.

Rotel Market Key Drivers

There is a growing trend towards luxury travel experiences, where travelers seek unique and extravagant ways to explore destinations. Rotels offer a novel and opulent way to travel, combining the comforts of a hotel with the adventure of a road trip.

  • Modern travelers are increasingly valuing experiences over material possessions. Rotels provide an immersive and memorable way to experience a destination, allowing travelers to connect with local culture and landscapes in a more intimate manner.
  • Rotels offer the convenience of having accommodations, dining, and transportation all in one package. Travelers can enjoy the comforts of a hotel room while exploring multiple destinations without the hassle of constant check-ins and check outs.
  • There is potential for Rotels to expand into emerging markets where luxury tourism is on the rise. Rotels, by tapping into new markets, can capitalize on growing demand and establish a strong presence in key regions.

Challenges in the Rotel Market

Compliance with various regulations and standards related to transportation, hospitality, and safety can pose challenges for Rotels operators. Regulatory requirements may vary across different jurisdictions, requiring significant resources and expertise to navigate effectively.

  • The availability and condition of infrastructure, including roads, parking facilities, and service stations, can impact the feasibility and accessibility of Rotels operations. In regions with inadequate infrastructure, Rotels may face logistical challenges and operational constraints that hinder market expansion and customer satisfaction.
  • Maintaining and operating Rotels fleets entail significant expenses, including fuel, maintenance, insurance, staffing, and amenities. High operating costs can strain profit margins, particularly if Rotels operators face pricing pressures or difficulty in passing on costs to customers.
  • The demand for luxury travel experiences, including Rotels accommodations, may be sensitive to seasonal fluctuations and economic conditions. Economic downturns, recessions, or changes in consumer spending habits can affect discretionary travel expenditures, leading to reduced demand for Rotels services during periods of economic uncertainty.

Get the data you need at a Fraction of the cost

Personalize your report by choosing insights you need
and save 40%!

Comparative View of Adjacent Industries

Future Market Insights has compared two other industries, luxury hotel market, and boutique hotel market. Rotels can incorporate wellness facilities and programs onboard, such as fitness centers, spa services, and healthy dining options, with a growing emphasis on health and wellness. Providing opportunities for relaxation, rejuvenation, and mindful experiences can attract health conscious travelers seeking holistic travel experiences.

The growth of global tourism, fueled by rising affluence, improved transportation infrastructure, and increasing travel aspirations, contributes to the expansion of the luxury hotel market. Luxury hotels cater to this demand by offering premium amenities, services, and experiences, as more travelers seek high end and personalized travel experiences.

Boutique hotels offer distinct and authentic experiences characterized by their intimate atmosphere, personalized service, and distinctive design elements. Boutique hotels attract guests who appreciate the charm and individuality of boutique accommodations, as travelers seek more memorable and immersive experiences.

Rotel Market:

Attributes Rotel Market
CAGR from 2024 to 2034 11.8%
Key Trends
  • Understanding the diverse needs and preferences of different demographic segments, including families, solo travelers, couples, and seniors, can help Rotels tailor their offerings and marketing strategies to effectively target specific market segments and maximize customer satisfaction.
  • Rotels can capitalize on the appeal of diverse destinations and routes, offering travelers the opportunity to explore a variety of landscapes, cultures, and attractions.
Opportunity
  • Positioning Rotels as a unique venue for special events, celebrations, and group travel experiences can create additional revenue streams and attract customers looking for memorable and exclusive travel experiences for weddings, corporate retreats, family reunions, and other occasions.
  • Embracing sustainable practices and promoting responsible tourism initiatives can resonate with environmentally conscious travelers and enhance the brand reputation of Rotels.

Luxury Hotel Market:

Attributes Luxury Hotel Market
CAGR from 2023 to 2033 5.3%
Key Trends
  • Emerging markets, including China, India, and Southeast Asia, represent significant growth opportunities for the luxury hotel industry.
  • Luxury hotels differentiate themselves by offering bespoke experiences, personalized services, and exclusive amenities tailored to the preferences and interests of discerning travelers, driving demand for luxury accommodations.
Opportunity
  • Luxury hotels create distinctive identities and elevate the guest experience, attracting affluent travelers and enhancing brand loyalty.
  • The integration of technology into luxury hotel operations enhances guest engagement, service efficiency, and operational excellence.

Boutique Hotel Market:

Attributes Boutique Hotel Market
CAGR from 2022 to 2032 6.7%
Key Trends
  • Boutique hotels often cater to the preferences of younger demographics by offering trendy designs, social spaces, and curated experiences that resonate with their lifestyle and preferences for authenticity and local immersion.
  • Boutique hotels often reflect the local culture, heritage, and identity of their surroundings, offering guests an opportunity to connect with the destination on a deeper level.
Opportunity
  • Independent travelers, including solo travelers, couples, and small groups, prefer boutique hotels for their individualized service, character, and sense of community.
  • Boutique hotels differentiate themselves by providing personalized and attentive service that exceeds guest expectations.

Country-wise Insights

The below table showcases revenues in terms of the top 5 leading countries, spearheaded by India and France. The countries are expected to lead the market through 2034.

Countries Forecast CAGRs from 2024 to 2034
The United States 6.3%
The United Kingdom 6.9%
Germany 7.4%
France 9.7%
India 15.4%

Rising Demand for Unique Travel Experiences Driving the Market in the United States

The rotel market in the United States expected to expand at a CAGR of 6.3% through 2034. There is growing demand for unique forms of accommodation such as luxurious hotels on wheels, as travelers seek novel and memorable experiences.

Rotels offer a distinctive and immersive way to explore the diverse landscapes, attractions, and cultural offerings across the United States, catering to the preferences of travelers seeking unconventional and adventurous travel experiences.

The luxury travel segment is experiencing robust growth in the United States, driven by increasing disposable incomes, changing consumer preferences, and the desire for exclusive and personalized travel experiences.

Rotels Luxurious Hotels on Wheels cater to affluent travelers who value comfort, convenience, and luxury, offering premium accommodations, amenities, and services that align with the preferences of discerning travelers.

Trend towards Staycations and Domestic Travel to Accelerate Market Growth in the United Kingdom

The rotel market in the United Kingdom is anticipated to expand at a CAGR of 6.9% through 2034. The United Kingdom has seen a rise in staycations and domestic travel, driven by factors such as uncertainty surrounding international travel, environmental concerns, and a desire to support local economies.

Rotels provide an attractive option for the residents of the country looking to embark on road trips and explore the scenic countryside, coastal regions, and charming towns while enjoying the comforts of luxury accommodations on wheels.

Travelers in the United Kingdom are increasingly prioritizing sustainability and eco friendliness when choosing travel accommodations, as environmental awareness grows.

Rotels operators can differentiate themselves by incorporating eco-friendly practices, energy efficient technologies, and sustainable materials into their operations, appealing to environmentally conscious travelers and aligning with the commitment of the country to sustainability and responsible tourism.

Flexibility and Freedom of Travel Spearhead the Market in Germany

Rotel trends in Germany are taking a turn for the better. A 7.4% CAGR is forecast for the country from 2024 to 2034. Rotels provide travelers with flexibility and freedom to explore Germany at their own pace, offering convenient accommodations and transportation to popular tourist destinations as well as off the beaten path locales.

With Rotels, travelers have the flexibility to customize their itineraries, stopovers, and activities, enabling them to embark on personalized and authentic travel experiences tailored to their interests and preferences.

Germany boasts scenic routes, picturesque landscapes, and pristine natural areas that attract outdoor enthusiasts and nature lovers. Rotels allow travelers to embark on immersive journeys through national parks, scenic countryside, and charming villages in the country, providing unparalleled access to remote and scenic destinations while enjoying the comforts of luxury accommodations on wheels.

Rise in Adventure Tourism Fueling the Market in France

The rotel market in France is poised to expand at a CAGR of 9.7% through 2034. There has been a growing trend towards adventure tourism, where travelers seek unique and adventurous experiences. Rotels cater to this trend by offering a novel way to explore destinations off the beaten path.

Travelers may opt for sustainable travel options such as Rotels, with increasing environmental consciousness, which typically have lower environmental impacts compared to traditional hotel accommodations and transportation methods.

Preference for Luxury and Comfort Driving the Demand in India

The rotel market in India is anticipated to expand at a CAGR of 15.4% through 2034. Indian travelers, particularly those from urban centers, have a growing affinity for luxury and comfort when it comes to travel accommodations.

Rotels Luxurious Hotels on Wheels offer premium amenities, personalized services, and opulent accommodations that cater to the preferences of affluent Indian travelers seeking a high level of comfort and convenience during their journeys.

Adventure tourism is gaining popularity among Indian travelers, especially among younger demographics seeking outdoor experiences and adrenaline fueled adventures.

Rotels operators can integrate adventure activities, nature treks, and outdoor excursions into their itineraries, offering travelers the opportunity to explore scenic landscapes, wildlife reserves, and adventure destinations while enjoying the comforts of luxury accommodations on wheels.

Category-wise Insights

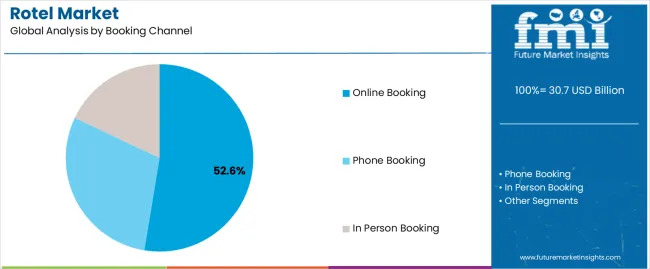
The below table highlights how online booking segment is projected to lead the market in terms of booking channel, and is expected to account for a share of 46.0% in 2024. Based on tour type, the package traveler segment is expected to account for a share of 39.0% in 2024.

Category Market Shares in 2024
Online Booking 46.0%
Package Traveler 39.0%

Online Booking Claims High Demand for Rotels

Based on booking channel the online booking segment is expected to continue dominating the rotel market. Online booking platforms offer travelers the convenience of researching, comparing, and booking rotel accommodations from anywhere with internet access.

Online platforms enable travelers to easily browse available options, view photos and descriptions, and make reservations in real time, with user friendly interfaces and intuitive booking processes, enhancing accessibility and convenience for potential guests.

Online booking channels provide Rotels operators with a platform to showcase their offerings to a global audience of potential travelers. Rotels can increase their visibility and reach travelers who may not have been aware of their services through traditional marketing channels alone, by listing their accommodations on multiple online travel agencies, booking websites, and travel aggregators, expanding their customer base and driving bookings.

Package Traveler Segment to Hold High Demand for Rotel

In terms of tour type, the package traveler segment is expected to continue dominating the rotel market, attributed to several key factors. Package travelers seek convenience and hassle free travel experiences, where accommodations, transportation, meals, and activities are bundled into a comprehensive package.

Rotels cater to package travelers by offering all-inclusive itineraries that provide seamless and convenient travel arrangements, eliminating the need for travelers to plan and coordinate individual components of their trip.

Package travelers value the cost effectiveness and value proposition offered by packaged travel deals. Rotels Luxurious Hotels on Wheels provide package travelers with competitive pricing, bundled services, and added amenities, delivering value for money compared to piecemeal bookings of accommodations, transportation, and activities separately.
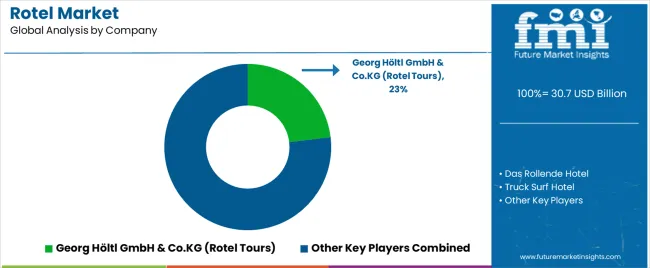
Competitive Landscape

The competitive landscape of the rotel market is characterized by a diverse array of players, each vying to capture market share and differentiate themselves in the increasingly competitive luxury travel sector.

Rotels operators face both opportunities and challenges in positioning themselves as leaders in the luxurious hotels on wheels market, as the demand for unique and immersive travel experiences continues to grow globally.

Company Portfolio

  • Das Rollende Hotel offers a unique blend of luxury accommodation and travel experience on wheels. With meticulously designed interiors, state of the art amenities, and personalized service, Das Rollende Hotel redefines the concept of mobile hospitality. From spacious suites to gourmet dining options, guests can enjoy the comfort and convenience of a hotel while exploring scenic routes and destinations.
  • Truck Surf Hotel provides a one of a kind adventure combining the thrill of surfing with the comfort of a hotel on wheels. The innovative concept allows guests to chase the waves and explore coastal regions while enjoying cozy accommodations, communal spaces, and surf instruction from experienced guides. With carefully curated routes and immersive experiences, Truck Surf Hotel offers an unforgettable journey for surf enthusiasts and travelers seeking unique adventures.

Key Coverage in the Rotel Industry Report

  • Rotels luxury travel experiences
  • Hotels on wheels luxury accommodations
  • Mobile luxury lodging solutions
  • Rotels extravagant travel experiences
  • Luxurious travel experiences on wheels
  • Mobile boutique hotel experiences
  • Mobile luxury hospitality services
  • Rotels deluxe accommodations on wheels
  • Luxury hotel amenities on the move
  • High-end lodging experiences on wheels
  • Rotels opulent travel accommodations
  • Luxury Travel and Hospitality Industry
  • Recreational Vehicle Market
  • Boutique Hotel Market
  • Adventure Travel Market
  • Luxury Transportation Market

Report Scope

Attribute Details
Estimated Market Size in 2024 US$ 27.47 billion
Projected Market Valuation in 2034 US$ 83.81 billion
Value-based CAGR 2024 to 2034 11.8%
Forecast Period 2024 to 2034
Historical Data Available for 2019 to 2023
Market Analysis Value in US$ billion
Key Regions Covered
  • North America
  • Latin America
  • Western Europe
  • Eastern Europe
  • South Asia and Pacific
  • East Asia
  • The Middle East & Africa
Key Market Segments Covered
  • Vehicle Type
  • Booking Channel
  • Tourists Type
  • Tour Type
  • Age Group
  • Region
Key Countries Profiled
  • The United States
  • Canada
  • Brazil
  • Mexico
  • Germany
  • France
  • France
  • Spain
  • Italy
  • Russia
  • Poland
  • Czech Republic
  • Romania
  • India
  • Bangladesh
  • Australia
  • New Zealand
  • China
  • Japan
  • South Korea
  • GCC countries
  • South Africa
  • Israel
Key Companies Profiled
  • Das Rollende Hotel
  • Truck Surf Hotel
  • Radisson Blue
  • Georg Höltl GmbH & Co.KG (Rotel Tours)
  • Audley Travel Group Limited
  • Palace on Wheels
  • Midnight Trains

Segmentation Analysis of the Rotel Market

By Vehicle Type:

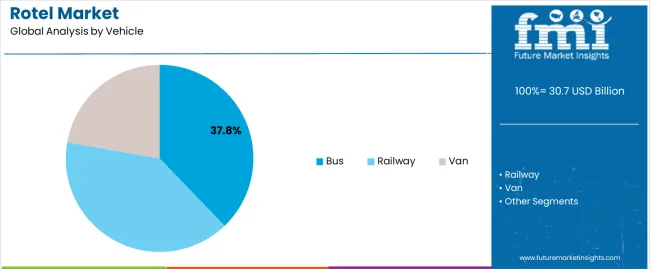
  • Railway
  • Bus
  • Van

By Booking Channel:

  • Phone Booking
  • Online Booking
  • In person Booking

By Tourists Type:

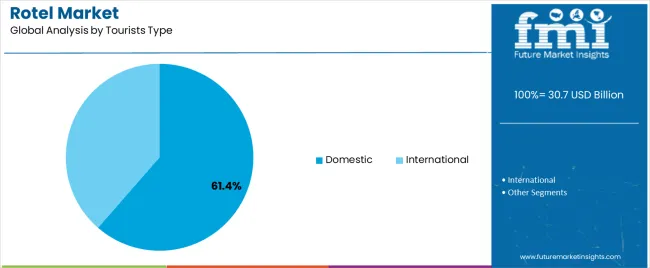
  • Domestic
  • International

By Tour Type:

  • Independent Traveler
  • Tour Groups
  • Package Traveler

By Age Group:

  • 15-25 Years
  • 26-35 Years
  • 36-45 Years
  • 46- 55 Years
  • 56-65 Years
  • 66-75 Years

By Region:

  • North America
  • Latin America
  • Western Europe
  • Eastern Europe
  • South Asia and Pacific
  • East Asia
  • The Middle East and Africa

Frequently Asked Questions

What is the anticipated value of the rotel market in 2024?

The rotel market is projected to reach a valuation of US$ 27.47 billion in 2024.

What is the expected CAGR for the rotel market until 2034?

The rotel industry is set to expand by a CAGR of 11.8% through 2034.

How much valuation is projected for the Rotel market in 2034?

The rotel market is forecast to reach US$ 83.81 billion by 2034.

Which country is projected to lead the Rotel market?

India is expected to be the top performing market, exhibiting a CAGR of 15.4% through 2034.

Which is the dominant booking channel in the Rotel domain?

Online booking segment is preferred, and is expected to account for a share of 46.0% in 2024.

Table of Content

1. Executive Summary

    1.1. Global Market Outlook

    1.2. Demand-side Trends

    1.3. Supply-side Trends

    1.4. Technology Roadmap Analysis

    1.5. Analysis and Recommendations

2. Market Overview

    2.1. Market Coverage / Taxonomy

    2.2. Market Definition / Scope / Limitations

3. Market Background

    3.1. Market Dynamics

        3.1.1. Drivers

        3.1.2. Restraints

        3.1.3. Opportunity

        3.1.4. Trends

    3.2. Scenario Forecast

        3.2.1. Demand in Optimistic Scenario

        3.2.2. Demand in Likely Scenario

        3.2.3. Demand in Conservative Scenario

    3.3. Opportunity Map Analysis

    3.4. Investment Feasibility Matrix

    3.5. PESTLE and Porter’s Analysis

    3.6. Regulatory Landscape

        3.6.1. By Key Regions

        3.6.2. By Key Countries

    3.7. Regional Parent Market Outlook

4. Global Market Analysis 2019 to 2023 and Forecast, 2024 to 2034

    4.1. Historical Market Size Value (US$ Million) Analysis, 2019 to 2023

    4.2. Current and Future Market Size Value (US$ Million) Projections, 2024 to 2034

        4.2.1. Y-o-Y Growth Trend Analysis

        4.2.2. Absolute $ Opportunity Analysis

5. Global Market Analysis 2019 to 2023 and Forecast 2024 to 2034, By Vehicle Type

    5.1. Introduction / Key Findings

    5.2. Historical Market Size Value (US$ Million) Analysis By Vehicle Type, 2019 to 2023

    5.3. Current and Future Market Size Value (US$ Million) Analysis and Forecast By Vehicle Type, 2024 to 2034

        5.3.1. Railway

        5.3.2. Bus

        5.3.3. Van

    5.4. Y-o-Y Growth Trend Analysis By Vehicle Type, 2019 to 2023

    5.5. Absolute $ Opportunity Analysis By Vehicle Type, 2024 to 2034

6. Global Market Analysis 2019 to 2023 and Forecast 2024 to 2034, By Booking Channel

    6.1. Introduction / Key Findings

    6.2. Historical Market Size Value (US$ Million) Analysis By Booking Channel, 2019 to 2023

    6.3. Current and Future Market Size Value (US$ Million) Analysis and Forecast By Booking Channel, 2024 to 2034

        6.3.1. Phone Booking

        6.3.2. Online Booking

        6.3.3. In-Person Booking

    6.4. Y-o-Y Growth Trend Analysis By Booking Channel, 2019 to 2023

    6.5. Absolute $ Opportunity Analysis By Booking Channel, 2024 to 2034

7. Global Market Analysis 2019 to 2023 and Forecast 2024 to 2034, By Tourists Type 

    7.1. Introduction / Key Findings

    7.2. Historical Market Size Value (US$ Million) Analysis By Tourists Type, 2019 to 2023

    7.3. Current and Future Market Size Value (US$ Million) Analysis and Forecast By Tourists Type, 2024 to 2034

        7.3.1. Domestic

        7.3.2. International

    7.4. Y-o-Y Growth Trend Analysis By Tourists Type, 2019 to 2023

    7.5. Absolute $ Opportunity Analysis By Tourists Type, 2024 to 2034

8. Global Market Analysis 2019 to 2023 and Forecast 2024 to 2034, By Tour Type

    8.1. Introduction / Key Findings

    8.2. Historical Market Size Value (US$ Million) Analysis By Tour Type, 2019 to 2023

    8.3. Current and Future Market Size Value (US$ Million) Analysis and Forecast By Tour Type, 2024 to 2034

        8.3.1. Independent Traveler

        8.3.2. Tour Groups

        8.3.3. Package Traveler

    8.4. Y-o-Y Growth Trend Analysis By Tour Type, 2019 to 2023

    8.5. Absolute $ Opportunity Analysis By Tour Type, 2024 to 2034

9. Global Market Analysis 2019 to 2023 and Forecast 2024 to 2034, By Age Group

    9.1. Introduction / Key Findings

    9.2. Historical Market Size Value (US$ Million) Analysis By Age Group, 2019 to 2023

    9.3. Current and Future Market Size Value (US$ Million) Analysis and Forecast By Age Group, 2024 to 2034

        9.3.1. 15-25 Years

        9.3.2. 26-35 Years

        9.3.3. 36-45 Years

        9.3.4. 46- 55 Years

        9.3.5. 56-65 Years

        9.3.6. 66-75 Years

    9.4. Y-o-Y Growth Trend Analysis By Age Group, 2019 to 2023

    9.5. Absolute $ Opportunity Analysis By Age Group, 2024 to 2034

10. Global Market Analysis 2019 to 2023 and Forecast 2024 to 2034, By Region

    10.1. Introduction

    10.2. Historical Market Size Value (US$ Million) Analysis By Region, 2019 to 2023

    10.3. Current Market Size Value (US$ Million) Analysis and Forecast By Region, 2024 to 2034

        10.3.1. North America

        10.3.2. Latin America

        10.3.3. Western Europe

        10.3.4. Eastern Europe

        10.3.5. South Asia and Pacific

        10.3.6. East Asia

        10.3.7. Middle East and Africa

    10.4. Market Attractiveness Analysis By Region

11. North America Market Analysis 2019 to 2023 and Forecast 2024 to 2034, By Country

    11.1. Historical Market Size Value (US$ Million) Trend Analysis By Market Taxonomy, 2019 to 2023

    11.2. Market Size Value (US$ Million) Forecast By Market Taxonomy, 2024 to 2034

        11.2.1. By Country

            11.2.1.1. USA

            11.2.1.2. Canada

        11.2.2. By Vehicle Type

        11.2.3. By Booking Channel

        11.2.4. By Tourists Type

        11.2.5. By Tour Type

        11.2.6. By Age Group

    11.3. Market Attractiveness Analysis

        11.3.1. By Country

        11.3.2. By Vehicle Type

        11.3.3. By Booking Channel

        11.3.4. By Tourists Type

        11.3.5. By Tour Type

        11.3.6. By Age Group

    11.4. Key Takeaways

12. Latin America Market Analysis 2019 to 2023 and Forecast 2024 to 2034, By Country

    12.1. Historical Market Size Value (US$ Million) Trend Analysis By Market Taxonomy, 2019 to 2023

    12.2. Market Size Value (US$ Million) Forecast By Market Taxonomy, 2024 to 2034

        12.2.1. By Country

            12.2.1.1. Brazil

            12.2.1.2. Mexico

            12.2.1.3. Rest of Latin America

        12.2.2. By Vehicle Type

        12.2.3. By Booking Channel

        12.2.4. By Tourists Type

        12.2.5. By Tour Type

        12.2.6. By Age Group

    12.3. Market Attractiveness Analysis

        12.3.1. By Country

        12.3.2. By Vehicle Type

        12.3.3. By Booking Channel

        12.3.4. By Tourists Type

        12.3.5. By Tour Type

        12.3.6. By Age Group

    12.4. Key Takeaways

13. Western Europe Market Analysis 2019 to 2023 and Forecast 2024 to 2034, By Country

    13.1. Historical Market Size Value (US$ Million) Trend Analysis By Market Taxonomy, 2019 to 2023

    13.2. Market Size Value (US$ Million) Forecast By Market Taxonomy, 2024 to 2034

        13.2.1. By Country

            13.2.1.1. Germany

            13.2.1.2. UK

            13.2.1.3. France

            13.2.1.4. Spain

            13.2.1.5. Italy

            13.2.1.6. Rest of Western Europe

        13.2.2. By Vehicle Type

        13.2.3. By Booking Channel

        13.2.4. By Tourists Type

        13.2.5. By Tour Type

        13.2.6. By Age Group

    13.3. Market Attractiveness Analysis

        13.3.1. By Country

        13.3.2. By Vehicle Type

        13.3.3. By Booking Channel

        13.3.4. By Tourists Type

        13.3.5. By Tour Type

        13.3.6. By Age Group

    13.4. Key Takeaways

14. Eastern Europe Market Analysis 2019 to 2023 and Forecast 2024 to 2034, By Country

    14.1. Historical Market Size Value (US$ Million) Trend Analysis By Market Taxonomy, 2019 to 2023

    14.2. Market Size Value (US$ Million) Forecast By Market Taxonomy, 2024 to 2034

        14.2.1. By Country

            14.2.1.1. Poland

            14.2.1.2. Russia

            14.2.1.3. Czech Republic

            14.2.1.4. Romania

            14.2.1.5. Rest of Eastern Europe

        14.2.2. By Vehicle Type

        14.2.3. By Booking Channel

        14.2.4. By Tourists Type

        14.2.5. By Tour Type

        14.2.6. By Age Group

    14.3. Market Attractiveness Analysis

        14.3.1. By Country

        14.3.2. By Vehicle Type

        14.3.3. By Booking Channel

        14.3.4. By Tourists Type

        14.3.5. By Tour Type

        14.3.6. By Age Group

    14.4. Key Takeaways

15. South Asia and Pacific Market Analysis 2019 to 2023 and Forecast 2024 to 2034, By Country

    15.1. Historical Market Size Value (US$ Million) Trend Analysis By Market Taxonomy, 2019 to 2023

    15.2. Market Size Value (US$ Million) Forecast By Market Taxonomy, 2024 to 2034

        15.2.1. By Country

            15.2.1.1. India

            15.2.1.2. Bangladesh

            15.2.1.3. Australia

            15.2.1.4. New Zealand

            15.2.1.5. Rest of South Asia and Pacific

        15.2.2. By Vehicle Type

        15.2.3. By Booking Channel

        15.2.4. By Tourists Type

        15.2.5. By Tour Type

        15.2.6. By Age Group

    15.3. Market Attractiveness Analysis

        15.3.1. By Country

        15.3.2. By Vehicle Type

        15.3.3. By Booking Channel

        15.3.4. By Tourists Type

        15.3.5. By Tour Type

        15.3.6. By Age Group

    15.4. Key Takeaways

16. East Asia Market Analysis 2019 to 2023 and Forecast 2024 to 2034, By Country

    16.1. Historical Market Size Value (US$ Million) Trend Analysis By Market Taxonomy, 2019 to 2023

    16.2. Market Size Value (US$ Million) Forecast By Market Taxonomy, 2024 to 2034

        16.2.1. By Country

            16.2.1.1. China

            16.2.1.2. Japan

            16.2.1.3. South Korea

        16.2.2. By Vehicle Type

        16.2.3. By Booking Channel

        16.2.4. By Tourists Type

        16.2.5. By Tour Type

        16.2.6. By Age Group

    16.3. Market Attractiveness Analysis

        16.3.1. By Country

        16.3.2. By Vehicle Type

        16.3.3. By Booking Channel

        16.3.4. By Tourists Type

        16.3.5. By Tour Type

        16.3.6. By Age Group

    16.4. Key Takeaways

17. Middle East and Africa Market Analysis 2019 to 2023 and Forecast 2024 to 2034, By Country

    17.1. Historical Market Size Value (US$ Million) Trend Analysis By Market Taxonomy, 2019 to 2023

    17.2. Market Size Value (US$ Million) Forecast By Market Taxonomy, 2024 to 2034

        17.2.1. By Country

            17.2.1.1. GCC Countries

            17.2.1.2. South Africa

            17.2.1.3. Israel

            17.2.1.4. Rest of MEA

        17.2.2. By Vehicle Type

        17.2.3. By Booking Channel

        17.2.4. By Tourists Type

        17.2.5. By Tour Type

        17.2.6. By Age Group

    17.3. Market Attractiveness Analysis

        17.3.1. By Country

        17.3.2. By Vehicle Type

        17.3.3. By Booking Channel

        17.3.4. By Tourists Type

        17.3.5. By Tour Type

        17.3.6. By Age Group

    17.4. Key Takeaways

18. Key Countries Market Analysis

    18.1. USA

        18.1.1. Market Share Analysis, 2023

            18.1.1.1. By Vehicle Type

            18.1.1.2. By Booking Channel

            18.1.1.3. By Tourists Type

            18.1.1.4. By Tour Type

            18.1.1.5. By Age Group

    18.2. Canada

        18.2.1. Market Share Analysis, 2023

            18.2.1.1. By Vehicle Type

            18.2.1.2. By Booking Channel

            18.2.1.3. By Tourists Type

            18.2.1.4. By Tour Type

            18.2.1.5. By Age Group

    18.3. Brazil

        18.3.1. Market Share Analysis, 2023

            18.3.1.1. By Vehicle Type

            18.3.1.2. By Booking Channel

            18.3.1.3. By Tourists Type

            18.3.1.4. By Tour Type

            18.3.1.5. By Age Group

    18.4. Mexico

        18.4.1. Market Share Analysis, 2023

            18.4.1.1. By Vehicle Type

            18.4.1.2. By Booking Channel

            18.4.1.3. By Tourists Type

            18.4.1.4. By Tour Type

            18.4.1.5. By Age Group

    18.5. Germany

        18.5.1. Market Share Analysis, 2023

            18.5.1.1. By Vehicle Type

            18.5.1.2. By Booking Channel

            18.5.1.3. By Tourists Type

            18.5.1.4. By Tour Type

            18.5.1.5. By Age Group

    18.6. UK

        18.6.1. Market Share Analysis, 2023

            18.6.1.1. By Vehicle Type

            18.6.1.2. By Booking Channel

            18.6.1.3. By Tourists Type

            18.6.1.4. By Tour Type

            18.6.1.5. By Age Group

    18.7. France

        18.7.1. Market Share Analysis, 2023

            18.7.1.1. By Vehicle Type

            18.7.1.2. By Booking Channel

            18.7.1.3. By Tourists Type

            18.7.1.4. By Tour Type

            18.7.1.5. By Age Group

    18.8. Spain

        18.8.1. Market Share Analysis, 2023

            18.8.1.1. By Vehicle Type

            18.8.1.2. By Booking Channel

            18.8.1.3. By Tourists Type

            18.8.1.4. By Tour Type

            18.8.1.5. By Age Group

    18.9. Italy

        18.9.1. Market Share Analysis, 2023

            18.9.1.1. By Vehicle Type

            18.9.1.2. By Booking Channel

            18.9.1.3. By Tourists Type

            18.9.1.4. By Tour Type

            18.9.1.5. By Age Group

    18.10. Poland

        18.10.1. Market Share Analysis, 2023

            18.10.1.1. By Vehicle Type

            18.10.1.2. By Booking Channel

            18.10.1.3. By Tourists Type

            18.10.1.4. By Tour Type

            18.10.1.5. By Age Group

    18.11. Russia

        18.11.1. Market Share Analysis, 2023

            18.11.1.1. By Vehicle Type

            18.11.1.2. By Booking Channel

            18.11.1.3. By Tourists Type

            18.11.1.4. By Tour Type

            18.11.1.5. By Age Group

    18.12. Czech Republic

        18.12.1. Market Share Analysis, 2023

            18.12.1.1. By Vehicle Type

            18.12.1.2. By Booking Channel

            18.12.1.3. By Tourists Type

            18.12.1.4. By Tour Type

            18.12.1.5. By Age Group

    18.13. Romania

        18.13.1. Market Share Analysis, 2023

            18.13.1.1. By Vehicle Type

            18.13.1.2. By Booking Channel

            18.13.1.3. By Tourists Type

            18.13.1.4. By Tour Type

            18.13.1.5. By Age Group

    18.14. India

        18.14.1. Market Share Analysis, 2023

            18.14.1.1. By Vehicle Type

            18.14.1.2. By Booking Channel

            18.14.1.3. By Tourists Type

            18.14.1.4. By Tour Type

            18.14.1.5. By Age Group

    18.15. Bangladesh

        18.15.1. Market Share Analysis, 2023

            18.15.1.1. By Vehicle Type

            18.15.1.2. By Booking Channel

            18.15.1.3. By Tourists Type

            18.15.1.4. By Tour Type

            18.15.1.5. By Age Group

    18.16. Australia

        18.16.1. Market Share Analysis, 2023

            18.16.1.1. By Vehicle Type

            18.16.1.2. By Booking Channel

            18.16.1.3. By Tourists Type

            18.16.1.4. By Tour Type

            18.16.1.5. By Age Group

    18.17. New Zealand

        18.17.1. Market Share Analysis, 2023

            18.17.1.1. By Vehicle Type

            18.17.1.2. By Booking Channel

            18.17.1.3. By Tourists Type

            18.17.1.4. By Tour Type

            18.17.1.5. By Age Group

    18.18. China

        18.18.1. Market Share Analysis, 2023

            18.18.1.1. By Vehicle Type

            18.18.1.2. By Booking Channel

            18.18.1.3. By Tourists Type

            18.18.1.4. By Tour Type

            18.18.1.5. By Age Group

    18.19. Japan

        18.19.1. Market Share Analysis, 2023

            18.19.1.1. By Vehicle Type

            18.19.1.2. By Booking Channel

            18.19.1.3. By Tourists Type

            18.19.1.4. By Tour Type

            18.19.1.5. By Age Group

    18.20. South Korea

        18.20.1. Market Share Analysis, 2023

            18.20.1.1. By Vehicle Type

            18.20.1.2. By Booking Channel

            18.20.1.3. By Tourists Type

            18.20.1.4. By Tour Type

            18.20.1.5. By Age Group

    18.21. GCC Countries

        18.21.1. Market Share Analysis, 2023

            18.21.1.1. By Vehicle Type

            18.21.1.2. By Booking Channel

            18.21.1.3. By Tourists Type

            18.21.1.4. By Tour Type

            18.21.1.5. By Age Group

    18.22. South Africa

        18.22.1. Market Share Analysis, 2023

            18.22.1.1. By Vehicle Type

            18.22.1.2. By Booking Channel

            18.22.1.3. By Tourists Type

            18.22.1.4. By Tour Type

            18.22.1.5. By Age Group

    18.23. Israel

        18.23.1. Market Share Analysis, 2023

            18.23.1.1. By Vehicle Type

            18.23.1.2. By Booking Channel

            18.23.1.3. By Tourists Type

            18.23.1.4. By Tour Type

            18.23.1.5. By Age Group

19. Market Structure Analysis

    19.1. Competition Dashboard

    19.2. Competition Benchmarking

    19.3. Market Share Analysis of Top Players

        19.3.1. By Regional

        19.3.2. By Vehicle Type

        19.3.3. By Booking Channel

        19.3.4. By Tourists Type

        19.3.5. By Tour Type

        19.3.6. By Age Group

20. Competition Analysis

    20.1. Competition Deep Dive

        20.1.1. Das Rollende Hotel

            20.1.1.1. Overview

            20.1.1.2. Product Portfolio

            20.1.1.3. Profitability by Market Segments

            20.1.1.4. Sales Footprint

            20.1.1.5. Strategy Overview

                20.1.1.5.1. Marketing Strategy

        20.1.2. Truck Surf Hotel

            20.1.2.1. Overview

            20.1.2.2. Product Portfolio

            20.1.2.3. Profitability by Market Segments

            20.1.2.4. Sales Footprint

            20.1.2.5. Strategy Overview

                20.1.2.5.1. Marketing Strategy

        20.1.3. Radisson Blue

            20.1.3.1. Overview

            20.1.3.2. Product Portfolio

            20.1.3.3. Profitability by Market Segments

            20.1.3.4. Sales Footprint

            20.1.3.5. Strategy Overview

                20.1.3.5.1. Marketing Strategy

        20.1.4. Georg Höltl GmbH & Co.KG

            20.1.4.1. Overview

            20.1.4.2. Product Portfolio

            20.1.4.3. Profitability by Market Segments

            20.1.4.4. Sales Footprint

            20.1.4.5. Strategy Overview

                20.1.4.5.1. Marketing Strategy

        20.1.5. Audley Travel Group Limited

            20.1.5.1. Overview

            20.1.5.2. Product Portfolio

            20.1.5.3. Profitability by Market Segments

            20.1.5.4. Sales Footprint

            20.1.5.5. Strategy Overview

                20.1.5.5.1. Marketing Strategy

        20.1.6. Palace on Wheels

            20.1.6.1. Overview

            20.1.6.2. Product Portfolio

            20.1.6.3. Profitability by Market Segments

            20.1.6.4. Sales Footprint

            20.1.6.5. Strategy Overview

                20.1.6.5.1. Marketing Strategy

        20.1.7. Midnight Trains

            20.1.7.1. Overview

            20.1.7.2. Product Portfolio

            20.1.7.3. Profitability by Market Segments

            20.1.7.4. Sales Footprint

            20.1.7.5. Strategy Overview

                20.1.7.5.1. Marketing Strategy

21. Assumptions & Acronyms Used

22. Research Methodology

List of Tables

Table 1: Global Market Value (US$ Million) Forecast by Region, 2019 to 2034

Table 2: Global Market Value (US$ Million) Forecast by Vehicle Type, 2019 to 2034

Table 3: Global Market Value (US$ Million) Forecast by Booking Channel, 2019 to 2034

Table 4: Global Market Value (US$ Million) Forecast by Tourists Type, 2019 to 2034

Table 5: Global Market Value (US$ Million) Forecast by Tour Type, 2019 to 2034

Table 6: Global Market Value (US$ Million) Forecast by Age Group, 2019 to 2034

Table 7: North America Market Value (US$ Million) Forecast by Country, 2019 to 2034

Table 8: North America Market Value (US$ Million) Forecast by Vehicle Type, 2019 to 2034

Table 9: North America Market Value (US$ Million) Forecast by Booking Channel, 2019 to 2034

Table 10: North America Market Value (US$ Million) Forecast by Tourists Type, 2019 to 2034

Table 11: North America Market Value (US$ Million) Forecast by Tour Type, 2019 to 2034

Table 12: North America Market Value (US$ Million) Forecast by Age Group, 2019 to 2034

Table 13: Latin America Market Value (US$ Million) Forecast by Country, 2019 to 2034

Table 14: Latin America Market Value (US$ Million) Forecast by Vehicle Type, 2019 to 2034

Table 15: Latin America Market Value (US$ Million) Forecast by Booking Channel, 2019 to 2034

Table 16: Latin America Market Value (US$ Million) Forecast by Tourists Type, 2019 to 2034

Table 17: Latin America Market Value (US$ Million) Forecast by Tour Type, 2019 to 2034

Table 18: Latin America Market Value (US$ Million) Forecast by Age Group, 2019 to 2034

Table 19: Western Europe Market Value (US$ Million) Forecast by Country, 2019 to 2034

Table 20: Western Europe Market Value (US$ Million) Forecast by Vehicle Type, 2019 to 2034

Table 21: Western Europe Market Value (US$ Million) Forecast by Booking Channel, 2019 to 2034

Table 22: Western Europe Market Value (US$ Million) Forecast by Tourists Type, 2019 to 2034

Table 23: Western Europe Market Value (US$ Million) Forecast by Tour Type, 2019 to 2034

Table 24: Western Europe Market Value (US$ Million) Forecast by Age Group, 2019 to 2034

Table 25: Eastern Europe Market Value (US$ Million) Forecast by Country, 2019 to 2034

Table 26: Eastern Europe Market Value (US$ Million) Forecast by Vehicle Type, 2019 to 2034

Table 27: Eastern Europe Market Value (US$ Million) Forecast by Booking Channel, 2019 to 2034

Table 28: Eastern Europe Market Value (US$ Million) Forecast by Tourists Type, 2019 to 2034

Table 29: Eastern Europe Market Value (US$ Million) Forecast by Tour Type, 2019 to 2034

Table 30: Eastern Europe Market Value (US$ Million) Forecast by Age Group, 2019 to 2034

Table 31: South Asia and Pacific Market Value (US$ Million) Forecast by Country, 2019 to 2034

Table 32: South Asia and Pacific Market Value (US$ Million) Forecast by Vehicle Type, 2019 to 2034

Table 33: South Asia and Pacific Market Value (US$ Million) Forecast by Booking Channel, 2019 to 2034

Table 34: South Asia and Pacific Market Value (US$ Million) Forecast by Tourists Type, 2019 to 2034

Table 35: South Asia and Pacific Market Value (US$ Million) Forecast by Tour Type, 2019 to 2034

Table 36: South Asia and Pacific Market Value (US$ Million) Forecast by Age Group, 2019 to 2034

Table 37: East Asia Market Value (US$ Million) Forecast by Country, 2019 to 2034

Table 38: East Asia Market Value (US$ Million) Forecast by Vehicle Type, 2019 to 2034

Table 39: East Asia Market Value (US$ Million) Forecast by Booking Channel, 2019 to 2034

Table 40: East Asia Market Value (US$ Million) Forecast by Tourists Type, 2019 to 2034

Table 41: East Asia Market Value (US$ Million) Forecast by Tour Type, 2019 to 2034

Table 42: East Asia Market Value (US$ Million) Forecast by Age Group, 2019 to 2034

Table 43: Middle East and Africa Market Value (US$ Million) Forecast by Country, 2019 to 2034

Table 44: Middle East and Africa Market Value (US$ Million) Forecast by Vehicle Type, 2019 to 2034

Table 45: Middle East and Africa Market Value (US$ Million) Forecast by Booking Channel, 2019 to 2034

Table 46: Middle East and Africa Market Value (US$ Million) Forecast by Tourists Type, 2019 to 2034

Table 47: Middle East and Africa Market Value (US$ Million) Forecast by Tour Type, 2019 to 2034

Table 48: Middle East and Africa Market Value (US$ Million) Forecast by Age Group, 2019 to 2034


List of Charts

Figure 1: Global Market Value (US$ Million) by Vehicle Type, 2024 to 2034

Figure 2: Global Market Value (US$ Million) by Booking Channel, 2024 to 2034

Figure 3: Global Market Value (US$ Million) by Tourists Type, 2024 to 2034

Figure 4: Global Market Value (US$ Million) by Tour Type, 2024 to 2034

Figure 5: Global Market Value (US$ Million) by Age Group, 2024 to 2034

Figure 6: Global Market Value (US$ Million) by Region, 2024 to 2034

Figure 7: Global Market Value (US$ Million) Analysis by Region, 2019 to 2034

Figure 8: Global Market Value Share (%) and BPS Analysis by Region, 2024 to 2034

Figure 9: Global Market Y-o-Y Growth (%) Projections by Region, 2024 to 2034

Figure 10: Global Market Value (US$ Million) Analysis by Vehicle Type, 2019 to 2034

Figure 11: Global Market Value Share (%) and BPS Analysis by Vehicle Type, 2024 to 2034

Figure 12: Global Market Y-o-Y Growth (%) Projections by Vehicle Type, 2024 to 2034

Figure 13: Global Market Value (US$ Million) Analysis by Booking Channel, 2019 to 2034

Figure 14: Global Market Value Share (%) and BPS Analysis by Booking Channel, 2024 to 2034

Figure 15: Global Market Y-o-Y Growth (%) Projections by Booking Channel, 2024 to 2034

Figure 16: Global Market Value (US$ Million) Analysis by Tourists Type, 2019 to 2034

Figure 17: Global Market Value Share (%) and BPS Analysis by Tourists Type, 2024 to 2034

Figure 18: Global Market Y-o-Y Growth (%) Projections by Tourists Type, 2024 to 2034

Figure 19: Global Market Value (US$ Million) Analysis by Tour Type, 2019 to 2034

Figure 20: Global Market Value Share (%) and BPS Analysis by Tour Type, 2024 to 2034

Figure 21: Global Market Y-o-Y Growth (%) Projections by Tour Type, 2024 to 2034

Figure 22: Global Market Value (US$ Million) Analysis by Age Group, 2019 to 2034

Figure 23: Global Market Value Share (%) and BPS Analysis by Age Group, 2024 to 2034

Figure 24: Global Market Y-o-Y Growth (%) Projections by Age Group, 2024 to 2034

Figure 25: Global Market Attractiveness by Vehicle Type, 2024 to 2034

Figure 26: Global Market Attractiveness by Booking Channel, 2024 to 2034

Figure 27: Global Market Attractiveness by Tourists Type, 2024 to 2034

Figure 28: Global Market Attractiveness by Tour Type, 2024 to 2034

Figure 29: Global Market Attractiveness by Age Group, 2024 to 2034

Figure 30: Global Market Attractiveness by Region, 2024 to 2034

Figure 31: North America Market Value (US$ Million) by Vehicle Type, 2024 to 2034

Figure 32: North America Market Value (US$ Million) by Booking Channel, 2024 to 2034

Figure 33: North America Market Value (US$ Million) by Tourists Type, 2024 to 2034

Figure 34: North America Market Value (US$ Million) by Tour Type, 2024 to 2034

Figure 35: North America Market Value (US$ Million) by Age Group, 2024 to 2034

Figure 36: North America Market Value (US$ Million) by Country, 2024 to 2034

Figure 37: North America Market Value (US$ Million) Analysis by Country, 2019 to 2034

Figure 38: North America Market Value Share (%) and BPS Analysis by Country, 2024 to 2034

Figure 39: North America Market Y-o-Y Growth (%) Projections by Country, 2024 to 2034

Figure 40: North America Market Value (US$ Million) Analysis by Vehicle Type, 2019 to 2034

Figure 41: North America Market Value Share (%) and BPS Analysis by Vehicle Type, 2024 to 2034

Figure 42: North America Market Y-o-Y Growth (%) Projections by Vehicle Type, 2024 to 2034

Figure 43: North America Market Value (US$ Million) Analysis by Booking Channel, 2019 to 2034

Figure 44: North America Market Value Share (%) and BPS Analysis by Booking Channel, 2024 to 2034

Figure 45: North America Market Y-o-Y Growth (%) Projections by Booking Channel, 2024 to 2034

Figure 46: North America Market Value (US$ Million) Analysis by Tourists Type, 2019 to 2034

Figure 47: North America Market Value Share (%) and BPS Analysis by Tourists Type, 2024 to 2034

Figure 48: North America Market Y-o-Y Growth (%) Projections by Tourists Type, 2024 to 2034

Figure 49: North America Market Value (US$ Million) Analysis by Tour Type, 2019 to 2034

Figure 50: North America Market Value Share (%) and BPS Analysis by Tour Type, 2024 to 2034

Figure 51: North America Market Y-o-Y Growth (%) Projections by Tour Type, 2024 to 2034

Figure 52: North America Market Value (US$ Million) Analysis by Age Group, 2019 to 2034

Figure 53: North America Market Value Share (%) and BPS Analysis by Age Group, 2024 to 2034

Figure 54: North America Market Y-o-Y Growth (%) Projections by Age Group, 2024 to 2034

Figure 55: North America Market Attractiveness by Vehicle Type, 2024 to 2034

Figure 56: North America Market Attractiveness by Booking Channel, 2024 to 2034

Figure 57: North America Market Attractiveness by Tourists Type, 2024 to 2034

Figure 58: North America Market Attractiveness by Tour Type, 2024 to 2034

Figure 59: North America Market Attractiveness by Age Group, 2024 to 2034

Figure 60: North America Market Attractiveness by Country, 2024 to 2034

Figure 61: Latin America Market Value (US$ Million) by Vehicle Type, 2024 to 2034

Figure 62: Latin America Market Value (US$ Million) by Booking Channel, 2024 to 2034

Figure 63: Latin America Market Value (US$ Million) by Tourists Type, 2024 to 2034

Figure 64: Latin America Market Value (US$ Million) by Tour Type, 2024 to 2034

Figure 65: Latin America Market Value (US$ Million) by Age Group, 2024 to 2034

Figure 66: Latin America Market Value (US$ Million) by Country, 2024 to 2034

Figure 67: Latin America Market Value (US$ Million) Analysis by Country, 2019 to 2034

Figure 68: Latin America Market Value Share (%) and BPS Analysis by Country, 2024 to 2034

Figure 69: Latin America Market Y-o-Y Growth (%) Projections by Country, 2024 to 2034

Figure 70: Latin America Market Value (US$ Million) Analysis by Vehicle Type, 2019 to 2034

Figure 71: Latin America Market Value Share (%) and BPS Analysis by Vehicle Type, 2024 to 2034

Figure 72: Latin America Market Y-o-Y Growth (%) Projections by Vehicle Type, 2024 to 2034

Figure 73: Latin America Market Value (US$ Million) Analysis by Booking Channel, 2019 to 2034

Figure 74: Latin America Market Value Share (%) and BPS Analysis by Booking Channel, 2024 to 2034

Figure 75: Latin America Market Y-o-Y Growth (%) Projections by Booking Channel, 2024 to 2034

Figure 76: Latin America Market Value (US$ Million) Analysis by Tourists Type, 2019 to 2034

Figure 77: Latin America Market Value Share (%) and BPS Analysis by Tourists Type, 2024 to 2034

Figure 78: Latin America Market Y-o-Y Growth (%) Projections by Tourists Type, 2024 to 2034

Figure 79: Latin America Market Value (US$ Million) Analysis by Tour Type, 2019 to 2034

Figure 80: Latin America Market Value Share (%) and BPS Analysis by Tour Type, 2024 to 2034

Figure 81: Latin America Market Y-o-Y Growth (%) Projections by Tour Type, 2024 to 2034

Figure 82: Latin America Market Value (US$ Million) Analysis by Age Group, 2019 to 2034

Figure 83: Latin America Market Value Share (%) and BPS Analysis by Age Group, 2024 to 2034

Figure 84: Latin America Market Y-o-Y Growth (%) Projections by Age Group, 2024 to 2034

Figure 85: Latin America Market Attractiveness by Vehicle Type, 2024 to 2034

Figure 86: Latin America Market Attractiveness by Booking Channel, 2024 to 2034

Figure 87: Latin America Market Attractiveness by Tourists Type, 2024 to 2034

Figure 88: Latin America Market Attractiveness by Tour Type, 2024 to 2034

Figure 89: Latin America Market Attractiveness by Age Group, 2024 to 2034

Figure 90: Latin America Market Attractiveness by Country, 2024 to 2034

Figure 91: Western Europe Market Value (US$ Million) by Vehicle Type, 2024 to 2034

Figure 92: Western Europe Market Value (US$ Million) by Booking Channel, 2024 to 2034

Figure 93: Western Europe Market Value (US$ Million) by Tourists Type, 2024 to 2034

Figure 94: Western Europe Market Value (US$ Million) by Tour Type, 2024 to 2034

Figure 95: Western Europe Market Value (US$ Million) by Age Group, 2024 to 2034

Figure 96: Western Europe Market Value (US$ Million) by Country, 2024 to 2034

Figure 97: Western Europe Market Value (US$ Million) Analysis by Country, 2019 to 2034

Figure 98: Western Europe Market Value Share (%) and BPS Analysis by Country, 2024 to 2034

Figure 99: Western Europe Market Y-o-Y Growth (%) Projections by Country, 2024 to 2034

Figure 100: Western Europe Market Value (US$ Million) Analysis by Vehicle Type, 2019 to 2034

Figure 101: Western Europe Market Value Share (%) and BPS Analysis by Vehicle Type, 2024 to 2034

Figure 102: Western Europe Market Y-o-Y Growth (%) Projections by Vehicle Type, 2024 to 2034

Figure 103: Western Europe Market Value (US$ Million) Analysis by Booking Channel, 2019 to 2034

Figure 104: Western Europe Market Value Share (%) and BPS Analysis by Booking Channel, 2024 to 2034

Figure 105: Western Europe Market Y-o-Y Growth (%) Projections by Booking Channel, 2024 to 2034

Figure 106: Western Europe Market Value (US$ Million) Analysis by Tourists Type, 2019 to 2034

Figure 107: Western Europe Market Value Share (%) and BPS Analysis by Tourists Type, 2024 to 2034

Figure 108: Western Europe Market Y-o-Y Growth (%) Projections by Tourists Type, 2024 to 2034

Figure 109: Western Europe Market Value (US$ Million) Analysis by Tour Type, 2019 to 2034

Figure 110: Western Europe Market Value Share (%) and BPS Analysis by Tour Type, 2024 to 2034

Figure 111: Western Europe Market Y-o-Y Growth (%) Projections by Tour Type, 2024 to 2034

Figure 112: Western Europe Market Value (US$ Million) Analysis by Age Group, 2019 to 2034

Figure 113: Western Europe Market Value Share (%) and BPS Analysis by Age Group, 2024 to 2034

Figure 114: Western Europe Market Y-o-Y Growth (%) Projections by Age Group, 2024 to 2034

Figure 115: Western Europe Market Attractiveness by Vehicle Type, 2024 to 2034

Figure 116: Western Europe Market Attractiveness by Booking Channel, 2024 to 2034

Figure 117: Western Europe Market Attractiveness by Tourists Type, 2024 to 2034

Figure 118: Western Europe Market Attractiveness by Tour Type, 2024 to 2034

Figure 119: Western Europe Market Attractiveness by Age Group, 2024 to 2034

Figure 120: Western Europe Market Attractiveness by Country, 2024 to 2034

Figure 121: Eastern Europe Market Value (US$ Million) by Vehicle Type, 2024 to 2034

Figure 122: Eastern Europe Market Value (US$ Million) by Booking Channel, 2024 to 2034

Figure 123: Eastern Europe Market Value (US$ Million) by Tourists Type, 2024 to 2034

Figure 124: Eastern Europe Market Value (US$ Million) by Tour Type, 2024 to 2034

Figure 125: Eastern Europe Market Value (US$ Million) by Age Group, 2024 to 2034

Figure 126: Eastern Europe Market Value (US$ Million) by Country, 2024 to 2034

Figure 127: Eastern Europe Market Value (US$ Million) Analysis by Country, 2019 to 2034

Figure 128: Eastern Europe Market Value Share (%) and BPS Analysis by Country, 2024 to 2034

Figure 129: Eastern Europe Market Y-o-Y Growth (%) Projections by Country, 2024 to 2034

Figure 130: Eastern Europe Market Value (US$ Million) Analysis by Vehicle Type, 2019 to 2034

Figure 131: Eastern Europe Market Value Share (%) and BPS Analysis by Vehicle Type, 2024 to 2034

Figure 132: Eastern Europe Market Y-o-Y Growth (%) Projections by Vehicle Type, 2024 to 2034

Figure 133: Eastern Europe Market Value (US$ Million) Analysis by Booking Channel, 2019 to 2034

Figure 134: Eastern Europe Market Value Share (%) and BPS Analysis by Booking Channel, 2024 to 2034

Figure 135: Eastern Europe Market Y-o-Y Growth (%) Projections by Booking Channel, 2024 to 2034

Figure 136: Eastern Europe Market Value (US$ Million) Analysis by Tourists Type, 2019 to 2034

Figure 137: Eastern Europe Market Value Share (%) and BPS Analysis by Tourists Type, 2024 to 2034

Figure 138: Eastern Europe Market Y-o-Y Growth (%) Projections by Tourists Type, 2024 to 2034

Figure 139: Eastern Europe Market Value (US$ Million) Analysis by Tour Type, 2019 to 2034

Figure 140: Eastern Europe Market Value Share (%) and BPS Analysis by Tour Type, 2024 to 2034

Figure 141: Eastern Europe Market Y-o-Y Growth (%) Projections by Tour Type, 2024 to 2034

Figure 142: Eastern Europe Market Value (US$ Million) Analysis by Age Group, 2019 to 2034

Figure 143: Eastern Europe Market Value Share (%) and BPS Analysis by Age Group, 2024 to 2034

Figure 144: Eastern Europe Market Y-o-Y Growth (%) Projections by Age Group, 2024 to 2034

Figure 145: Eastern Europe Market Attractiveness by Vehicle Type, 2024 to 2034

Figure 146: Eastern Europe Market Attractiveness by Booking Channel, 2024 to 2034

Figure 147: Eastern Europe Market Attractiveness by Tourists Type, 2024 to 2034

Figure 148: Eastern Europe Market Attractiveness by Tour Type, 2024 to 2034

Figure 149: Eastern Europe Market Attractiveness by Age Group, 2024 to 2034

Figure 150: Eastern Europe Market Attractiveness by Country, 2024 to 2034

Figure 151: South Asia and Pacific Market Value (US$ Million) by Vehicle Type, 2024 to 2034

Figure 152: South Asia and Pacific Market Value (US$ Million) by Booking Channel, 2024 to 2034

Figure 153: South Asia and Pacific Market Value (US$ Million) by Tourists Type, 2024 to 2034

Figure 154: South Asia and Pacific Market Value (US$ Million) by Tour Type, 2024 to 2034

Figure 155: South Asia and Pacific Market Value (US$ Million) by Age Group, 2024 to 2034

Figure 156: South Asia and Pacific Market Value (US$ Million) by Country, 2024 to 2034

Figure 157: South Asia and Pacific Market Value (US$ Million) Analysis by Country, 2019 to 2034

Figure 158: South Asia and Pacific Market Value Share (%) and BPS Analysis by Country, 2024 to 2034

Figure 159: South Asia and Pacific Market Y-o-Y Growth (%) Projections by Country, 2024 to 2034

Figure 160: South Asia and Pacific Market Value (US$ Million) Analysis by Vehicle Type, 2019 to 2034

Figure 161: South Asia and Pacific Market Value Share (%) and BPS Analysis by Vehicle Type, 2024 to 2034

Figure 162: South Asia and Pacific Market Y-o-Y Growth (%) Projections by Vehicle Type, 2024 to 2034

Figure 163: South Asia and Pacific Market Value (US$ Million) Analysis by Booking Channel, 2019 to 2034

Figure 164: South Asia and Pacific Market Value Share (%) and BPS Analysis by Booking Channel, 2024 to 2034

Figure 165: South Asia and Pacific Market Y-o-Y Growth (%) Projections by Booking Channel, 2024 to 2034

Figure 166: South Asia and Pacific Market Value (US$ Million) Analysis by Tourists Type, 2019 to 2034

Figure 167: South Asia and Pacific Market Value Share (%) and BPS Analysis by Tourists Type, 2024 to 2034

Figure 168: South Asia and Pacific Market Y-o-Y Growth (%) Projections by Tourists Type, 2024 to 2034

Figure 169: South Asia and Pacific Market Value (US$ Million) Analysis by Tour Type, 2019 to 2034

Figure 170: South Asia and Pacific Market Value Share (%) and BPS Analysis by Tour Type, 2024 to 2034

Figure 171: South Asia and Pacific Market Y-o-Y Growth (%) Projections by Tour Type, 2024 to 2034

Figure 172: South Asia and Pacific Market Value (US$ Million) Analysis by Age Group, 2019 to 2034

Figure 173: South Asia and Pacific Market Value Share (%) and BPS Analysis by Age Group, 2024 to 2034

Figure 174: South Asia and Pacific Market Y-o-Y Growth (%) Projections by Age Group, 2024 to 2034

Figure 175: South Asia and Pacific Market Attractiveness by Vehicle Type, 2024 to 2034

Figure 176: South Asia and Pacific Market Attractiveness by Booking Channel, 2024 to 2034

Figure 177: South Asia and Pacific Market Attractiveness by Tourists Type, 2024 to 2034

Figure 178: South Asia and Pacific Market Attractiveness by Tour Type, 2024 to 2034

Figure 179: South Asia and Pacific Market Attractiveness by Age Group, 2024 to 2034

Figure 180: South Asia and Pacific Market Attractiveness by Country, 2024 to 2034

Figure 181: East Asia Market Value (US$ Million) by Vehicle Type, 2024 to 2034

Figure 182: East Asia Market Value (US$ Million) by Booking Channel, 2024 to 2034

Figure 183: East Asia Market Value (US$ Million) by Tourists Type, 2024 to 2034

Figure 184: East Asia Market Value (US$ Million) by Tour Type, 2024 to 2034

Figure 185: East Asia Market Value (US$ Million) by Age Group, 2024 to 2034

Figure 186: East Asia Market Value (US$ Million) by Country, 2024 to 2034

Figure 187: East Asia Market Value (US$ Million) Analysis by Country, 2019 to 2034

Figure 188: East Asia Market Value Share (%) and BPS Analysis by Country, 2024 to 2034

Figure 189: East Asia Market Y-o-Y Growth (%) Projections by Country, 2024 to 2034

Figure 190: East Asia Market Value (US$ Million) Analysis by Vehicle Type, 2019 to 2034

Figure 191: East Asia Market Value Share (%) and BPS Analysis by Vehicle Type, 2024 to 2034

Figure 192: East Asia Market Y-o-Y Growth (%) Projections by Vehicle Type, 2024 to 2034

Figure 193: East Asia Market Value (US$ Million) Analysis by Booking Channel, 2019 to 2034

Figure 194: East Asia Market Value Share (%) and BPS Analysis by Booking Channel, 2024 to 2034

Figure 195: East Asia Market Y-o-Y Growth (%) Projections by Booking Channel, 2024 to 2034

Figure 196: East Asia Market Value (US$ Million) Analysis by Tourists Type, 2019 to 2034

Figure 197: East Asia Market Value Share (%) and BPS Analysis by Tourists Type, 2024 to 2034

Figure 198: East Asia Market Y-o-Y Growth (%) Projections by Tourists Type, 2024 to 2034

Figure 199: East Asia Market Value (US$ Million) Analysis by Tour Type, 2019 to 2034

Figure 200: East Asia Market Value Share (%) and BPS Analysis by Tour Type, 2024 to 2034

Figure 201: East Asia Market Y-o-Y Growth (%) Projections by Tour Type, 2024 to 2034

Figure 202: East Asia Market Value (US$ Million) Analysis by Age Group, 2019 to 2034

Figure 203: East Asia Market Value Share (%) and BPS Analysis by Age Group, 2024 to 2034

Figure 204: East Asia Market Y-o-Y Growth (%) Projections by Age Group, 2024 to 2034

Figure 205: East Asia Market Attractiveness by Vehicle Type, 2024 to 2034

Figure 206: East Asia Market Attractiveness by Booking Channel, 2024 to 2034

Figure 207: East Asia Market Attractiveness by Tourists Type, 2024 to 2034

Figure 208: East Asia Market Attractiveness by Tour Type, 2024 to 2034

Figure 209: East Asia Market Attractiveness by Age Group, 2024 to 2034

Figure 210: East Asia Market Attractiveness by Country, 2024 to 2034

Figure 211: Middle East and Africa Market Value (US$ Million) by Vehicle Type, 2024 to 2034

Figure 212: Middle East and Africa Market Value (US$ Million) by Booking Channel, 2024 to 2034

Figure 213: Middle East and Africa Market Value (US$ Million) by Tourists Type, 2024 to 2034

Figure 214: Middle East and Africa Market Value (US$ Million) by Tour Type, 2024 to 2034

Figure 215: Middle East and Africa Market Value (US$ Million) by Age Group, 2024 to 2034

Figure 216: Middle East and Africa Market Value (US$ Million) by Country, 2024 to 2034

Figure 217: Middle East and Africa Market Value (US$ Million) Analysis by Country, 2019 to 2034

Figure 218: Middle East and Africa Market Value Share (%) and BPS Analysis by Country, 2024 to 2034

Figure 219: Middle East and Africa Market Y-o-Y Growth (%) Projections by Country, 2024 to 2034

Figure 220: Middle East and Africa Market Value (US$ Million) Analysis by Vehicle Type, 2019 to 2034

Figure 221: Middle East and Africa Market Value Share (%) and BPS Analysis by Vehicle Type, 2024 to 2034

Figure 222: Middle East and Africa Market Y-o-Y Growth (%) Projections by Vehicle Type, 2024 to 2034

Figure 223: Middle East and Africa Market Value (US$ Million) Analysis by Booking Channel, 2019 to 2034

Figure 224: Middle East and Africa Market Value Share (%) and BPS Analysis by Booking Channel, 2024 to 2034

Figure 225: Middle East and Africa Market Y-o-Y Growth (%) Projections by Booking Channel, 2024 to 2034

Figure 226: Middle East and Africa Market Value (US$ Million) Analysis by Tourists Type, 2019 to 2034

Figure 227: Middle East and Africa Market Value Share (%) and BPS Analysis by Tourists Type, 2024 to 2034

Figure 228: Middle East and Africa Market Y-o-Y Growth (%) Projections by Tourists Type, 2024 to 2034

Figure 229: Middle East and Africa Market Value (US$ Million) Analysis by Tour Type, 2019 to 2034

Figure 230: Middle East and Africa Market Value Share (%) and BPS Analysis by Tour Type, 2024 to 2034

Figure 231: Middle East and Africa Market Y-o-Y Growth (%) Projections by Tour Type, 2024 to 2034

Figure 232: Middle East and Africa Market Value (US$ Million) Analysis by Age Group, 2019 to 2034

Figure 233: Middle East and Africa Market Value Share (%) and BPS Analysis by Age Group, 2024 to 2034

Figure 234: Middle East and Africa Market Y-o-Y Growth (%) Projections by Age Group, 2024 to 2034

Figure 235: Middle East and Africa Market Attractiveness by Vehicle Type, 2024 to 2034

Figure 236: Middle East and Africa Market Attractiveness by Booking Channel, 2024 to 2034

Figure 237: Middle East and Africa Market Attractiveness by Tourists Type, 2024 to 2034

Figure 238: Middle East and Africa Market Attractiveness by Tour Type, 2024 to 2034

Figure 239: Middle East and Africa Market Attractiveness by Age Group, 2024 to 2034

Figure 240: Middle East and Africa Market Attractiveness by Country, 2024 to 2034

Recommendations

Travel and Tourism

Luxury Hotel Market

Published : July 2023

Travel and Tourism

United States Boutique Hotel Market

Published : June 2023

Travel and Tourism

Micro Hotel Market

Published : October 2022

Travel and Tourism

Pop-up Hotels Market

Published : October 2022

Explore Travel and Tourism Insights

View Reports