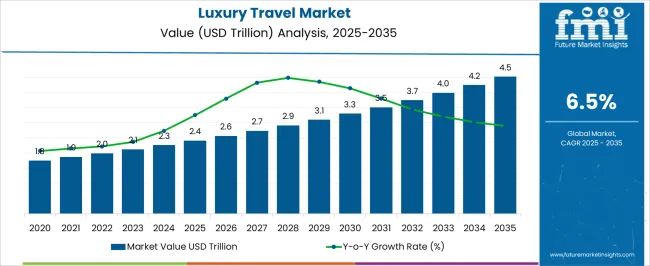
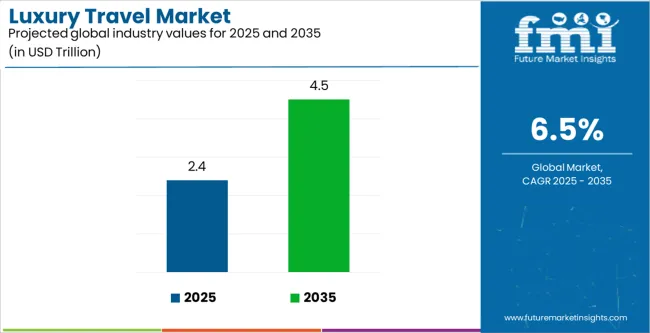
Embark on a journey through the opulent realm of luxury travel, where every experience is a masterpiece crafted to indulge the senses. Future Market Insights presents an alluring forecast. In 2024, the current valuation of the market is USD 2.26 trillion. By 2034, this market is forecasted to burgeon into a blazing inferno, with a valuation of USD 4.24 trillion, fostering a moderate CAGR of 6.5%.
Attributes | Details |
---|---|
Market Value for 2024 | USD 2.26 trillion |
Market Value for 2034 | USD 4.24 trillion |
Market Forecast CAGR for 2024 to 2034 | 6.5% |
Historical CAGR | 5.80% |
---|---|
Forecast CAGR | 6.50% |
The historical CAGR of the luxury travel market stands at 5.80%, reflecting steady expansion propelled by the allure of bespoke experiences and unparalleled indulgence.
From exclusive retreats to tailor-made adventures, the market has evolved to cater to the discerning tastes of affluent travelers seeking nothing short of perfection.
The forecasted CAGR of 6.50% paints a picture of continued growth and prosperity in the luxury travel sector. As consumer expectations evolve and demand for immersive, authentic experiences surges, the market is thus poised for further expansion.
With a blend of tradition and innovation, luxury travel providers are primed to unlock new vistas of luxury, captivating travelers with unforgettable journeys and elevating the art of travel to new heights of sophistication and indulgence.
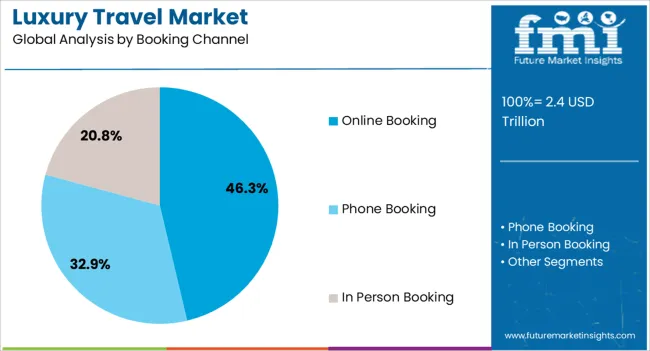
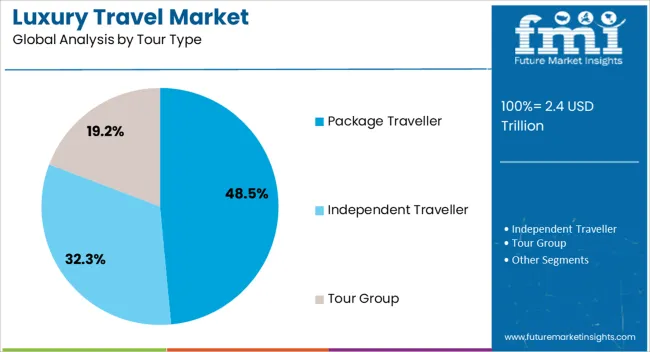
The below section shows the leading segment. Based on booking channel, the online booking segment is accounted to hold a market share of 46.3% in 2024. Based on tour type, the package traveler segment is accounted to hold a market share of 48.5% in 2024.
Category | Market Share in 2024 |
---|---|
Online Booking | 46.3% |
Package Traveler | 48.5% |
Based on booking channel, the online booking segment stands out, capturing a significant market share of 46.3%. The trend reflects the boom in preference among luxury travelers for the convenience and accessibility offered by online platforms when planning and booking their upscale experiences.
From personalized itineraries to seamless transactions, online booking channels cater to the advancing needs of affluent travelers, propelling their popularity in the luxury travel market.
Based on tour type, the package traveler segment is accounted to hold a market share of 48.5% in 2024. Packaged tours provide a hassle-free and curated experience, offering a blend of exclusive amenities, cultural immersion, and expert guidance.
As luxury travelers continue to seek curated experiences without compromising on comfort and exclusivity, the package traveler segment maintains its stronghold in the dynamic landscape of luxury travel.
The table describes the top five countries ranked by revenue, with Australia holding the top position. Australia dominates the luxury travel market with its natural beauty, diverse landscapes, and unique experiences.
Affluent travelers indulge in luxury vacations for iconic destinations like the Great Barrier Reef and luxury eco-lodges, essaying the temptation as a premier luxury travel destination.
Forecast CAGRs from 2024 to 2034
Countries | CAGR |
---|---|
United States | 7.3% |
Germany | 7.5% |
China | 6.9% |
India | 7.9% |
Australia | 8.1% |
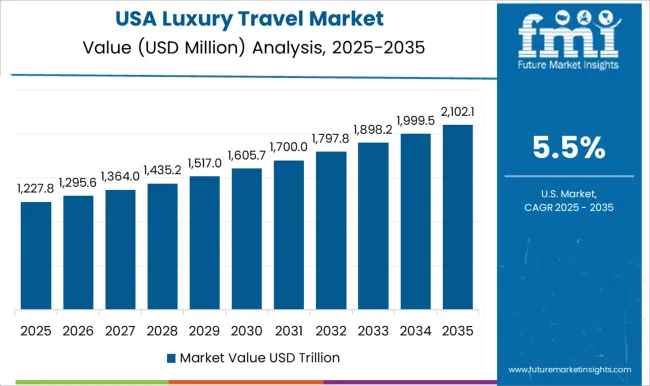
In the United States, the luxury travel market is predominantly utilized for a variety of purposes, including leisure travel, business travel, and special occasions such as weddings and milestone celebrations.
The United States boasts a vibrant luxury travel market catering to discerning travelers seeking unique experiences, from luxury wilderness retreats in national parks to opulent urban escapes in cosmopolitan cities like New York and Los Angeles.
In Germany, the luxury travel market is utilized by affluent travelers seeking refined and sophisticated travel experiences both domestically and internationally. German travelers often indulge in luxury vacations to iconic destinations such as the French Riviera, the Italian countryside, or exotic tropical islands.
The affluent business community often utilizes luxury travel services for corporate events, incentive trips, and executive retreats, reflecting the demand for exclusive and tailored travel experiences.
In China, the luxury travel market is primarily utilized by affluent travelers seeking prestigious and extravagant travel experiences both domestically and abroad. Luxury travelers often seek high-end accommodations, private tours, and VIP services that showcase luxury and exclusivity.
Luxury travel services are frequently utilized by the business elites of China for corporate meetings, luxury events, and incentive travel programs, reflecting the country's growing affluence and sophistication in luxury travel preferences.
Rising affluence, a burgeoning middle class, and a desire for unique experiences fuel the luxury travel market in India.
Affluent Indian travelers are seeking personalized and immersive experiences both domestically and internationally, driving demand for luxury accommodations, boutique hotels, and experiential stays.
In Australia, the luxury travel market is utilized by affluent travelers seeking unique and exclusive travel experiences that showcase the natural beauty and cultural heritage of the country.
Luxury travel experiences in Australia often emphasize outdoor adventures, wildlife encounters, and luxury eco-lodges that offer sustainable and immersive experiences in nature.
Luxury travel services are utilized by business elites of Australia for corporate retreats, luxury events, and incentive travel programs, reflecting the affluent and adventurous travel preferences of the country.
In the competitive landscape of the luxury travel market, a blend of established players and boutique providers vie for affluent travelers' attention. Boutique operators specializing in niche segments like adventure travel or wellness retreats carve out their niche.
Differentiation through unique experiences, personalized service, and exclusive access to hidden gems defines success in this dynamic and discerning market. Some of the key developments are:
Attributes | Details |
---|---|
Estimated Market Size in 2024 | USD 2.26 trillion |
Projected Market Valuation in 2034 | USD 4.24 trillion |
Value-based CAGR 2024 to 2034 | 6.5% |
Forecast Period | 2024 to 2034 |
Historical Data Available for | 2019 to 2023 |
Market Analysis | Value in USD trillion |
Key Regions Covered |
North America; Latin America; Western Europe; Eastern Europe; South Asia and Pacific; East Asia; Middle East and Africa |
Key Market Segments Covered |
Mode of Transportation, Booking Channel, Tourist Type, Tour Type, Consumer Orientation, Age Group, Region |
Key Countries Profiled |
The United States, Canada, Brazil, Mexico, Germany, The United Kingdom, France, Spain, Italy, Russia, Poland, Czech Republic, Romania, India, Bangladesh, Australia, New Zealand, China, Japan, South Korea, GCC countries, South Africa, Israel |
Key Companies Profiled |
TU Elite; TCS World Travel; Abercrombie & Kent USA; TUI Group; Micato Safaris; Butterfield & Robinson Inc.; Scott Dunn Ltd.; Cox & Kings Ltd.; Exodus travels; Lindblad Expeditions. |
Table 1: Global Market Value (US$ Million) Forecast by Region, 2019 to 2034
Table 2: Global Market Value (US$ Million) Forecast by Mode of Transportation Type, 2019 to 2034
Table 3: Global Market Value (US$ Million) Forecast by Booking Channel, 2019 to 2034
Table 4: Global Market Value (US$ Million) Forecast by Tourist Type, 2019 to 2034
Table 5: Global Market Value (US$ Million) Forecast by Tour Type, 2019 to 2034
Table 6: Global Market Value (US$ Million) Forecast by Consumer Orientation, 2019 to 2034
Table 7: Global Market Value (US$ Million) Forecast by Age Group, 2019 to 2034
Table 8: North America Market Value (US$ Million) Forecast by Country, 2019 to 2034
Table 9: North America Market Value (US$ Million) Forecast by Mode of Transportation Type, 2019 to 2034
Table 10: North America Market Value (US$ Million) Forecast by Booking Channel, 2019 to 2034
Table 11: North America Market Value (US$ Million) Forecast by Tourist Type, 2019 to 2034
Table 12: North America Market Value (US$ Million) Forecast by Tour Type, 2019 to 2034
Table 13: North America Market Value (US$ Million) Forecast by Consumer Orientation, 2019 to 2034
Table 14: North America Market Value (US$ Million) Forecast by Age Group, 2019 to 2034
Table 15: Latin America Market Value (US$ Million) Forecast by Country, 2019 to 2034
Table 16: Latin America Market Value (US$ Million) Forecast by Mode of Transportation Type, 2019 to 2034
Table 17: Latin America Market Value (US$ Million) Forecast by Booking Channel, 2019 to 2034
Table 18: Latin America Market Value (US$ Million) Forecast by Tourist Type, 2019 to 2034
Table 19: Latin America Market Value (US$ Million) Forecast by Tour Type, 2019 to 2034
Table 20: Latin America Market Value (US$ Million) Forecast by Consumer Orientation, 2019 to 2034
Table 21: Latin America Market Value (US$ Million) Forecast by Age Group, 2019 to 2034
Table 22: Western Europe Market Value (US$ Million) Forecast by Country, 2019 to 2034
Table 23: Western Europe Market Value (US$ Million) Forecast by Mode of Transportation Type, 2019 to 2034
Table 24: Western Europe Market Value (US$ Million) Forecast by Booking Channel, 2019 to 2034
Table 25: Western Europe Market Value (US$ Million) Forecast by Tourist Type, 2019 to 2034
Table 26: Western Europe Market Value (US$ Million) Forecast by Tour Type, 2019 to 2034
Table 27: Western Europe Market Value (US$ Million) Forecast by Consumer Orientation, 2019 to 2034
Table 28: Western Europe Market Value (US$ Million) Forecast by Age Group, 2019 to 2034
Table 29: Eastern Europe Market Value (US$ Million) Forecast by Country, 2019 to 2034
Table 30: Eastern Europe Market Value (US$ Million) Forecast by Mode of Transportation Type, 2019 to 2034
Table 31: Eastern Europe Market Value (US$ Million) Forecast by Booking Channel, 2019 to 2034
Table 32: Eastern Europe Market Value (US$ Million) Forecast by Tourist Type, 2019 to 2034
Table 33: Eastern Europe Market Value (US$ Million) Forecast by Tour Type, 2019 to 2034
Table 34: Eastern Europe Market Value (US$ Million) Forecast by Consumer Orientation, 2019 to 2034
Table 35: Eastern Europe Market Value (US$ Million) Forecast by Age Group, 2019 to 2034
Table 36: South Asia and Pacific Market Value (US$ Million) Forecast by Country, 2019 to 2034
Table 37: South Asia and Pacific Market Value (US$ Million) Forecast by Mode of Transportation Type, 2019 to 2034
Table 38: South Asia and Pacific Market Value (US$ Million) Forecast by Booking Channel, 2019 to 2034
Table 39: South Asia and Pacific Market Value (US$ Million) Forecast by Tourist Type, 2019 to 2034
Table 40: South Asia and Pacific Market Value (US$ Million) Forecast by Tour Type, 2019 to 2034
Table 41: South Asia and Pacific Market Value (US$ Million) Forecast by Consumer Orientation, 2019 to 2034
Table 42: South Asia and Pacific Market Value (US$ Million) Forecast by Age Group, 2019 to 2034
Table 43: East Asia Market Value (US$ Million) Forecast by Country, 2019 to 2034
Table 44: East Asia Market Value (US$ Million) Forecast by Mode of Transportation Type, 2019 to 2034
Table 45: East Asia Market Value (US$ Million) Forecast by Booking Channel, 2019 to 2034
Table 46: East Asia Market Value (US$ Million) Forecast by Tourist Type, 2019 to 2034
Table 47: East Asia Market Value (US$ Million) Forecast by Tour Type, 2019 to 2034
Table 48: East Asia Market Value (US$ Million) Forecast by Consumer Orientation, 2019 to 2034
Table 49: East Asia Market Value (US$ Million) Forecast by Age Group, 2019 to 2034
Table 50: Middle East and Africa Market Value (US$ Million) Forecast by Country, 2019 to 2034
Table 51: Middle East and Africa Market Value (US$ Million) Forecast by Mode of Transportation Type, 2019 to 2034
Table 52: Middle East and Africa Market Value (US$ Million) Forecast by Booking Channel, 2019 to 2034
Table 53: Middle East and Africa Market Value (US$ Million) Forecast by Tourist Type, 2019 to 2034
Table 54: Middle East and Africa Market Value (US$ Million) Forecast by Tour Type, 2019 to 2034
Table 55: Middle East and Africa Market Value (US$ Million) Forecast by Consumer Orientation, 2019 to 2034
Table 56: Middle East and Africa Market Value (US$ Million) Forecast by Age Group, 2019 to 2034
Figure 1: Global Market Value (US$ Million) by Mode of Transportation Type, 2024 to 2034
Figure 2: Global Market Value (US$ Million) by Booking Channel, 2024 to 2034
Figure 3: Global Market Value (US$ Million) by Tourist Type, 2024 to 2034
Figure 4: Global Market Value (US$ Million) by Tour Type, 2024 to 2034
Figure 5: Global Market Value (US$ Million) by Consumer Orientation, 2024 to 2034
Figure 6: Global Market Value (US$ Million) by Age Group, 2024 to 2034
Figure 7: Global Market Value (US$ Million) by Region, 2024 to 2034
Figure 8: Global Market Value (US$ Million) Analysis by Region, 2019 to 2034
Figure 9: Global Market Value Share (%) and BPS Analysis by Region, 2024 to 2034
Figure 10: Global Market Y-o-Y Growth (%) Projections by Region, 2024 to 2034
Figure 11: Global Market Value (US$ Million) Analysis by Mode of Transportation Type, 2019 to 2034
Figure 12: Global Market Value Share (%) and BPS Analysis by Mode of Transportation Type, 2024 to 2034
Figure 13: Global Market Y-o-Y Growth (%) Projections by Mode of Transportation Type, 2024 to 2034
Figure 14: Global Market Value (US$ Million) Analysis by Booking Channel, 2019 to 2034
Figure 15: Global Market Value Share (%) and BPS Analysis by Booking Channel, 2024 to 2034
Figure 16: Global Market Y-o-Y Growth (%) Projections by Booking Channel, 2024 to 2034
Figure 17: Global Market Value (US$ Million) Analysis by Tourist Type, 2019 to 2034
Figure 18: Global Market Value Share (%) and BPS Analysis by Tourist Type, 2024 to 2034
Figure 19: Global Market Y-o-Y Growth (%) Projections by Tourist Type, 2024 to 2034
Figure 20: Global Market Value (US$ Million) Analysis by Tour Type, 2019 to 2034
Figure 21: Global Market Value Share (%) and BPS Analysis by Tour Type, 2024 to 2034
Figure 22: Global Market Y-o-Y Growth (%) Projections by Tour Type, 2024 to 2034
Figure 23: Global Market Value (US$ Million) Analysis by Consumer Orientation, 2019 to 2034
Figure 24: Global Market Value Share (%) and BPS Analysis by Consumer Orientation, 2024 to 2034
Figure 25: Global Market Y-o-Y Growth (%) Projections by Consumer Orientation, 2024 to 2034
Figure 26: Global Market Value (US$ Million) Analysis by Age Group, 2019 to 2034
Figure 27: Global Market Value Share (%) and BPS Analysis by Age Group, 2024 to 2034
Figure 28: Global Market Y-o-Y Growth (%) Projections by Age Group, 2024 to 2034
Figure 29: Global Market Attractiveness by Mode of Transportation Type, 2024 to 2034
Figure 30: Global Market Attractiveness by Booking Channel, 2024 to 2034
Figure 31: Global Market Attractiveness by Tourist Type, 2024 to 2034
Figure 32: Global Market Attractiveness by Tour Type, 2024 to 2034
Figure 33: Global Market Attractiveness by Consumer Orientation, 2024 to 2034
Figure 34: Global Market Attractiveness by Age Group, 2024 to 2034
Figure 35: Global Market Attractiveness by Region, 2024 to 2034
Figure 36: North America Market Value (US$ Million) by Mode of Transportation Type, 2024 to 2034
Figure 37: North America Market Value (US$ Million) by Booking Channel, 2024 to 2034
Figure 38: North America Market Value (US$ Million) by Tourist Type, 2024 to 2034
Figure 39: North America Market Value (US$ Million) by Tour Type, 2024 to 2034
Figure 40: North America Market Value (US$ Million) by Consumer Orientation, 2024 to 2034
Figure 41: North America Market Value (US$ Million) by Age Group, 2024 to 2034
Figure 42: North America Market Value (US$ Million) by Country, 2024 to 2034
Figure 43: North America Market Value (US$ Million) Analysis by Country, 2019 to 2034
Figure 44: North America Market Value Share (%) and BPS Analysis by Country, 2024 to 2034
Figure 45: North America Market Y-o-Y Growth (%) Projections by Country, 2024 to 2034
Figure 46: North America Market Value (US$ Million) Analysis by Mode of Transportation Type, 2019 to 2034
Figure 47: North America Market Value Share (%) and BPS Analysis by Mode of Transportation Type, 2024 to 2034
Figure 48: North America Market Y-o-Y Growth (%) Projections by Mode of Transportation Type, 2024 to 2034
Figure 49: North America Market Value (US$ Million) Analysis by Booking Channel, 2019 to 2034
Figure 50: North America Market Value Share (%) and BPS Analysis by Booking Channel, 2024 to 2034
Figure 51: North America Market Y-o-Y Growth (%) Projections by Booking Channel, 2024 to 2034
Figure 52: North America Market Value (US$ Million) Analysis by Tourist Type, 2019 to 2034
Figure 53: North America Market Value Share (%) and BPS Analysis by Tourist Type, 2024 to 2034
Figure 54: North America Market Y-o-Y Growth (%) Projections by Tourist Type, 2024 to 2034
Figure 55: North America Market Value (US$ Million) Analysis by Tour Type, 2019 to 2034
Figure 56: North America Market Value Share (%) and BPS Analysis by Tour Type, 2024 to 2034
Figure 57: North America Market Y-o-Y Growth (%) Projections by Tour Type, 2024 to 2034
Figure 58: North America Market Value (US$ Million) Analysis by Consumer Orientation, 2019 to 2034
Figure 59: North America Market Value Share (%) and BPS Analysis by Consumer Orientation, 2024 to 2034
Figure 60: North America Market Y-o-Y Growth (%) Projections by Consumer Orientation, 2024 to 2034
Figure 61: North America Market Value (US$ Million) Analysis by Age Group, 2019 to 2034
Figure 62: North America Market Value Share (%) and BPS Analysis by Age Group, 2024 to 2034
Figure 63: North America Market Y-o-Y Growth (%) Projections by Age Group, 2024 to 2034
Figure 64: North America Market Attractiveness by Mode of Transportation Type, 2024 to 2034
Figure 65: North America Market Attractiveness by Booking Channel, 2024 to 2034
Figure 66: North America Market Attractiveness by Tourist Type, 2024 to 2034
Figure 67: North America Market Attractiveness by Tour Type, 2024 to 2034
Figure 68: North America Market Attractiveness by Consumer Orientation, 2024 to 2034
Figure 69: North America Market Attractiveness by Age Group, 2024 to 2034
Figure 70: North America Market Attractiveness by Country, 2024 to 2034
Figure 71: Latin America Market Value (US$ Million) by Mode of Transportation Type, 2024 to 2034
Figure 72: Latin America Market Value (US$ Million) by Booking Channel, 2024 to 2034
Figure 73: Latin America Market Value (US$ Million) by Tourist Type, 2024 to 2034
Figure 74: Latin America Market Value (US$ Million) by Tour Type, 2024 to 2034
Figure 75: Latin America Market Value (US$ Million) by Consumer Orientation, 2024 to 2034
Figure 76: Latin America Market Value (US$ Million) by Age Group, 2024 to 2034
Figure 77: Latin America Market Value (US$ Million) by Country, 2024 to 2034
Figure 78: Latin America Market Value (US$ Million) Analysis by Country, 2019 to 2034
Figure 79: Latin America Market Value Share (%) and BPS Analysis by Country, 2024 to 2034
Figure 80: Latin America Market Y-o-Y Growth (%) Projections by Country, 2024 to 2034
Figure 81: Latin America Market Value (US$ Million) Analysis by Mode of Transportation Type, 2019 to 2034
Figure 82: Latin America Market Value Share (%) and BPS Analysis by Mode of Transportation Type, 2024 to 2034
Figure 83: Latin America Market Y-o-Y Growth (%) Projections by Mode of Transportation Type, 2024 to 2034
Figure 84: Latin America Market Value (US$ Million) Analysis by Booking Channel, 2019 to 2034
Figure 85: Latin America Market Value Share (%) and BPS Analysis by Booking Channel, 2024 to 2034
Figure 86: Latin America Market Y-o-Y Growth (%) Projections by Booking Channel, 2024 to 2034
Figure 87: Latin America Market Value (US$ Million) Analysis by Tourist Type, 2019 to 2034
Figure 88: Latin America Market Value Share (%) and BPS Analysis by Tourist Type, 2024 to 2034
Figure 89: Latin America Market Y-o-Y Growth (%) Projections by Tourist Type, 2024 to 2034
Figure 90: Latin America Market Value (US$ Million) Analysis by Tour Type, 2019 to 2034
Figure 91: Latin America Market Value Share (%) and BPS Analysis by Tour Type, 2024 to 2034
Figure 92: Latin America Market Y-o-Y Growth (%) Projections by Tour Type, 2024 to 2034
Figure 93: Latin America Market Value (US$ Million) Analysis by Consumer Orientation, 2019 to 2034
Figure 94: Latin America Market Value Share (%) and BPS Analysis by Consumer Orientation, 2024 to 2034
Figure 95: Latin America Market Y-o-Y Growth (%) Projections by Consumer Orientation, 2024 to 2034
Figure 96: Latin America Market Value (US$ Million) Analysis by Age Group, 2019 to 2034
Figure 97: Latin America Market Value Share (%) and BPS Analysis by Age Group, 2024 to 2034
Figure 98: Latin America Market Y-o-Y Growth (%) Projections by Age Group, 2024 to 2034
Figure 99: Latin America Market Attractiveness by Mode of Transportation Type, 2024 to 2034
Figure 100: Latin America Market Attractiveness by Booking Channel, 2024 to 2034
Figure 101: Latin America Market Attractiveness by Tourist Type, 2024 to 2034
Figure 102: Latin America Market Attractiveness by Tour Type, 2024 to 2034
Figure 103: Latin America Market Attractiveness by Consumer Orientation, 2024 to 2034
Figure 104: Latin America Market Attractiveness by Age Group, 2024 to 2034
Figure 105: Latin America Market Attractiveness by Country, 2024 to 2034
Figure 106: Western Europe Market Value (US$ Million) by Mode of Transportation Type, 2024 to 2034
Figure 107: Western Europe Market Value (US$ Million) by Booking Channel, 2024 to 2034
Figure 108: Western Europe Market Value (US$ Million) by Tourist Type, 2024 to 2034
Figure 109: Western Europe Market Value (US$ Million) by Tour Type, 2024 to 2034
Figure 110: Western Europe Market Value (US$ Million) by Consumer Orientation, 2024 to 2034
Figure 111: Western Europe Market Value (US$ Million) by Age Group, 2024 to 2034
Figure 112: Western Europe Market Value (US$ Million) by Country, 2024 to 2034
Figure 113: Western Europe Market Value (US$ Million) Analysis by Country, 2019 to 2034
Figure 114: Western Europe Market Value Share (%) and BPS Analysis by Country, 2024 to 2034
Figure 115: Western Europe Market Y-o-Y Growth (%) Projections by Country, 2024 to 2034
Figure 116: Western Europe Market Value (US$ Million) Analysis by Mode of Transportation Type, 2019 to 2034
Figure 117: Western Europe Market Value Share (%) and BPS Analysis by Mode of Transportation Type, 2024 to 2034
Figure 118: Western Europe Market Y-o-Y Growth (%) Projections by Mode of Transportation Type, 2024 to 2034
Figure 119: Western Europe Market Value (US$ Million) Analysis by Booking Channel, 2019 to 2034
Figure 120: Western Europe Market Value Share (%) and BPS Analysis by Booking Channel, 2024 to 2034
Figure 121: Western Europe Market Y-o-Y Growth (%) Projections by Booking Channel, 2024 to 2034
Figure 122: Western Europe Market Value (US$ Million) Analysis by Tourist Type, 2019 to 2034
Figure 123: Western Europe Market Value Share (%) and BPS Analysis by Tourist Type, 2024 to 2034
Figure 124: Western Europe Market Y-o-Y Growth (%) Projections by Tourist Type, 2024 to 2034
Figure 125: Western Europe Market Value (US$ Million) Analysis by Tour Type, 2019 to 2034
Figure 126: Western Europe Market Value Share (%) and BPS Analysis by Tour Type, 2024 to 2034
Figure 127: Western Europe Market Y-o-Y Growth (%) Projections by Tour Type, 2024 to 2034
Figure 128: Western Europe Market Value (US$ Million) Analysis by Consumer Orientation, 2019 to 2034
Figure 129: Western Europe Market Value Share (%) and BPS Analysis by Consumer Orientation, 2024 to 2034
Figure 130: Western Europe Market Y-o-Y Growth (%) Projections by Consumer Orientation, 2024 to 2034
Figure 131: Western Europe Market Value (US$ Million) Analysis by Age Group, 2019 to 2034
Figure 132: Western Europe Market Value Share (%) and BPS Analysis by Age Group, 2024 to 2034
Figure 133: Western Europe Market Y-o-Y Growth (%) Projections by Age Group, 2024 to 2034
Figure 134: Western Europe Market Attractiveness by Mode of Transportation Type, 2024 to 2034
Figure 135: Western Europe Market Attractiveness by Booking Channel, 2024 to 2034
Figure 136: Western Europe Market Attractiveness by Tourist Type, 2024 to 2034
Figure 137: Western Europe Market Attractiveness by Tour Type, 2024 to 2034
Figure 138: Western Europe Market Attractiveness by Consumer Orientation, 2024 to 2034
Figure 139: Western Europe Market Attractiveness by Age Group, 2024 to 2034
Figure 140: Western Europe Market Attractiveness by Country, 2024 to 2034
Figure 141: Eastern Europe Market Value (US$ Million) by Mode of Transportation Type, 2024 to 2034
Figure 142: Eastern Europe Market Value (US$ Million) by Booking Channel, 2024 to 2034
Figure 143: Eastern Europe Market Value (US$ Million) by Tourist Type, 2024 to 2034
Figure 144: Eastern Europe Market Value (US$ Million) by Tour Type, 2024 to 2034
Figure 145: Eastern Europe Market Value (US$ Million) by Consumer Orientation, 2024 to 2034
Figure 146: Eastern Europe Market Value (US$ Million) by Age Group, 2024 to 2034
Figure 147: Eastern Europe Market Value (US$ Million) by Country, 2024 to 2034
Figure 148: Eastern Europe Market Value (US$ Million) Analysis by Country, 2019 to 2034
Figure 149: Eastern Europe Market Value Share (%) and BPS Analysis by Country, 2024 to 2034
Figure 150: Eastern Europe Market Y-o-Y Growth (%) Projections by Country, 2024 to 2034
Figure 151: Eastern Europe Market Value (US$ Million) Analysis by Mode of Transportation Type, 2019 to 2034
Figure 152: Eastern Europe Market Value Share (%) and BPS Analysis by Mode of Transportation Type, 2024 to 2034
Figure 153: Eastern Europe Market Y-o-Y Growth (%) Projections by Mode of Transportation Type, 2024 to 2034
Figure 154: Eastern Europe Market Value (US$ Million) Analysis by Booking Channel, 2019 to 2034
Figure 155: Eastern Europe Market Value Share (%) and BPS Analysis by Booking Channel, 2024 to 2034
Figure 156: Eastern Europe Market Y-o-Y Growth (%) Projections by Booking Channel, 2024 to 2034
Figure 157: Eastern Europe Market Value (US$ Million) Analysis by Tourist Type, 2019 to 2034
Figure 158: Eastern Europe Market Value Share (%) and BPS Analysis by Tourist Type, 2024 to 2034
Figure 159: Eastern Europe Market Y-o-Y Growth (%) Projections by Tourist Type, 2024 to 2034
Figure 160: Eastern Europe Market Value (US$ Million) Analysis by Tour Type, 2019 to 2034
Figure 161: Eastern Europe Market Value Share (%) and BPS Analysis by Tour Type, 2024 to 2034
Figure 162: Eastern Europe Market Y-o-Y Growth (%) Projections by Tour Type, 2024 to 2034
Figure 163: Eastern Europe Market Value (US$ Million) Analysis by Consumer Orientation, 2019 to 2034
Figure 164: Eastern Europe Market Value Share (%) and BPS Analysis by Consumer Orientation, 2024 to 2034
Figure 165: Eastern Europe Market Y-o-Y Growth (%) Projections by Consumer Orientation, 2024 to 2034
Figure 166: Eastern Europe Market Value (US$ Million) Analysis by Age Group, 2019 to 2034
Figure 167: Eastern Europe Market Value Share (%) and BPS Analysis by Age Group, 2024 to 2034
Figure 168: Eastern Europe Market Y-o-Y Growth (%) Projections by Age Group, 2024 to 2034
Figure 169: Eastern Europe Market Attractiveness by Mode of Transportation Type, 2024 to 2034
Figure 170: Eastern Europe Market Attractiveness by Booking Channel, 2024 to 2034
Figure 171: Eastern Europe Market Attractiveness by Tourist Type, 2024 to 2034
Figure 172: Eastern Europe Market Attractiveness by Tour Type, 2024 to 2034
Figure 173: Eastern Europe Market Attractiveness by Consumer Orientation, 2024 to 2034
Figure 174: Eastern Europe Market Attractiveness by Age Group, 2024 to 2034
Figure 175: Eastern Europe Market Attractiveness by Country, 2024 to 2034
Figure 176: South Asia and Pacific Market Value (US$ Million) by Mode of Transportation Type, 2024 to 2034
Figure 177: South Asia and Pacific Market Value (US$ Million) by Booking Channel, 2024 to 2034
Figure 178: South Asia and Pacific Market Value (US$ Million) by Tourist Type, 2024 to 2034
Figure 179: South Asia and Pacific Market Value (US$ Million) by Tour Type, 2024 to 2034
Figure 180: South Asia and Pacific Market Value (US$ Million) by Consumer Orientation, 2024 to 2034
Figure 181: South Asia and Pacific Market Value (US$ Million) by Age Group, 2024 to 2034
Figure 182: South Asia and Pacific Market Value (US$ Million) by Country, 2024 to 2034
Figure 183: South Asia and Pacific Market Value (US$ Million) Analysis by Country, 2019 to 2034
Figure 184: South Asia and Pacific Market Value Share (%) and BPS Analysis by Country, 2024 to 2034
Figure 185: South Asia and Pacific Market Y-o-Y Growth (%) Projections by Country, 2024 to 2034
Figure 186: South Asia and Pacific Market Value (US$ Million) Analysis by Mode of Transportation Type, 2019 to 2034
Figure 187: South Asia and Pacific Market Value Share (%) and BPS Analysis by Mode of Transportation Type, 2024 to 2034
Figure 188: South Asia and Pacific Market Y-o-Y Growth (%) Projections by Mode of Transportation Type, 2024 to 2034
Figure 189: South Asia and Pacific Market Value (US$ Million) Analysis by Booking Channel, 2019 to 2034
Figure 190: South Asia and Pacific Market Value Share (%) and BPS Analysis by Booking Channel, 2024 to 2034
Figure 191: South Asia and Pacific Market Y-o-Y Growth (%) Projections by Booking Channel, 2024 to 2034
Figure 192: South Asia and Pacific Market Value (US$ Million) Analysis by Tourist Type, 2019 to 2034
Figure 193: South Asia and Pacific Market Value Share (%) and BPS Analysis by Tourist Type, 2024 to 2034
Figure 194: South Asia and Pacific Market Y-o-Y Growth (%) Projections by Tourist Type, 2024 to 2034
Figure 195: South Asia and Pacific Market Value (US$ Million) Analysis by Tour Type, 2019 to 2034
Figure 196: South Asia and Pacific Market Value Share (%) and BPS Analysis by Tour Type, 2024 to 2034
Figure 197: South Asia and Pacific Market Y-o-Y Growth (%) Projections by Tour Type, 2024 to 2034
Figure 198: South Asia and Pacific Market Value (US$ Million) Analysis by Consumer Orientation, 2019 to 2034
Figure 199: South Asia and Pacific Market Value Share (%) and BPS Analysis by Consumer Orientation, 2024 to 2034
Figure 200: South Asia and Pacific Market Y-o-Y Growth (%) Projections by Consumer Orientation, 2024 to 2034
Figure 201: South Asia and Pacific Market Value (US$ Million) Analysis by Age Group, 2019 to 2034
Figure 202: South Asia and Pacific Market Value Share (%) and BPS Analysis by Age Group, 2024 to 2034
Figure 203: South Asia and Pacific Market Y-o-Y Growth (%) Projections by Age Group, 2024 to 2034
Figure 204: South Asia and Pacific Market Attractiveness by Mode of Transportation Type, 2024 to 2034
Figure 205: South Asia and Pacific Market Attractiveness by Booking Channel, 2024 to 2034
Figure 206: South Asia and Pacific Market Attractiveness by Tourist Type, 2024 to 2034
Figure 207: South Asia and Pacific Market Attractiveness by Tour Type, 2024 to 2034
Figure 208: South Asia and Pacific Market Attractiveness by Consumer Orientation, 2024 to 2034
Figure 209: South Asia and Pacific Market Attractiveness by Age Group, 2024 to 2034
Figure 210: South Asia and Pacific Market Attractiveness by Country, 2024 to 2034
Figure 211: East Asia Market Value (US$ Million) by Mode of Transportation Type, 2024 to 2034
Figure 212: East Asia Market Value (US$ Million) by Booking Channel, 2024 to 2034
Figure 213: East Asia Market Value (US$ Million) by Tourist Type, 2024 to 2034
Figure 214: East Asia Market Value (US$ Million) by Tour Type, 2024 to 2034
Figure 215: East Asia Market Value (US$ Million) by Consumer Orientation, 2024 to 2034
Figure 216: East Asia Market Value (US$ Million) by Age Group, 2024 to 2034
Figure 217: East Asia Market Value (US$ Million) by Country, 2024 to 2034
Figure 218: East Asia Market Value (US$ Million) Analysis by Country, 2019 to 2034
Figure 219: East Asia Market Value Share (%) and BPS Analysis by Country, 2024 to 2034
Figure 220: East Asia Market Y-o-Y Growth (%) Projections by Country, 2024 to 2034
Figure 221: East Asia Market Value (US$ Million) Analysis by Mode of Transportation Type, 2019 to 2034
Figure 222: East Asia Market Value Share (%) and BPS Analysis by Mode of Transportation Type, 2024 to 2034
Figure 223: East Asia Market Y-o-Y Growth (%) Projections by Mode of Transportation Type, 2024 to 2034
Figure 224: East Asia Market Value (US$ Million) Analysis by Booking Channel, 2019 to 2034
Figure 225: East Asia Market Value Share (%) and BPS Analysis by Booking Channel, 2024 to 2034
Figure 226: East Asia Market Y-o-Y Growth (%) Projections by Booking Channel, 2024 to 2034
Figure 227: East Asia Market Value (US$ Million) Analysis by Tourist Type, 2019 to 2034
Figure 228: East Asia Market Value Share (%) and BPS Analysis by Tourist Type, 2024 to 2034
Figure 229: East Asia Market Y-o-Y Growth (%) Projections by Tourist Type, 2024 to 2034
Figure 230: East Asia Market Value (US$ Million) Analysis by Tour Type, 2019 to 2034
Figure 231: East Asia Market Value Share (%) and BPS Analysis by Tour Type, 2024 to 2034
Figure 232: East Asia Market Y-o-Y Growth (%) Projections by Tour Type, 2024 to 2034
Figure 233: East Asia Market Value (US$ Million) Analysis by Consumer Orientation, 2019 to 2034
Figure 234: East Asia Market Value Share (%) and BPS Analysis by Consumer Orientation, 2024 to 2034
Figure 235: East Asia Market Y-o-Y Growth (%) Projections by Consumer Orientation, 2024 to 2034
Figure 236: East Asia Market Value (US$ Million) Analysis by Age Group, 2019 to 2034
Figure 237: East Asia Market Value Share (%) and BPS Analysis by Age Group, 2024 to 2034
Figure 238: East Asia Market Y-o-Y Growth (%) Projections by Age Group, 2024 to 2034
Figure 239: East Asia Market Attractiveness by Mode of Transportation Type, 2024 to 2034
Figure 240: East Asia Market Attractiveness by Booking Channel, 2024 to 2034
Figure 241: East Asia Market Attractiveness by Tourist Type, 2024 to 2034
Figure 242: East Asia Market Attractiveness by Tour Type, 2024 to 2034
Figure 243: East Asia Market Attractiveness by Consumer Orientation, 2024 to 2034
Figure 244: East Asia Market Attractiveness by Age Group, 2024 to 2034
Figure 245: East Asia Market Attractiveness by Country, 2024 to 2034
Figure 246: Middle East and Africa Market Value (US$ Million) by Mode of Transportation Type, 2024 to 2034
Figure 247: Middle East and Africa Market Value (US$ Million) by Booking Channel, 2024 to 2034
Figure 248: Middle East and Africa Market Value (US$ Million) by Tourist Type, 2024 to 2034
Figure 249: Middle East and Africa Market Value (US$ Million) by Tour Type, 2024 to 2034
Figure 250: Middle East and Africa Market Value (US$ Million) by Consumer Orientation, 2024 to 2034
Figure 251: Middle East and Africa Market Value (US$ Million) by Age Group, 2024 to 2034
Figure 252: Middle East and Africa Market Value (US$ Million) by Country, 2024 to 2034
Figure 253: Middle East and Africa Market Value (US$ Million) Analysis by Country, 2019 to 2034
Figure 254: Middle East and Africa Market Value Share (%) and BPS Analysis by Country, 2024 to 2034
Figure 255: Middle East and Africa Market Y-o-Y Growth (%) Projections by Country, 2024 to 2034
Figure 256: Middle East and Africa Market Value (US$ Million) Analysis by Mode of Transportation Type, 2019 to 2034
Figure 257: Middle East and Africa Market Value Share (%) and BPS Analysis by Mode of Transportation Type, 2024 to 2034
Figure 258: Middle East and Africa Market Y-o-Y Growth (%) Projections by Mode of Transportation Type, 2024 to 2034
Figure 259: Middle East and Africa Market Value (US$ Million) Analysis by Booking Channel, 2019 to 2034
Figure 260: Middle East and Africa Market Value Share (%) and BPS Analysis by Booking Channel, 2024 to 2034
Figure 261: Middle East and Africa Market Y-o-Y Growth (%) Projections by Booking Channel, 2024 to 2034
Figure 262: Middle East and Africa Market Value (US$ Million) Analysis by Tourist Type, 2019 to 2034
Figure 263: Middle East and Africa Market Value Share (%) and BPS Analysis by Tourist Type, 2024 to 2034
Figure 264: Middle East and Africa Market Y-o-Y Growth (%) Projections by Tourist Type, 2024 to 2034
Figure 265: Middle East and Africa Market Value (US$ Million) Analysis by Tour Type, 2019 to 2034
Figure 266: Middle East and Africa Market Value Share (%) and BPS Analysis by Tour Type, 2024 to 2034
Figure 267: Middle East and Africa Market Y-o-Y Growth (%) Projections by Tour Type, 2024 to 2034
Figure 268: Middle East and Africa Market Value (US$ Million) Analysis by Consumer Orientation, 2019 to 2034
Figure 269: Middle East and Africa Market Value Share (%) and BPS Analysis by Consumer Orientation, 2024 to 2034
Figure 270: Middle East and Africa Market Y-o-Y Growth (%) Projections by Consumer Orientation, 2024 to 2034
Figure 271: Middle East and Africa Market Value (US$ Million) Analysis by Age Group, 2019 to 2034
Figure 272: Middle East and Africa Market Value Share (%) and BPS Analysis by Age Group, 2024 to 2034
Figure 273: Middle East and Africa Market Y-o-Y Growth (%) Projections by Age Group, 2024 to 2034
Figure 274: Middle East and Africa Market Attractiveness by Mode of Transportation Type, 2024 to 2034
Figure 275: Middle East and Africa Market Attractiveness by Booking Channel, 2024 to 2034
Figure 276: Middle East and Africa Market Attractiveness by Tourist Type, 2024 to 2034
Figure 277: Middle East and Africa Market Attractiveness by Tour Type, 2024 to 2034
Figure 278: Middle East and Africa Market Attractiveness by Consumer Orientation, 2024 to 2034
Figure 279: Middle East and Africa Market Attractiveness by Age Group, 2024 to 2034
Figure 280: Middle East and Africa Market Attractiveness by Country, 2024 to 2034
As of 2024, the market for luxury travel is expected to be valued at USD 2.26 trillion.
The luxury travel market is projected to expand at a CAGR of 6.5% from 2024 and 2034.
The online booking segment is projected to dominate the industry.
By 2034, the market value of the luxury travel is expected to reach USD 4.24 trillion.
Australia is likely the top-performing market, with a CAGR of 8.1%.
Explore Similar Insights
Thank you!
You will receive an email from our Business Development Manager. Please be sure to check your SPAM/JUNK folder too.