Women's Luxury Footwear Market
Market Insights on Women's Luxury Footwear covering sales outlook, demand forecast & up-to-date key trends
Women's Luxury Footwear Market By Material Type (Rubber, Leather, Polyester, Velvet), Price Range (300-499, 500-699, 700-999, 1000-1299) & Region - Forecast 2022 - 2029
Women’s Luxury Footwear Market Outlook (2022-2029)
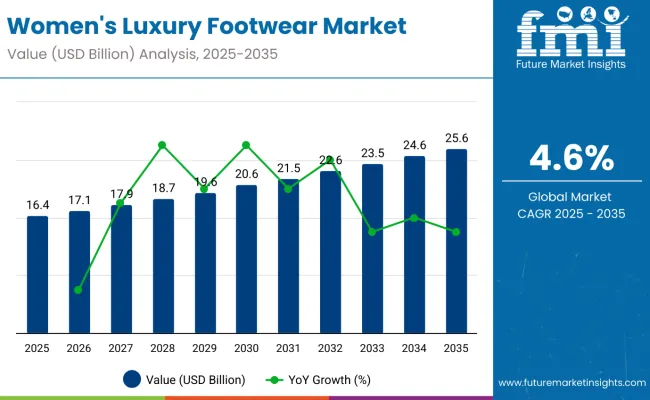
[350 Pages Report] The global women’s luxury footwear market is currently worth close to US$ 30 Bn, and is projected to close in on a valuation of US$ 39 Bn by 2029, rising at a steady CAGR of 5% from 2022 to 2029.
Women’s Luxury Footwear Market Size (2022) |
US$ 30 Bn |
Sales Forecast (2029) |
US$ 39 Bn |
Global Market Growth Rate (2022 to 2029) |
5% CAGR |
Share of Top 5 Women’s Luxury Footwear Suppliers |
55% |
Women’s luxury footwear sales accounted for approximately 10% - 12% share of the global footwear market in 2021. Demand for boots is likely to increase at the fastest rate over the assessment period of 2022 to 2029.
Let us know your requirement to get
100% FREE customization
How The Market Progressed Till June 2022?
Market Statistics |
Details |
H1,2021 (A) |
6.9% |
H1,2022 Projected (P) |
7.0% |
H1,2022 Outlook (O) |
7.7% |
BPS Change : H1,2022 (O) - H1,2022 (P) |
(+) 70 ↑ |
BPS Change : H1,2022 (O) - H1,2021 (A) |
(+) 77 ↑ |
Future Market Insights predict a comparison and review analysis of the dynamics of the women’s luxury footwear market, which is principally subjected to an array of industry factors along with a few definite influences concerning viewpoints that support industry innovation.
With some new advances that have taken place in the market, few companies are now producing sustainable footwear, which creates opportunities for other players to enter eco-friendly women’s luxury footwear manufacturing.
According to FMI analysis, the variation between the BPS values observed in the women’s luxury footwear market in H1, 2022 - Outlook over H1, 2022 Projected reflects a growth of 70 units. However, compared to H1, 2021, the market is expected to spike by 77 BPS in H1 -2022.
Key reasons for this change in growth rate are attributed to the steady uptake of the market during the first half of the forecast period, owed to the rising consumer demand for premium footwear with distinct characteristics and women’s luxury footwear brands are expected to drive market growth in the region.
In June 2021, Louis Vuitton launched the LV Squad sneaker and LV Sunset mule footwear commercials with online sensations Emma Chamberlain and Charli D'Amelio. The new footwear styles are now available at all of the brand's retail locations and online retailers.
Despite these prospects, there are some likely challenges that stay ahead for the industry, which include consumers purchasing patterns according to trends it will affect the industry.
Demand Analysis of Women’s Luxury Footwear from 2014 to 2021 Vs Market Projections for 2022 to 2029
“Working Women Catalyzing Ladies Designer Footwear Market Expansion”
From 2014 to 2021, the global women’s luxury footwear market experienced a CAGR of around 4%.
The ladies designer footwear market contributes a high market revenue share as compared to men’s. Changing lifestyles, growing fashion concerns, and celebrity endorsements have had a significant impact on the global footwear market. Recent market trends in ladies designer footwear are - sustainable footwear, smart shoes, and athleisure trends.
Major women’s luxury footwear brands are targeting high-end customers or women, and strengthening their women’s footwear business through special advertisements and branding. The number of working women is rapidly increasing, and women are running new businesses that provide them self-sufficiency and financial independence, across the globe.
The recent past has witnessed a widespread distribution of women’s luxury footwear by attracting consumers of all age groups. The younger generation is considered as the key driver for the women’s luxury footwear market growth.
Over the coming years, Gen Y and Gen Z are likely to contribute a significant share in the market owing to their high purchasing power and influence in purchasing products through online sales channels. The luxury goods market, which also includes luxury footwear, is expected to have a significant market share during the forecast period.
In the women’s luxury footwear category, manufacturers have an opportunity to produce sustainable or eco-friendly women’s luxury footwear. A very few companies are now producing sustainable footwear, which creates opportunities for other players to enter eco-friendly women’s luxury footwear manufacturing.
Prioritizing the use of alternative materials including plant-based rubber, bio-printed leather, and natural textile will further remain key to gaining a distinct competitive edge.
Thus, due to the factors mentioned above, the global women’s luxury footwear market is projected to expand at a 5% CAGR across 2022 to 2029.
Which Region Offers Huge Opportunity for Women’s Luxury Footwear Sales?
“Sales of Women’s Luxury Footwear Brands Highest in Europe”
Europe is expected to remain prominent in the global women’s luxury footwear market, attributed to the growing use of women’s luxury footwear brands such as JIMMY CHOO PLC, Hermes, Christian Dior, Gucci, Chanel, etc.
Europe is expected to see significant development in the market because of consumers’ rising preference for women’s luxury footwear brands.
Furthermore, rising consumer demand for premium footwear with distinct characteristics and women’s luxury footwear brands is expected to drive market growth in the region.
Country-wise Analysis
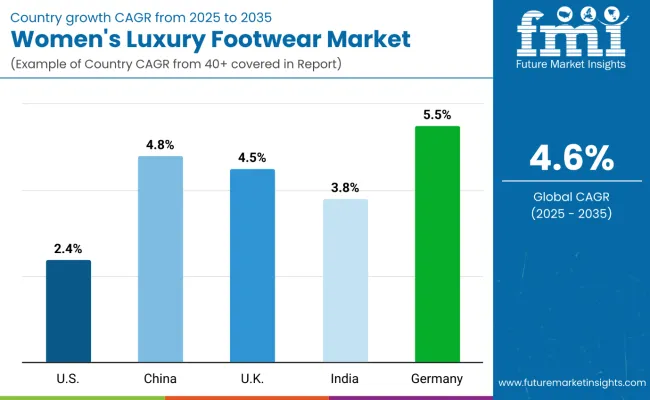
Why is the U.S Expected to Be the Most Promising Women’s Luxury Footwear Market?
“High-Net-Worth Individuals’ Demand for Premium Footwear Driving Market Growth in the U.S.”
The U.S. leads the adoption of women’s premium footwear with a wide range of players focusing on diversifying their product portfolio to maintain a competitive advantage.
One of the main elements propelling the market has been the existence of a big number of elite people with high disposable income in the country.
Significant lucrative opportunities are expected in the U.S. owing to the expansion of the affluent consumer class and subsequently changing purchasing decisions.
Leading producers of premium footwear are currently prioritizing R&D and new product launches to resonate with the growing demand from the U.S.
What is the Scope of Growth for Women’s Luxury Footwear Suppliers in China?
“Increasing Preference for Women’s Designer Shoes to Positively Drive Business Outlook”
The tendency of women to follow the latest fashion trend is credited with the market growth in China.
Moreover, extensive promotional methods, as well as brand engagement, are expected to drive the demand for women’s designer shoes.
Individuals in China are getting benefits from the discount pricing levels of their favorite women’s designer shoe companies thanks to the significant strides that e-commerce has made.
A gradual move away from disposability in favor of occasionally worn, highly priced editions of women’s custom footwear is set to lure more Chinese consumers over the coming years.
Find your sweet spots for generating winning opportunities in this market.
Talk to AnalystCategory-wise Insights
Which Product Type of Women’s Luxury Footwear is Most Popular?
“Ongoing Product Innovations Driving Demand Growth of Women’s Boots”
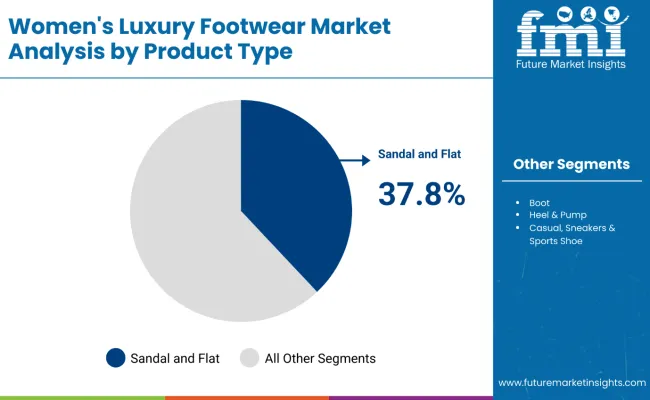
Boots are expected to account for over 40% of the global market share in 2022. Boots are considered as a key attributor to the global women’s luxury footwear market, which can be attributed to their availability in a wide variety of designs.
In recent years, luxury footwear trends have strongly influenced premium fashion choices, propelled by modern affluent consumers’ desire to balance comfort and style.
The result is projected to lead to increased sales of women’s boots over the next decade. With celebrities transforming the perception of active wear to a hit fashion statement, boots that were once focused on performance and functionality are given a designer reinterpretation.
The increasing popularity of luxury footwear items, particularly boots, as an expression of one's proficiency at work, especially in the business and fashion industries, is predicted to drive product demand.
Increasing number of high-net-worth individuals (HNI) led to a surge in demand for women’s custom footwear. Advancements in technology such as 3D printing and advanced sensors would also push manufacturers to introduce innovative boot designs.
Which Sales Channel is Projected to Drive Maximum Growth of Women’s Luxury Footwear?
“Online Sales of Women’s Luxury Footwear Thriving across Regions”
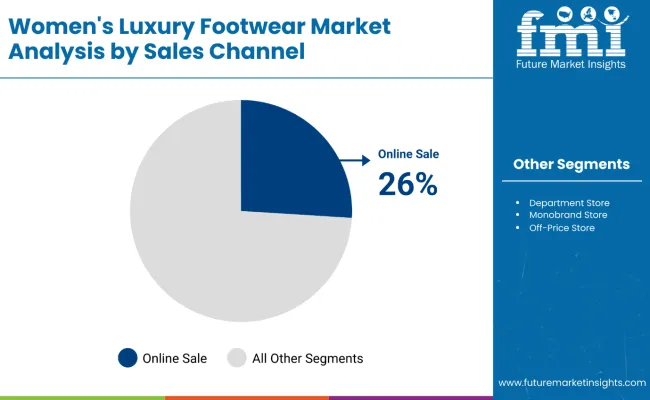
Online sales channel is becoming more popular as people become more digitally savvy.
As a result, consumers' buying practices are being transformed, new user experiences are being shaped, business plans are being disrupted, and new growth prospects are being created for both single and multi-brand retailers of women's non-athletic footwear around the world.
Store-based retailing still remains preferred, as it allows customers to check their products physically and enjoy the brand experience. Earlier, high-end items were reserved for offline sales, and e-Commerce was considered a channel for selling low- to mid-range women’s luxury footwear.
However, realizing that luxury purchases these days are majorly influenced by online experience, companies are focusing on strengthening their online sales channels.
e-Commerce expansion has been significantly influencing the luxury industry, further compelling manufacturers to adopt an omni-channel strategy.
High exposure of consumers in websites such as Amazon, Walmart, etc., with 10% online penetration rate, support online sales channel is becoming the most lucrative sales channel.
COVID-19 Impact on Women’s Luxury Footwear Sales
The COVID-19 pandemic has had a negative impact on various businesses around the world, including the women's luxury footwear market. Store closures as a result of isolation and shutdown procedures have had disastrous results.
Interruption of the logistics system and the closure of manufacturing facilities are impeding the development of the women's luxury footwear market. On the other hand, COVID-19 lockdown has pushed consumers to turn to e-commerce platforms to make purchases owing to the closure of retail establishments.
In the middle of the pandemic, market players have taken advantage of the situation to enhance their Internet presence.

An unified Market Research Subscription Platform, built for today’s disparate research needs.
Competitive Landscape
Market players primarily focus on product design and innovation. Mergers and acquisitions are also identified as key developmental strategies adopted by manufacturers of women’s luxury footwear.
For instance,
- In June 2021, Louis Vuitton launched the LV Squad sneaker and LV Sunset mule footwear commercials with online sensations Emma Chamberlain and Charli D'Amelio. The new footwear styles are now available at all of the brand's retail locations and online retailers.
Women’s Luxury Footwear Industry Report Scope
Attribute |
Details |
Forecast Period |
2022-2029 |
Historical Data Available for |
2014-2021 |
Market Analysis |
Value in US$ Mn, Volume in Units |
Key Regions Covered |
|
Key Countries Covered |
|
Key Market Segments Covered |
|
Key Companies Profiled |
|
Pricing |
Available upon Request |
Key Segments of Women’s Luxury Footwear Industry Survey
Women’s Luxury Footwear Market by Product:
- Women’s Luxury Boots
- Women’s Luxury Heels & Pumps
- Women’s Luxury Sandals & Flats
- Women’s Luxury Casuals, Sneakers & Sports Shoes
Women’s Luxury Footwear Market by Material:
- Rubber Footwear
- Leather Footwear
- Polyester Footwear
- Velvet Footwear
- Canvas Footwear
- Textile Footwear
- Others
Women’s Luxury Footwear Market by Price Range:
- US$ 300-499
- US$ 500-699
- US$ 700-999
- US$ 1,000-1,299
- US$ 1,300-1,599
- US$ 1,600 & Above
Women’s Luxury Footwear Market by Sales Channel:
- Offline Sales of Women’s Luxury Footwear
- Department Stores
- Specialty Stores
- Monobrand Stores
- Off-price Stores
- Others
- Online Sales of Women’s Luxury Footwear
Women’s Luxury Footwear Market by Region
- North America Women’s Luxury Footwear Market
- Latin America Women’s Luxury Footwear Market
- Europe Women’s Luxury Footwear Market
- East Asia Women’s Luxury Footwear Market
- South Asia & Pacific Women’s Luxury Footwear Market
- Middle East & Africa (MEA) Women’s Luxury Footwear Market
Frequently Asked Questions
The global women's luxury footwear market is estimated to rise at a CAGR of 5% through 2029, reaching US$ 39 Bn.
Kering, Louis Vuitton, Burberry, Caleres, and Jimmy Choo PLC are some of the leading companies manufacturing women’s luxury footwear.
Boots account for 40% share in the women’s luxury footwear industry.
Rise in the number of business professionals as well as growing preference for luxury footwear as a symbol of status among women are factors driving market growth.
The U.S., U.K, China, Germany, and France are dominant countries in the women’s luxury footwear space.
Table of Content
1. Executive Summary
1.1. Global Market Outlook
1.2. Summary of key findings
1.3. Summary of Key Statistics
1.4. FMI Analysis and Recommendations
2. Market Overview
2.1. Market Taxonomy
2.2. Market Definition
3. Key Market Trends
3.1. Key Trends Impacting the Market
3.1.1. Rapidly Growing Fashion Trend Particularly Among Young Professional Women
3.1.2. Rise In Female Participation In Workforce
3.1.3. Consumers Selecting for At-Home Services, Using e-Commerce
3.1.4. Luxury Brands Shift Their Attention To Asia
3.1.5. Introduction of Innovative Products With Multiple Features
3.1.6. Companies are Outsourcing Their Production To Low-Cost Labour Countries
3.1.7. Demand For Functional Footwear
3.1.8. Growing Trend of Mass Customization and Personalization
3.1.9. Emergence of High End & Luxury Footwear
3.2. Product Development Trends
3.3. Future Prospects of Footwear Industry
3.3.1. Factors Fuelling Growth
3.3.2. Influx of Brands
3.3.3. Increasing Demand of Athletic Shoes
3.3.4. Innovative Distribution & Digital Marketing Strategies
3.4. Luxury Women’s Footwear, by Consumer Demography (% of Demand)
3.4.1. Gen X
3.4.2. Gen Y
3.4.3. Baby Boomers
3.4.4. Millennials
4. Major Positioning/Brand Assessment
4.1. Price is The Top Priority
4.2. Design The Chief Product Influencer
4.3. Brand Positioning The Key Sales Differentiator
4.4. Mergers & Acquisition Across The Value Chain
4.5. Category Performance (By Product Type)
4.5.1. Total Searches by Product Type
4.5.2. Total Spend By Women
4.5.3. Browse v/s purchase Rate
5. Female Labour Force Participation- Lead To High Demand For Women Shoes
5.1. Reducing Gap Between Male & Female Education Levels
5.2. Educational Enrolment Ratio- Male v/s Female
5.3. Female & Male Labor Force Participation Rate- By Country
5.3.1. India
5.3.2. Mexico
5.3.3. Indonesia
5.3.4. Bangladesh
5.3.5. USA
5.3.6. China
5.3.7. Vietnam
6. Key Success Factors
6.1. Establishment of Brand Names
6.2. Economies of Scope
6.3. Effective Quality Control
6.4. Establishment of Export Markets
6.5. Understanding Government Policies And Their Implications
7. Global Luxury Women’s Footwear Market Demand Analysis 2014-2021 and Forecast, 2022-2029
7.1. Historical Market Volume (Mn Units) Analysis, 2014-2021
7.2. Current and Future Market Volume (Mn Units) Projections, 2022-2029
7.3. Y-o-Y Growth Trend Analysis
8. Global Luxury Women’s Footwear Market - Pricing Analysis
8.1. Regional Pricing Analysis By Product Type
8.2. Pricing Break-up
8.2.1. Manufacturer Level Pricing
8.2.2. Distributor Level Pricing
8.3. Global Average Pricing Analysis Benchmark
9. Global Luxury Women’s Footwear Market Demand (in Value or Size in US$ Mn) Analysis 2014-2021 and Forecast, 2022-2029
9.1. Historical Market Value (US$ Mn) Analysis, 2014-2021
9.2. Current and Future Market Value (US$ Mn) Projections, 2022-2029
9.2.1. Y-o-Y Growth Trend Analysis
9.2.2. Absolute $ Opportunity Analysis
10. Market Background
10.1. Footwear Industry Overview
10.1.1. Global Consumer Footwear Expenditure
10.1.2. Athletic and Non-Athletic Shoes Overview
10.1.3. Percentage of Luxury Women’s Footwear in Overall Footwear Market
10.1.4. Global Footwear Production & Consumption Outlook, By Country
10.1.5. Top 10 Footwear Consuming Countries
10.1.6. Trade: Import & Exports
10.1.7. Main Trading Partners Countries
10.1.8. Top Brands in Footwear Industry, 2021
10.1.9. Global Footwear Industry Overview, By Demographic (% of Demand)
10.1.9.1. Men
10.1.9.2. Women
10.1.9.3. Children
10.1.10. Product Innovation by Key Manufacturers in the Industry
10.1.11. Footwear Evolution
10.1.12. Organized v/s Unorganized Market
10.2. Luxury Women’s Footwear, by Toe Shape (% of Demand)
10.2.1. Open
10.2.2. Round
10.2.3. Pointed
10.2.4. Peep
10.2.5. Square
10.2.6. Others
10.3. Product Life Cycle Analysis
10.3.1. Life Cycle Stage
10.3.2. Life Cycle Reasons
10.3.3. Life Cycle Analysis
10.4. Macro-Economic Factors
10.4.1. Global GDP Growth Outlook
10.4.2. Consumer Buying Behaviour Analysis
10.4.3. Global Consumer Spending Outlook
10.4.4. Global Households Disposable Income Outlook
10.4.5. Per Capita Spending On Footwear
10.4.6. Global Female Population Growth
10.4.7. Foreign Investment Outlook
10.4.8. Changing Retail Landscape
10.4.9. E-Commerce Importance To GDP
10.5. Industry Value and Supply Chain Analysis
10.5.1. Profit Margin Analysis at each sales point
10.5.2. List & role of key participants
10.5.2.1. Manufacturers
10.5.2.2. Distributors/Retailers
10.5.2.3. List of Private Label Brands
10.6. Forecast Factors - Relevance & Impact
10.6.1. Top Companies Historical Growth
10.6.2. GDP Growth Rate Analysis
10.6.3. Contributions To GDP Growth
10.6.4. Urbanization Growth Outlook
10.6.5. Manufacturing Sector GVA
10.6.6. Export Price Growth Rates
10.7. Purchase Pattern Assessment
10.7.1. Analysis On Perception Towards Luxury Women’s Footwear
10.7.2. Analysis On Preferred Purchase Mode
10.7.3. Analysis On The Consumption Pattern
10.7.4. Consumer Insights
10.7.5. Others (Pointers Will Be Developed During The Course of Study)
10.8. Strategic Outlook & View Point With Commentary
10.8.1. Transforming Marketing Strategies
10.8.2. Market & Channel Development Trends
10.8.3. Market Mix (4 P's of Marketing) Strategies
10.8.4. Go-To-Market strategy
10.8.5. Strategic Promotional Strategies
10.8.6. Branding & Promotion Outlook
10.9. Social Media Sentiment Analysis
10.10. PESTLE Analysis of Luxury Women’s Footwear Market
10.11. Region Wise Market Positioning Assessment
10.12. Investment Feasibility Matrix of Luxury Women’s Footwear Market
10.13. Porter’s Five Force
10.14. Market Dynamics
10.14.1. Drivers
10.14.2. Restraints
10.14.3. Opportunity Analysis
11. Global Luxury Women’s Footwear Market Analysis 2014-2021 and Forecast 2022-2029, by Product Type
11.1. Introduction / Key Findings
11.2. Historical Market Size (US$ Mn) and Volume (Mn Units) Analysis By Product Type, 2014 - 2021
11.3. Current and Future Market Size (US$ Mn) and Volume (Mn Units) Analysis and Forecast By Product Type, 2022 - 2029
11.3.1. Casual Shoes
11.3.2. Boots
11.3.3. Heels & Pumps
11.3.4. Sandals & Flats
11.3.5. Dress Shoes
11.3.6. Sneakers & Sports Shoes
11.4. Market Attractiveness Analysis By Product Type
12. Global Luxury Women’s Footwear Market Analysis 2014-2021 and Forecast 2022-2029, by Material Type
12.1. Introduction / Key Findings
12.2. Historical Market Size (US$ Mn) and Volume (Mn Units) Analysis By Material Type, 2014 - 2021
12.3. Current and Future Market Size (US$ Mn) and Volume (Mn Units) Analysis and Forecast By Material Type, 2022 - 2029
12.3.1. Rubber
12.3.2. Leather
12.3.3. Polyester
12.3.4. Velvet
12.3.5. Canvas
12.3.6. Textiles
12.3.7. Others
12.4. Market Attractiveness Analysis By Material Type
13. Global Luxury Women’s Footwear Market Analysis 2014-2021 and Forecast 2022-2029, by Sales Channel
13.1. Introduction / Key Findings
13.2. Historical Market Size (US$ Mn) and Volume (Mn Units) Analysis By Sales Channel, 2014 - 2021
13.3. Current and Future Market Size (US$ Mn) and Volume (Mn Units) Analysis and Forecast By Sales Channel, 2022 - 2029
13.3.1. Offline Sales Channel
13.3.1.1. Hypermarkets/Supermarkets
13.3.1.2. Discount Stores
13.3.1.3. Specialty Stores
13.3.1.4. Multi-Brand stores
13.3.1.5. Exclusive Stores
13.3.1.6. Other Offline Sales Channel
13.3.2. Online Sales Channel
13.4. Market Attractiveness Analysis By Sales Channel
14. Global Luxury Women’s Footwear Market Analysis 2014-2021 and Forecast 2022-2029, by Region
14.1. Introduction
14.2. Historical Market Size (US$ Mn) and Volume (Mn Units) Analysis By Region, 2014 - 2021
14.3. Current Market Size (US$ Mn) and Volume (Mn Units) Analysis and Forecast By Region, 2022 - 2029
14.3.1. North America
14.3.2. Europe
14.3.3. Middle East and Africa (MEA)
14.3.4. East Asia
14.3.5. South Asia
14.3.6. Oceania
14.3.7. Latin America
14.4. Market Attractiveness Analysis By Region
15. North America Luxury Women’s Footwear Market Analysis 2014-2021 and Forecast 2022-2029
15.1. Introduction
15.2. Pricing Analysis
15.3. Historical Market Size (US$ Mn) and Volume Trend (Mn Units) Analysis By Market Taxonomy, 2014 - 2021
15.4. Market Size (US$ Mn) and Volume Forecast By Market Taxonomy, 2022 - 2029
15.4.1. By Country
15.4.1.1. U.S.
15.4.1.2. Canada
15.4.2. By Product Type
15.4.3. By Material Type
15.4.4. By Consumer Demographics (% of demand)
15.4.5. By Sales Channel
15.5. Market Attractiveness Analysis
15.5.1. By Country
15.5.2. By Product Type
15.5.3. By Material Type
15.5.4. By Consumer Demographics (% of demand)
15.5.5. By Sales Channel
15.6. Market Trends
15.7. Key Market Participants - Intensity Mapping
15.8. Drivers and Restraints - Impact Analysis
16. Latin America Luxury Women’s Footwear Market Analysis 2014-2021 and Forecast 2022-2029
16.1. Introduction
16.2. Pricing Analysis
16.3. Historical Market Size (US$ Mn) and Volume Trend (Mn Units) Analysis By Market Taxonomy, 2014 - 2021
16.4. Market Size (US$ Mn) and Volume Forecast By Market Taxonomy, 2022 - 2029
16.4.1. By Country
16.4.1.1. Brazil
16.4.1.2. Mexico
16.4.1.3. Argentina
16.4.1.4. Rest of Latin America
16.4.2. By Product Type
16.4.3. By Material Type
16.4.4. By Consumer Demographics (% of demand)
16.4.5. By Sales Channel
16.5. Market Attractiveness Analysis
16.5.1. By Country
16.5.2. By Product Type
16.5.3. By Material Type
16.5.4. By Consumer Demographics (% of demand)
16.5.5. By Sales Channel
16.6. Market Trends
16.7. Key Market Participants - Intensity Mapping
16.8. Drivers and Restraints - Impact Analysis
17. Europe Luxury Women’s Footwear Market Analysis 2014-2021 and Forecast 2022-2029
17.1. Introduction
17.2. Pricing Analysis
17.3. Historical Market Size (US$ Mn) and Volume Trend (Mn Units) Analysis By Market Taxonomy, 2014 - 2021
17.4. Market Size (US$ Mn) and Volume Forecast By Market Taxonomy, 2022 - 2029
17.4.1. By Country
17.4.1.1. Germany
17.4.1.2. Italy
17.4.1.3. France
17.4.1.4. U.K.
17.4.1.5. Spain
17.4.1.6. BENELUX
17.4.1.7. Russia
17.4.1.8. Rest of Europe
17.4.2. By Product Type
17.4.3. By Material Type
17.4.4. By Consumer Demographics (% of demand)
17.4.5. By Sales Channel
17.5. Market Attractiveness Analysis
17.5.1. By Country
17.5.2. By Product Type
17.5.3. By Material Type
17.5.4. By Consumer Demographics (% of demand)
17.5.5. By Sales Channel
17.6. Market Trends
17.7. Key Market Participants - Intensity Mapping
17.8. Drivers and Restraints - Impact Analysis
18. South Asia Luxury Women’s Footwear Market Analysis 2014-2021 and Forecast 2022-2029
18.1. Introduction
18.2. Pricing Analysis
18.3. Historical Market Size (US$ Mn) and Volume Trend (Mn Units) Analysis By Market Taxonomy, 2014 - 2021
18.4. Market Size (US$ Mn) and Volume Forecast By Market Taxonomy, 2022 - 2029
18.4.1. By Country
18.4.1.1. India
18.4.1.2. Thailand
18.4.1.3. Indonesia
18.4.1.4. Malaysia
18.4.1.5. Rest of South Asia
18.4.2. By Product Type
18.4.3. By Material Type
18.4.4. By Consumer Demographics (% of demand)
18.4.5. By Sales Channel
18.5. Market Attractiveness Analysis
18.5.1. By Country
18.5.2. By Product Type
18.5.3. By Material Type
18.5.4. By Consumer Demographics (% of demand)
18.5.5. By Sales Channel
18.6. Market Trends
18.7. Key Market Participants - Intensity Mapping
18.8. Drivers and Restraints - Impact Analysis
19. East Asia Luxury Women’s Footwear Market Analysis 2014-2021 and Forecast 2022-2029
19.1. Introduction
19.2. Pricing Analysis
19.3. Historical Market Size (US$ Mn) and Volume Trend (Mn Units) Analysis By Market Taxonomy, 2014 - 2021
19.4. Market Size (US$ Mn) and Volume Forecast By Market Taxonomy, 2022 - 2029
19.4.1. By Country
19.4.1.1. China
19.4.1.2. Japan
19.4.1.3. South Korea
19.4.2. By Product Type
19.4.3. By Material Type
19.4.4. By Consumer Demographics (% of demand)
19.4.5. By Sales Channel
19.5. Market Attractiveness Analysis
19.5.1. By Country
19.5.2. By Product Type
19.5.3. By Material Type
19.5.4. By Consumer Demographics (% of demand)
19.5.5. By Price Range
19.5.6. By Sales Channel
19.6. Market Trends
19.7. Key Market Participants - Intensity Mapping
19.8. Drivers and Restraints - Impact Analysis
20. Oceania Luxury Women’s Footwear Market Analysis 2014-2021 and Forecast 2022-2029
20.1. Introduction
20.2. Pricing Analysis
20.3. Historical Market Size (US$ Mn) and Volume Trend (Mn Units) Analysis By Market Taxonomy, 2014 - 2021
20.4. Market Size (US$ Mn) and Volume Forecast By Market Taxonomy, 2022 - 2029
20.4.1. By Country
20.4.1.1. Australia
20.4.1.2. New Zealand
20.4.2. By Product Type
20.4.3. By Material Type
20.4.4. By Consumer Demographics (% of demand)
20.4.5. By Sales Channel
20.5. Market Attractiveness Analysis
20.5.1. By Country
20.5.2. By Product Type
20.5.3. By Material Type
20.5.4. By Consumer Demographics (% of demand)
20.5.5. By Sales Channel
20.6. Market Trends
20.7. Key Market Participants - Intensity Mapping
20.8. Drivers and Restraints - Impact Analysis
21. Middle East and Africa Luxury Women’s Footwear Market Analysis 2014-2021 and Forecast 2022-2029
21.1. Introduction
21.2. Pricing Analysis
21.3. Historical Market Size (US$ Mn) and Volume Trend (Mn Units) Analysis By Market Taxonomy, 2014 - 2021
21.4. Market Size (US$ Mn) and Volume Forecast By Market Taxonomy, 2022 - 2029
21.4.1. By Country
21.4.1.1. GCC Countries
21.4.1.2. South Africa
21.4.1.3. Rest of MEA
21.4.2. By Product Type
21.4.3. By Material Type
21.4.4. By Consumer Demographics (% of demand)
21.4.5. By Sales Channel
21.5. Market Attractiveness Analysis
21.5.1. By Country
21.5.2. By Product Type
21.5.3. By Material Type
21.5.4. By Consumer Demographics (% of demand)
21.5.5. By Sales Channel
21.6. Market Trends
21.7. Key Market Participants - Intensity Mapping
21.8. Drivers and Restraints - Impact Analysis
22. Emerging Countries Luxury Women’s Footwear Market Analysis 2014-2021 and Forecast 2022-2029
22.1. Introduction
22.1.1. Market Value Proportion Analysis, By Key Countries
22.1.2. Global Vs. Country Growth Comparison
22.2. China Luxury Women’s Footwear Market Analysis
22.2.1. Introduction
22.2.2. Pricing Analysis
22.2.3. PEST Analysis
22.2.4. Market Value Proportion Analysis by Market Taxonomy
22.2.5. Market Volume (Mn Units) and Value (US$ Mn) Analysis and Forecast by Market Taxonomy
22.2.5.1. By Product Type
22.2.5.2. By Material Type
22.2.5.3. By Consumer Demographics (% of demand)
22.2.5.4. By Sales Channel
22.2.6. China Luxury Women’s Footwear Market - Competition Landscape
22.2.7. China - Trade Analysis
22.3. India Luxury Women’s Footwear Market Analysis
22.3.1. Introduction
22.3.2. Pricing Analysis
22.3.3. PEST Analysis
22.3.4. Market Value Proportion Analysis by Market Taxonomy
22.3.5. Market Volume (Mn Units) and Value (US$ Mn) Analysis and Forecast by Market Taxonomy
22.3.5.1. By Product Type
22.3.5.2. By Material Type
22.3.5.3. By Consumer Demographics (% of demand)
22.3.5.4. By Sales Channel
22.3.6. India Luxury Women’s Footwear Market - Competition Landscape
22.4. Mexico Luxury Women’s Footwear Market Analysis
22.4.1. Introduction
22.4.2. Pricing Analysis
22.4.3. PEST Analysis
22.4.4. Market Value Proportion Analysis by Market Taxonomy
22.4.5. Market Volume (Mn Units) and Value (US$ Mn) Analysis and Forecast by Market Taxonomy
22.4.5.1. By Product Type
22.4.5.2. By Material Type
22.4.5.3. By Consumer Demographics (% of demand)
22.4.5.4. By Sales Channel
22.4.6. Mexico Luxury Women’s Footwear Market - Competition Landscape
23. Market Structure Analysis
23.1. Market Analysis by Tier of Companies (Luxury Women’s Footwear)
23.2. Market Concentration
23.3. Market Share Analysis of Top Players
23.4. Market Presence Analysis
23.4.1. By Regional footprint of Players
23.4.2. Product foot print by Players
23.4.3. Channel Foot Print by Players
24. Competition Analysis
24.1. Competition Dashboard
24.2. Pricing Analysis by Competition
24.3. Competition Benchmarking
24.4. Competition Deep Dive
24.4.1. NIKE, Inc.
24.4.1.1. Overview
24.4.1.2. Product Portfolio
24.4.1.3. Profitability by Market Segments (Product/Channel/Region)
24.4.1.4. Sales Footprint
24.4.1.5. Strategy Overview
24.4.1.5.1. Marketing Strategy
24.4.1.5.2. Product Strategy
24.4.1.5.3. Channel Strategy
24.4.2. Adidas AG
24.4.2.1. Overview
24.4.2.2. Product Portfolio
24.4.2.3. Profitability by Market Segments (Product/Channel/Region)
24.4.2.4. Sales Footprint
24.4.2.5. Strategy Overview
24.4.2.5.1. Marketing Strategy
24.4.2.5.2. Product Strategy
24.4.2.5.3. Channel Strategy
24.4.3. PUMA SE
24.4.3.1. Overview
24.4.3.2. Product Portfolio
24.4.3.3. Profitability by Market Segments (Product/Channel/Region)
24.4.3.4. Sales Footprint
24.4.3.5. Strategy Overview
24.4.3.5.1. Marketing Strategy
24.4.3.5.2. Product Strategy
24.4.3.5.3. Channel Strategy
24.4.4. Skechers U.S.A., Inc.
24.4.4.1. Overview
24.4.4.2. Product Portfolio
24.4.4.3. Profitability by Market Segments (Product/Channel/Region)
24.4.4.4. Sales Footprint
24.4.4.5. Strategy Overview
24.4.4.5.1. Marketing Strategy
24.4.4.5.2. Product Strategy
24.4.4.5.3. Channel Strategy
24.4.5. Under Armour, Inc.
24.4.5.1. Overview
24.4.5.2. Product Portfolio
24.4.5.3. Profitability by Market Segments (Product/Channel/Region)
24.4.5.4. Sales Footprint
24.4.5.5. Strategy Overview
24.4.5.5.1. Marketing Strategy
24.4.5.5.2. Product Strategy
24.4.5.5.3. Channel Strategy
24.4.6. Wolverine World Wide, Inc.
24.4.6.1. Overview
24.4.6.2. Product Portfolio
24.4.6.3. Profitability by Market Segments (Product/Channel/Region)
24.4.6.4. Sales Footprint
24.4.6.5. Strategy Overview
24.4.6.5.1. Marketing Strategy
24.4.6.5.2. Product Strategy
24.4.6.5.3. Channel Strategy
24.4.7. Crocs, Inc.
24.4.7.1. Overview
24.4.7.2. Product Portfolio
24.4.7.3. Profitability by Market Segments (Product/Channel/Region)
24.4.7.4. Sales Footprint
24.4.7.5. Strategy Overview
24.4.7.5.1. Marketing Strategy
24.4.7.5.2. Product Strategy
24.4.7.5.3. Channel Strategy
24.4.8. ASICS Corporation
24.4.8.1. Overview
24.4.8.2. Product Portfolio
24.4.8.3. Profitability by Market Segments (Product/Channel/Region)
24.4.8.4. Sales Footprint
24.4.8.5. Strategy Overview
24.4.8.5.1. Marketing Strategy
24.4.8.5.2. Product Strategy
24.4.8.5.3. Channel Strategy
24.4.9. Deichmann SE
24.4.9.1. Overview
24.4.9.2. Product Portfolio
24.4.9.3. Profitability by Market Segments (Product/Channel/Region)
24.4.9.4. Sales Footprint
24.4.9.5. Strategy Overview
24.4.9.5.1. Marketing Strategy
24.4.9.5.2. Product Strategy
24.4.9.5.3. Channel Strategy
24.4.10. The ALDO Group Inc.
24.4.10.1. Overview
24.4.10.2. Product Portfolio
24.4.10.3. Profitability by Market Segments (Product/Channel/Region)
24.4.10.4. Sales Footprint
24.4.10.5. Strategy Overview
24.4.10.5.1. Marketing Strategy
24.4.10.5.2. Product Strategy
24.4.10.5.3. Channel Strategy
24.4.11. Columbia Sportswear Co.
24.4.11.1. Overview
24.4.11.2. Product Portfolio
24.4.11.3. Profitability by Market Segments (Product/Channel/Region)
24.4.11.4. Sales Footprint
24.4.11.5. Strategy Overview
24.4.11.5.1. Marketing Strategy
24.4.11.5.2. Product Strategy
24.4.11.5.3. Channel Strategy
24.4.12. VF Corporation
24.4.12.1. Overview
24.4.12.2. Product Portfolio
24.4.12.3. Profitability by Market Segments (Product/Channel/Region)
24.4.12.4. Sales Footprint
24.4.12.5. Strategy Overview
24.4.12.5.1. Marketing Strategy
24.4.12.5.2. Product Strategy
24.4.12.5.3. Channel Strategy
24.4.13. New Balance Athletics, Inc.
24.4.13.1. Overview
24.4.13.2. Product Portfolio
24.4.13.3. Profitability by Market Segments (Product/Channel/Region)
24.4.13.4. Sales Footprint
24.4.13.5. Strategy Overview
24.4.13.5.1. Marketing Strategy
24.4.13.5.2. Product Strategy
24.4.13.5.3. Channel Strategy
24.4.14. Bata Limited
24.4.14.1. Overview
24.4.14.2. Product Portfolio
24.4.14.3. Profitability by Market Segments (Product/Channel/Region)
24.4.14.4. Sales Footprint
24.4.14.5. Strategy Overview
24.4.14.5.1. Marketing Strategy
24.4.14.5.2. Product Strategy
24.4.14.5.3. Channel Strategy
24.4.15. Fila Holding S.p.A.
24.4.15.1. Overview
24.4.15.2. Product Portfolio
24.4.15.3. Profitability by Market Segments (Product/Channel/Region)
24.4.15.4. Sales Footprint
24.4.15.5. Strategy Overview
24.4.15.5.1. Marketing Strategy
24.4.15.5.2. Product Strategy
24.4.15.5.3. Channel Strategy
24.4.16. Burberry Group PLC
24.4.16.1. Overview
24.4.16.2. Product Portfolio
24.4.16.3. Profitability by Market Segments (Product/Channel/Region)
24.4.16.4. Sales Footprint
24.4.16.5. Strategy Overview
24.4.16.5.1. Marketing Strategy
24.4.16.5.2. Product Strategy
24.4.16.5.3. Channel Strategy
24.4.17. Michael Kors Holdings Ltd.
24.4.17.1. Overview
24.4.17.2. Product Portfolio
24.4.17.3. Profitability by Market Segments (Product/Channel/Region)
24.4.17.4. Sales Footprint
24.4.17.5. Strategy Overview
24.4.17.5.1. Marketing Strategy
24.4.17.5.2. Product Strategy
24.4.17.5.3. Channel Strategy
24.4.18. Industria de Diseño Textil SA
24.4.18.1. Overview
24.4.18.2. Product Portfolio
24.4.18.3. Profitability by Market Segments (Product/Channel/Region)
24.4.18.4. Sales Footprint
24.4.18.5. Strategy Overview
24.4.18.5.1. Marketing Strategy
24.4.18.5.2. Product Strategy
24.4.18.5.3. Channel Strategy
24.4.19. Kathmandu Holdings Limited
24.4.19.1. Overview
24.4.19.2. Product Portfolio
24.4.19.3. Profitability by Market Segments (Product/Channel/Region)
24.4.19.4. Sales Footprint
24.4.19.5. Strategy Overview
24.4.19.5.1. Marketing Strategy
24.4.19.5.2. Product Strategy
24.4.19.5.3. Channel Strategy
24.4.20. Jack Wolfskin GmbH & Co
24.4.20.1. Overview
24.4.20.2. Product Portfolio
24.4.20.3. Profitability by Market Segments (Product/Channel/Region)
24.4.20.4. Sales Footprint
24.4.20.5. Strategy Overview
24.4.20.5.1. Marketing Strategy
24.4.20.5.2. Product Strategy
24.4.20.5.3. Channel Strategy
24.4.21. W. L. Gore & Associates, Inc
24.4.21.1. Overview
24.4.21.2. Product Portfolio
24.4.21.3. Profitability by Market Segments (Product/Channel/Region)
24.4.21.4. Sales Footprint
24.4.21.5. Strategy Overview
24.4.21.5.1. Marketing Strategy
24.4.21.5.2. Product Strategy
24.4.21.5.3. Channel Strategy
24.4.22. Polartec, LLC
24.4.22.1. Overview
24.4.22.2. Product Portfolio
24.4.22.3. Profitability by Market Segments (Product/Channel/Region)
24.4.22.4. Sales Footprint
24.4.22.5. Strategy Overview
24.4.22.5.1. Marketing Strategy
24.4.22.5.2. Product Strategy
24.4.22.5.3. Channel Strategy
24.4.23. Sympatex Technologies GmbH
24.4.23.1. Overview
24.4.23.2. Product Portfolio
24.4.23.3. Profitability by Market Segments (Product/Channel/Region)
24.4.23.4. Sales Footprint
24.4.23.5. Strategy Overview
24.4.23.5.1. Marketing Strategy
24.4.23.5.2. Product Strategy
24.4.23.5.3. Channel Strategy
24.4.24. Aerogroup International, LLC
24.4.24.1. Overview
24.4.24.2. Product Portfolio
24.4.24.3. Profitability by Market Segments (Product/Channel/Region)
24.4.24.4. Sales Footprint
24.4.24.5. Strategy Overview
24.4.24.5.1. Marketing Strategy
24.4.24.5.2. Product Strategy
24.4.24.5.3. Channel Strategy
24.4.25. Avia, Inc.
24.4.25.1. Overview
24.4.25.2. Product Portfolio
24.4.25.3. Profitability by Market Segments (Product/Channel/Region)
24.4.25.4. Sales Footprint
24.4.25.5. Strategy Overview
24.4.25.5.1. Marketing Strategy
24.4.25.5.2. Product Strategy
24.4.25.5.3. Channel Strategy
24.4.26. Brinley Co.
24.4.26.1. Overview
24.4.26.2. Product Portfolio
24.4.26.3. Profitability by Market Segments (Product/Channel/Region)
24.4.26.4. Sales Footprint
24.4.26.5. Strategy Overview
24.4.26.5.1. Marketing Strategy
24.4.26.5.2. Product Strategy
24.4.26.5.3. Channel Strategy
24.4.27. Edelman Shoe, Inc.
24.4.27.1. Overview
24.4.27.2. Product Portfolio
24.4.27.3. Profitability by Market Segments (Product/Channel/Region)
24.4.27.4. Sales Footprint
24.4.27.5. Strategy Overview
24.4.27.5.1. Marketing Strategy
24.4.27.5.2. Product Strategy
24.4.27.5.3. Channel Strategy
24.4.28. R.G. Barry Corporation
24.4.28.1. Overview
24.4.28.2. Product Portfolio
24.4.28.3. Profitability by Market Segments (Product/Channel/Region)
24.4.28.4. Sales Footprint
24.4.28.5. Strategy Overview
24.4.28.5.1. Marketing Strategy
24.4.28.5.2. Product Strategy
24.4.28.5.3. Channel Strategy
24.4.29. Catwalk Worldwide Pvt. Ltd.
24.4.29.1. Overview
24.4.29.2. Product Portfolio
24.4.29.3. Profitability by Market Segments (Product/Channel/Region)
24.4.29.4. Sales Footprint
24.4.29.5. Strategy Overview
24.4.29.5.1. Marketing Strategy
24.4.29.5.2. Product Strategy
24.4.29.5.3. Channel Strategy
24.4.30. Bacca Bucci Fashions Pvt. Ltd.
24.4.30.1. Overview
24.4.30.2. Product Portfolio
24.4.30.3. Profitability by Market Segments (Product/Channel/Region)
24.4.30.4. Sales Footprint
24.4.30.5. Strategy Overview
24.4.30.5.1. Marketing Strategy
24.4.30.5.2. Product Strategy
24.4.30.5.3. Channel Strategy
24.4.31. Sarah Flint
24.4.31.1. Overview
24.4.31.2. Product Portfolio
24.4.31.3. Profitability by Market Segments (Product/Channel/Region)
24.4.31.4. Sales Footprint
24.4.31.5. Strategy Overview
24.4.31.5.1. Marketing Strategy
24.4.31.5.2. Product Strategy
24.4.31.5.3. Channel Strategy
* Comprehensive Analysis For Top 15 Players, Rest One Page Analysis Will Be Provided
25. Assumptions and Acronyms Used
26. Research Methodology
Let us know your requirement to get
100% FREE customization
List of Tables
Table 01: Global Luxury Women's Footwear Market Value (US$ Mn) Forecast, By Product Type, 2014–2029
Table 02: Global Luxury Women's Footwear Market Volume (‘000 Units) Forecast, By Product Type, 2014–2029
Table 03: Global Luxury Women's Footwear Market Value (US$ Mn) Forecast, By Material Type, 2014–2029
Table 04: Global Luxury Women's Footwear Market Volume (‘000 Units) Forecast, By Material Type, 2014–2029
Table 05: Global Luxury Women's Footwear Market Value (US$ Mn) Forecast, By Price Range (US$), 2014–2029
Table 06: Global Luxury Women's Footwear Market Volume (‘000 Units) Forecast, By Price Range (US$), 2014–2029
Table 07: Global Luxury Women's Footwear Market Value (US$ Mn) Forecast, By Sales Channel, 2014–2029
Table 08: Global Luxury Women's Footwear Market Volume (‘000 Units) Forecast, By Sales Channel, 2014–2029
Table 09: Global Luxury Women's Footwear Market Value (US$ Mn) Forecast, By Region, 2014–2029
Table 10: Global Luxury Women's Footwear Market Volume (‘000 Units) Forecast, By Region, 2014–2029
Table 11: North America Luxury Women's Footwear Market Value (US$ Mn) Forecast, By Country, 2014–2029
Table 12: North America Luxury Women's Footwear Market Volume ('000 Units) Forecast, By Country, 2014–2029
Table 13: North America Luxury Women's Footwear Market Value (US$ Mn) Forecast, By Product Type, 2014–2029
Table 14: North America Luxury Women's Footwear Market Volume (‘000 Units) Forecast, By Product Type, 2014–2029
Table 15: North America Luxury Women's Footwear Market Value (US$ Mn) Forecast, By Material Type, 2014–2029
Table 16: North America Luxury Women's Footwear Market Volume (‘000 Units) Forecast, By Material Type, 2014–2029
Table 17: North America Luxury Women's Footwear Market Value (US$ Mn) Forecast, By Price Range (US$), 2014–2029
Table 18: North America Luxury Women's Footwear Market Volume (‘000 Units) Forecast, By Price Range (US$), 2014–2029
Table 19: North America Luxury Women's Footwear Market Value (US$ Mn) Forecast, By Sales Channel, 2014–2029
Table 20: North America Luxury Women's Footwear Market Volume (‘000 Units) Forecast, By Sales Channel, 2014–2029
Table 21: Latin America Luxury Women's Footwear Market Value (US$ Mn) Forecast, By Country, 2014–2029
Table 22: Latin America Luxury Women's Footwear Market Volume ('000 Units) Forecast, By Country, 2014–2029
Table 23: Latin America Luxury Women's Footwear Market Value (US$ Mn) Forecast, By Product Type, 2014–2029
Table 24: Latin America Luxury Women's Footwear Market Volume (‘000 Units) Forecast, By Product Type, 2014–2029
Table 25: Latin America Luxury Women's Footwear Market Value (US$ Mn) Forecast, By Material Type, 2014–2029
Table 26: Latin America Luxury Women's Footwear Market Volume (‘000 Units) Forecast, By Material Type, 2014–2029
Table 27: Latin America Luxury Women's Footwear Market Value (US$ Mn) Forecast, By Price Range (US$), 2014–2029
Table 28: Latin America Luxury Women's Footwear Market Volume (‘000 Units) Forecast, By Price Range (US$), 2014–2029
Table 29: Latin America Luxury Women's Footwear Market Value (US$ Mn) Forecast, By Sales Channel, 2014–2029
Table 30: Latin America Luxury Women's Footwear Market Volume (‘000 Units) Forecast, By Sales Channel, 2014–2029
Table 31: Europe Luxury Women's Footwear Market Value (US$ Mn) Forecast, By Country, 2014–2029
Table 32: Europe Luxury Women's Footwear Market Volume (‘000 Units) Forecast, By Country, 2014–2029
Table 33: Europe Luxury Women's Footwear Market Value (US$ Mn) Forecast, By Product Type, 2014–2029
Table 34: Europe Luxury Women's Footwear Market Volume (‘000 Units) Forecast, By Product Type, 2014–2029
Table 35: Europe Luxury Women's Footwear Market Value (US$ Mn) Forecast, By Material Type, 2014–2029
Table 36: Europe Luxury Women's Footwear Market Volume (‘000 Units) Forecast, By Material Type, 2014–2029
Table 37: Europe Luxury Women's Footwear Market Value (US$ Mn) Forecast, By Price Range (US$), 2014–2029
Table 38: Europe Luxury Women's Footwear Market Volume (‘000 Units) Forecast, By Price Range (US$), 2014–2029
Table 39: Europe Luxury Women's Footwear Market Value (US$ Mn) Forecast, By Sales Channel, 2014–2029
Table 40: Europe Luxury Women's Footwear Market Volume (‘000 Units) Forecast, By Sales Channel, 2014–2029
Table 41: South Asia Luxury Women's Footwear Market Value (US$ Mn) Forecast, By Country, 2014–2029
Table 42: South Asia Luxury Women's Footwear Market Volume ('000 Units) Forecast, By Country, 2014–2029
Table 43: South Asia Luxury Women's Footwear Market Value (US$ Mn) Forecast, By Product Type, 2014–2029
Table 44: South Asia Luxury Women's Footwear Market Volume (‘000 Units) Forecast, By Product Type, 2014–2029
Table 45: South Asia Luxury Women's Footwear Market Value (US$ Mn) Forecast, By Material Type, 2014–2029
Table 46: South Asia Luxury Women's Footwear Market Volume (‘000 Units) Forecast, By Material Type, 2014–2029
Table 47: South Asia Luxury Women's Footwear Market Value (US$ Mn) Forecast, By Price Range (US$), 2014–2029
Table 48: South Asia Luxury Women's Footwear Market Volume (‘000 Units) Forecast, By Price Range (US$), 2014–2029
Table 49: South Asia Luxury Women's Footwear Market Value (US$ Mn) Forecast, By Sales Channel, 2014–2029
Table 50: South Asia Luxury Women's Footwear Market Volume (‘000 Units) Forecast, By Sales Channel, 2014–2029
Table 51: East Asia Luxury Women's Footwear Market Value (US$ Mn) Forecast, By Country, 2014–2029
Table 52: East Asia Luxury Women's Footwear Market Volume ('000 Units) Forecast, By Country, 2014–2029
Table 53: East Asia Luxury Women's Footwear Market Value (US$ Mn) Forecast, By Product Type, 2014–2029
Table 54: East Asia Luxury Women's Footwear Market Volume (‘000 Units) Forecast, By Product Type, 2014–2029
Table 55: East Asia Luxury Women's Footwear Market Value (US$ Mn) Forecast, By Material Type, 2014–2029
Table 56: East Asia Luxury Women's Footwear Market Volume (‘000 Units) Forecast, By Material Type, 2014–2029
Table 57: East Asia Luxury Women's Footwear Market Value (US$ Mn) Forecast, By Price Range (US$), 2014–2029
Table 58: East Asia Luxury Women's Footwear Market Volume (‘000 Units) Forecast, By Price Range (US$), 2014–2029
Table 59: East Asia Luxury Women's Footwear Market Value (US$ Mn) Forecast, By Sales Channel, 2014–2029
Table 60: East Asia Luxury Women's Footwear Market Volume (‘000 Units) Forecast, By Sales Channel, 2014–2029
Table 61: Oceania Luxury Women's Footwear Market Value (US$ Mn) Forecast, By Country, 2014–2029
Table 62: Oceania Luxury Women's Footwear Market Volume ('000 Units) Forecast, By Country, 2014–2029
Table 63: Oceania Luxury Women's Footwear Market Value (US$ Mn) Forecast, By Product Type, 2014–2029
Table 64: Oceania Luxury Women's Footwear Market Volume (‘000 Units) Forecast, By Product Type, 2014–2029
Table 65: Oceania Luxury Women's Footwear Market Value (US$ Mn) Forecast, By Material Type, 2014–2029
Table 66: Oceania Luxury Women's Footwear Market Volume (‘000 Units) Forecast, By Material Type, 2014–2029
Table 67: Oceania Luxury Women's Footwear Market Value (US$ Mn) Forecast, By Price Range (US$), 2014–2029
Table 68: Oceania Luxury Women's Footwear Market Volume (‘000 Units) Forecast, By Price Range (US$), 2014–2029
Table 69: Oceania Luxury Women's Footwear Market Value (US$ Mn) Forecast, By Sales Channel, 2014–2029
Table 70: Oceania Luxury Women's Footwear Market Volume (‘000 Units) Forecast, By Sales Channel, 2014–2029
Table 71: Middle East and Africa Luxury Women's Footwear Market Value (US$ Mn) Forecast, By Country, 2014–2029
Table 72: Middle East and Africa Luxury Women's Footwear Market Volume ('000 Units) Forecast, By Country, 2014–2029
Table 73: Middle East and Africa Luxury Women's Footwear Market Value (US$ Mn) Forecast, By Product Type, 2014–2029
Table 74: Middle East and Africa Luxury Women's Footwear Market Volume (‘000 Units) Forecast, By Product Type, 2014–2029
Table 75: Middle East and Africa Luxury Women's Footwear Market Value (US$ Mn) Forecast, By Material Type, 2014–2029
Table 76: Middle East and Africa Luxury Women's Footwear Market Volume (‘000 Units) Forecast, By Material Type, 2014–2029
Table 77: Middle East and Africa Luxury Women's Footwear Market Value (US$ Mn) Forecast, By Price Range (US$), 2014–2029
Table 78: Middle East and Africa Luxury Women's Footwear Market Volume (‘000 Units) Forecast, By Price Range (US$), 2014–2029
Table 79: Middle East and Africa Luxury Women's Footwear Market Value (US$ Mn) Forecast, By Sales Channel, 2014–2029
Table 80: Middle East and Africa Luxury Women's Footwear Market Volume (‘000 Units) Forecast, By Sales Channel, 2014–2029
Find your sweet spots for generating winning opportunities in this market.
Talk to AnalystList of Charts
Figure 01: Luxury Women's Footwear Market Volume (‘000 Units) Analysis, 2014–2021
Figure 02: Luxury Women's Footwear Market Volume (‘000 Units) Forecast, 2022–2029
Figure 03: Global Luxury Women's Footwear Market Value (US$ Mn), 2014-2021
Figure 04: Global Luxury Women's Footwear Market Absolute $ Opportunity Value (US$ Mn), 2022-2029
Figure 05: Global Luxury Women's Footwear Market Value (US$ Mn) Forecast, 2022-2029
Figure 06: Global Luxury Women's Footwear Market Value (US$ Mn) Analysis by Product Type, 2014-2029
Figure 07: Global Luxury Women's Footwear Market Volume ('000 Units) Analysis by Product Type, 2014-2029
Figure 08: Global Luxury Women's Footwear Market Y-o-Y Growth (%) Projections, By Product Type, 2022–2029
Figure 09: Global Luxury Women's Footwear Market Attractiveness by Product Type, 2022–2029
Figure 10: Global Luxury Women's Footwear Market Value (US$ Mn) Analysis by Material Type, 2014-2029
Figure 11: Global Luxury Women's Footwear Market Volume (‘000 Units) Analysis by Material Type, 2014-2029
Figure 12: Global Luxury Women's Footwear Market Y-o-Y Growth (%) Projections, By Product Type, 2022–2029
Figure 13: Global Luxury Women's Footwear Market Attractiveness by Product Type, 2022–2029
Figure 14: Global Luxury Women's Footwear Market Value (US$ Mn) Analysis by Price Range (US$), 2014-2029
Figure 15: Global Luxury Women's Footwear Market Volume (‘000 Units) Analysis by Price Range (US$), 2014-2029
Figure 16: Global Luxury Women's Footwear Market Y-o-Y Growth (%) Projections, By Price Range (US$), 2022–2029
Figure 17: Global Luxury Women's Footwear Market Attractiveness by Price Range (US$), 2022–2029
Figure 18: Global Luxury Women's Footwear Market Value (US$ Mn) Analysis by Sales Channel, 2014-2029
Figure 19: Global Luxury Women's Footwear Market Volume ('000 Units) Analysis by Sales Channel, 2014-2029
Figure 20: Global luxury women's footwear Market Y-o-Y Growth (%) Projections, By Sales Channel, 2022–2029
Figure 21: Global Luxury Women's Footwear Market Attractiveness by Sales Channel, 2022–2029
Figure 22: Global Luxury Women's Footwear Market Value (US$ Mn) Analysis by Region, 2014-2029
Figure 23: Global Luxury Women's Footwear Market Volume (‘000 Units) Analysis by Region, 2014-2029
Figure 24: Global luxury women's footwear Market Y-o-Y Growth (%) Projections, By Region, 2022–2029
Figure 25: Global luxury women's footwear Market Attractiveness by Region, 2022–2029
Figure 26: North America Luxury Women's Footwear Market Value (US$ Mn) by Country, 2022-2029
Figure 27: North America Luxury Women's Footwear Market Volume (‘000 Units) by Country, 2022-2029
Figure 28: North America Luxury Women's Footwear Market Y-o-y Growth (%) Projections by Country, 2022-2029
Figure 29: North America Luxury Women's Footwear Market Attractiveness by Country, 2022-2029
Figure 30: North America Luxury Women's Footwear Market Attractiveness Index by Product Type, 2022-2029
Figure 31: North America Luxury Women's Footwear Market Attractiveness Index by Material Type, 2022-2029
Figure 32: North America Luxury Women's Footwear Market Attractiveness Index by Price Range (US$), 2022-2029
Figure 33: North America Luxury Women's Footwear Market Attractiveness Index by Sales Channel, 2022-2029
Figure 34: Latin America Luxury Women's Footwear Market Value (US$ Mn) by Country, 2022-2029
Figure 35: Latin America Luxury Women's Footwear Market Volume ('000 Units) by Country, 2022-2029
Figure 36: Latin America Luxury Women's Footwear Market Y-o-Y Growth (%) Projections by Country, 2022-2029
Figure 37: Latin America Luxury Women's Footwear Market Attractiveness by Country, 2022-2029
Figure 38: Latin America Luxury Women's Footwear Market Attractiveness Index by Product Type, 2022-2029
Figure 39: Latin America Luxury Women's Footwear Market Attractiveness Index by Material Type, 2022-2029
Figure 40: Latin America Luxury Women's Footwear Market Attractiveness Index by Price Range (US$), 2022-2029
Figure 41: Latin America Luxury Women's Footwear Market Attractiveness Index by Sales Channel, 2022-2029
Figure 42: Europe Luxury Women's Footwear Market Value (US$ Mn) by Country, 2022-2029
Figure 43: Europe Luxury Women's Footwear Market Volume ('000 Units) by Country, 2022-2029
Figure 44: Europe luxury women's footwear Market Y-o-Y Growth (%) Projections by Country, 2022-2029
Figure 45: Europe luxury women's footwear Market Attractiveness by Country, 2022-2029
Figure 46: Europe Luxury Women's Footwear Market Attractiveness Index by Product Type, 2022-2029
Figure 47: Europe Luxury Women's Footwear Market Attractiveness Index by Material Type, 2022-2029
Figure 48: Europe Luxury Women's Footwear Market Attractiveness Index by Price Range (US$), 2022-2029
Figure 49: Europe Luxury Women's Footwear Market Attractiveness Index by Sales Channel, 2022-2029
Figure 50: South Asia Luxury Women's Footwear Market Value (US$ Mn) by Country, 2022-2029
Figure 51: South Asia Luxury Women's Footwear Market Volume ('000 Units) by Country, 2022-2029
Figure 52: South Asia Luxury Women's Footwear Market Y-o-Y Growth (%) Projections by Country, 2022-2029
Figure 53: South Asia Luxury Women's Footwear Market Attractiveness by Country, 2022-2029
Figure 54: South Asia Luxury Women's Footwear Market Attractiveness Index by Product Type, 2022-2029
Figure 55: South Asia Luxury Women's Footwear Market Attractiveness Index by Material Type, 2022-2029
Figure 56: South Asia Luxury Women's Footwear Market Attractiveness Index by Price Range (US$), 2022-2029
Figure 57: South Asia Luxury Women's Footwear Market Attractiveness Index by Sales Channel, 2022-2029
Figure 58: East Asia Luxury Women's Footwear Market Value (US$ Mn) by Country, 2022-2029
Figure 59: East Asia Luxury Women's Footwear Market Volume ('000 Units) by Country, 2022-2029
Figure 60: East Asia Luxury Women's Footwear Market Y-o-Y Growth (%) Projections by Country, 2022-2029
Figure 61: East Asia Luxury Women's Footwear Market Attractiveness by Country, 2022-2029
Figure 62: East Asia Luxury Women's Footwear Market Attractiveness Index by Product Type, 2022-2029
Figure 63: East Asia Luxury Women's Footwear Market Attractiveness Index By Material Type, 2022-2029
Figure 64: East Asia Luxury Women's Footwear Market Attractiveness Index by Price Range (US$), 2022-2029
Figure 65: East Asia Luxury Women's Footwear Market Attractiveness Index by Sales Channel, 2022-2029
Figure 66: Oceania Luxury Women's Footwear Market Value (US$ Mn) by Country, 2022-2029
Figure 67: Oceania Luxury Women's Footwear Market Volume ('000 Units) By Country, 2022-2029
Figure 68: Oceania Luxury Women's Footwear Market Y-o-Y Growth (%) Projections by Country, 2022-2029
Figure 69: Oceania Luxury Women's Footwear Market Attractiveness by Country, 2022-2029
Figure 70: Oceania Luxury Women's Footwear Market Attractiveness Index by Product Type, 2022-2029
Figure 71: Oceania Luxury Women's Footwear Market Attractiveness Index by Material Type, 2022-2029
Figure 72: Oceania Luxury Women's Footwear Market Attractiveness Index by Price Range (US$), 2022-2029
Figure 73: Oceania Luxury Women's Footwear Market Attractiveness Index by Sales Channel, 2022-2029
Figure 74: Middle East and Africa Luxury Women's Footwear Market Value (US$ Mn) by Country, 2022-2029
Figure 75: Middle East and Africa Luxury Women's Footwear Market Volume ('000 Units) by Country, 2022-2029
Figure 76 : Middle East and Africa Luxury Women's Footwear Market Y-o-Y Growth (%) Projections by Country, 2022-2029
Figure 77: Middle East and Africa Luxury Women's Footwear Market Attractiveness by Country, 2022-2029
Figure 78: Middle East and Africa Luxury Women's Footwear Market Attractiveness Index by Product Type, 2022-2029
Figure 79: Middle East and Africa Luxury Women's Footwear Market Attractiveness Index by Material Type , 2022-2029
Figure 80: Middle East and Africa Luxury Women's Footwear Market Attractiveness Index by Price Range (US$), 2022-2029
Figure 81: Middle East and Africa Luxury Women's Footwear Market Attractiveness Index by Sales Channel, 2022-2029
Need specific information?
Request CustomizationExplore Consumer Product Insights
View Reports