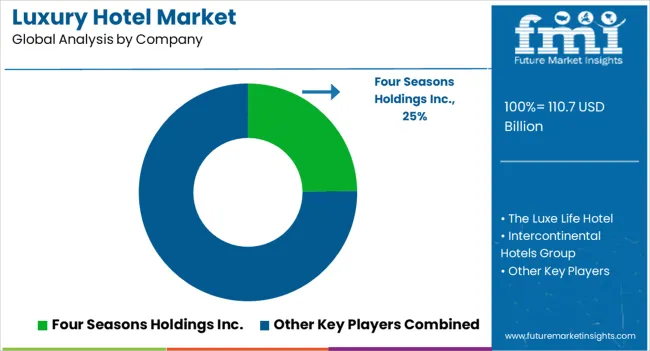
Luxury Hotel Market
Luxury Hotels are Setting Up New Standards for Quality Experience: Check Out the Opportunities with FMI
Luxury Hotel Market by Type, Room Type, Category & Region- Forecast 2022 – 2032
Luxury Hotel Market (2022-2032)
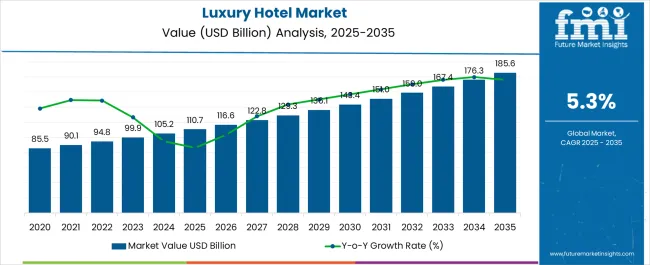
[324 Pages Report] According to Future Market Insights (FMI), the luxury hotel market is estimated at US$ 95,113 million in 2022 and is projected to reach US$ 160,481.2 million by 2032, at an anticipated CAGR of 5.0 % from 2022 to 2032.
The luxury hotel market has been supported in large part by the desire for lavish lodging from vacationing families and corporate travelers. Additionally, luxury hotels are always enhancing the caliber of their offerings to attract guests, from the layout of their rooms and menus to the inclusion of spas, fitness centers, swimming pools, and laundry services.
Moreover, the expansion of the global luxury hotel market is further fueled by the rise of the travel and tourism sector, an increase in consumer desire for leisure travel, and changes in standard of living.
Attribute |
Details |
Luxury Hotel Market Valuation (2022) |
US$ 95,113 Million |
Luxury Hotel Market Projected Size (2032) |
US$ 160,481.2 Million |
Luxury Hotel Market Anticipated CAGR (2022-2032) |
5.0% |
However, high prices limit market expansion. On the other side, people's increased desire to partake in novel forms of entertainment and adventure is likely to open up new chances. The demand for luxury hotels is anticipated to rise as a result of emerging technology and the rapid rise in prosperous individuals around the globe.
Let us know your requirement to get
100% FREE customization
What Factors are Upscaling the Demand for Luxury Hotels?
Marketing Bravura
The global luxury hotel business benefits greatly from creativity in new marketing initiatives, as it develops a strong brand identity and increases investment in internet advertising. As travelers find it to be incredibly relaxing and peaceful, more tourists are choosing to live the high life while on vacation or during the holidays.
This is increasingly being done by elderly and newlyweds, who describe their trip as a once-in-a-lifetime experience. All of this can be related to how the luxury hotels are portrayed to the target market and potential guests.
Increased Per Capita Income
Additionally, it is anticipated that a rise in per capita income is likely to significantly boost the demand for luxury hotels. The customer is willing to get a hang of how it feels to be served in such hotels, and to experience it, he is willing to spend the required amount.
Hot Favorite Among VIPs and Celebrities
VIPs and several other celebrities are designed to live opulent lives and travel in grandeur. This is evident from the fact that they would only stay in five-star hotels while traveling.
Furthermore, a common person is inspired by their style of life and strives to match it, which causes a predicted rise in demand for luxury hotels.
National and international events
There are certain national and international events that are conducted by government and various corporate bodies. The speakers in such events are usually respected and noted personalities, and the hosts do everything from their side to make the best possible arrangements for their visit. In such cases, they only turn towards luxury hotels for all the benefits they provide. Going forward, this might well increase the luxury hotel market share.
How New Opportunities are Striving to Reduce Threats in the Luxury Hotel Market?
Threat |
Emerging Opportunity |
High Prices High room charges at five-star hotels and the rise of affordable shared lodging platforms like Airbnb in low-income nations are expected to hinder market expansion. The growth of the luxury hotel business would also be impeded by the abundance of low- and middle-range lodging options worldwide. |
The luxury hotels would want to stay in touch with their current clients in order to overcome this threat. It is a niche market, thus the goal is to concentrate more on a small number of customers. For this reason, luxury hotels are creating a number of programs, membership cards, and promotions to entice new customers and retain their existing clientele, ultimately growing their market share. |
Lack of interest by the potential customer There is a potential that a client who can afford the services of a luxury hotel chooses not to use them. They don't want to use such ostentatious services, and are instead seeking a basic boarding facility. |
To combat this threat, luxury hotels can offer excessive service. The shift in customer preference for pricey travel, experiences, and comfort are the main causes behind the development in the demand for luxury hotels. The customer is prepared to shell out the necessary sum in order to experience what it's like to be served at such hotels. |
Available only at select places Only major cities have access to the finest hotels. The rationale is that these locations are the only ones where the goods and services needed to run these hotels are offered. This results in the fact that such luxurious hotels are not present throughout a country, creating a shortage. |
Luxury hotel operators must conduct extensive research and invest heavily in order to diversify their offerings and launch new franchise locations around the world. Additionally, the growth of luxury hotels has been significantly impacted by the tourism industry, which also creates new opportunities for the hospitality industry. |
Find your sweet spots for generating winning opportunities in this market.
Talk to AnalystRegional Analysis
“Asia Pacific is the fastest growing region in the luxury hotel market during the forecast period.”
Rapid urbanization, sudden surge in infrastructure development, and swift technological advances are expected to drive the market. Additionally, if we compare the historical data of the disposable income with the current times, there has been an exponential increase in the disposable income. This has ultimately led to people wanting to have new and luxurious experiences. All these factors are expected to have a strong effect on the luxury hotel market outlook.
What is the North America Outlook for the Luxury Hotel Market?
“The luxury hotel market in North America now holds the largest share, and growth is predicted throughout the projection period.”
The market is anticipated to be driven by North America's burgeoning tourism industry and the significant presence of HNIs in the area. Additionally, the natural and technological beauty of the area captivates visitors. Some travelers enjoy staying in luxury hotels, as it gives them a better experience. This is anticipated to have a substantial impact on the outlook for the luxury hotel market in the area.
How is Europe performing in the Luxury Hotel Market?
“The luxury hotel market in Europe, which now holds a sizable share, is anticipated to rise steadily during the anticipated period.”
Europe is mostly known for its adventurous travel, and the area makes it easy to move freely from one nation to another. Additionally, millennials enjoy traveling to the area for its sports and cultural attractions. To make their trip memorable and all-encompassing, many travelers would reserve rooms in upscale accommodations.
Tourists have been much more meticulous about cleanliness since the outbreak. Future developments in the European luxury hotel business are anticipated to benefit from this.
Category-wise Analysis
Which Room Type is Leading in the Luxury Hotel Market?
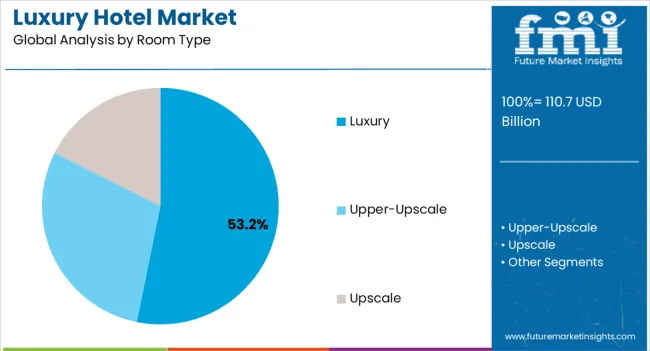
“The upscale segment holds the biggest share in the room type due to substantial offerings and affordable prices.”
In the luxury hotel market, the upscale room type category is growing in popularity. The rationale is that, in comparison to other accommodation categories, these offer reasonably priced luxury services. Moreover, the segment is anticipated to grow during the projection period as it provides the ideal balance between price and service. The quantity and quality of services offered to visitors depend on the size of the room.
Which Type of Hotel has the Highest Share in the Luxury Hotel Market?
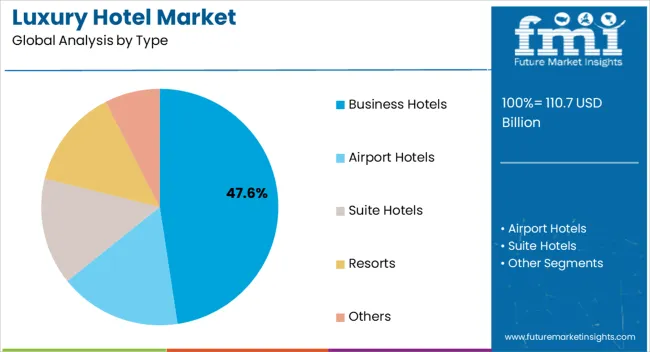
“Business hotels have the highest market share based on the type”
According to type, the business hotels segment accounted for about one-third of the global luxury hotel market and is anticipated to continue holding the top spot throughout the forecast period. As there are numerous business meetings hosted in such hotels, huge corporate organizations typically reserve tickets in quantity.
Which Category Type holds the Highest Share in the Luxury Hotel Market?
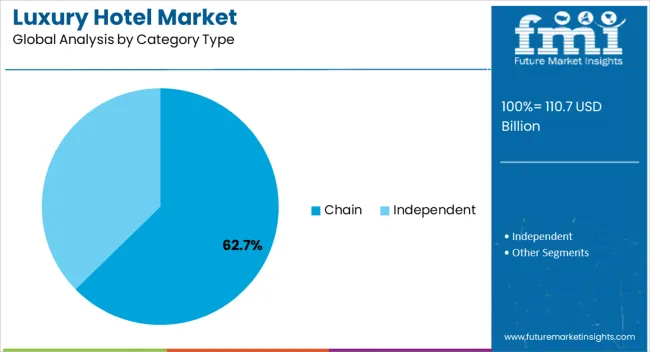
“The chain sector holds the biggest share in the category segment due to affordable prices.”
The chain segment has the largest market share for luxury hotels, according to the category type. The chain hotel segment dominates the market due to the widely dispersed presence of hotels in the chain category on a global scale. The chain hotels in this market are putting their efforts into broadening their horizons and fortifying their positions in promising areas. This is a result of its huge market penetration, broad room inventory, and effective services at competitive rates.

A unified Market Research Subscription Platform, built for today's disparate research needs.
How is the Start-Up Ecosystem performing in the Luxury Hotel Market?
Currently, the key players in the market are focusing on their offerings, whereas the start-ups are focusing on managing the workforce. The idea is to update the hotel managers and connect them with their workforce without any delay. Some of the other notable start-ups driving the luxury hotel market share are Beekeeper, OYO rooms and Hosco.
- Holidayme: Holidayme was founded in 2013. It started as a customized travel solution. Now, it is serving as a niche travel expert in the Middle East. The venture aims to use technology in a much more effective manner to offer better customization to all its users.
- AvantStay: Avantstay was founded in 2016. It is a technology based rental platform. This start-up mainly serves group travelers to assist them while traveling.
How Does Competition Influence the Luxury Hotel Market Share?
Luxury hotel chains are actively expanding their operations and presence across the nations. To draw guests and solidify their positions, several hotel chains are developing fresh deals and developing distinctive market niches and services. Additionally, they are focusing on the membership cards as well to ensure that the customers remain hooked to their services.
Recent Developments
- In January 2021, Marriott International announced that they would be opening 100 new properties in the Asia Pacific region that year. The goal is to introduce luxury brands and experiences to tourists and visitors in undiscovered locations in the area.
- In March 2020, The Luxe Life Hotel New York, the first branded property under the Luxe Collection umbrella, debuted in New York City. Zeavola Resort in Thailand, Il Tornabuoni in Florence, Eurostars Magnificent Mile in Chicago, CoolRoomsAtocha in Spain, and The Belmont are adding new 4- and 5-star hotels to this list (Dallas).
Key Companies Profiled
- Four Seasons Holdings Inc.
- The Luxe Life Hotel
- Intercontinental Hotels Group
- Marriott International Inc.
- Hyatt Corporation
- ITC Hotels Limited
- Shangri-La International Hotel Management Ltd.
- Jumeirah International LLC
- The Indian Hotel Companies Limited
Marriott International Inc., ITC Hotels Ltd., and Hyatt Corporation are vying to be the best in the world with all guns blazing.
Sustainability is once again at the forefront of the hospitality industry, as a current trend in the luxury hotels. As a logical extension of avoiding disposable plastics, minimizing needless paper consumption through opt-in receipts, and reducing food waste, decisions taken at the hotel management level are being influenced by more extensive ethical and environmental considerations.
For instance, Marriott International declared in August 2019 that all of its properties across the world would no longer have single-use bottles of bath gels and shampoos & conditioners. The hotel chain hopes to cut the amount of plastic used for amenities by around 30% by doing away with the use of such tiny bottles.
Hyatt Corporation, a brand of upscale and executive hotels, is making every effort to give its clients first-rate service. In order to ensure that its customers are mesmerized by its omnipresence, Hyatt Corporation is on a mission to widen its reach.
Hyatt declared in April 2022 that they are concentrating more on emerging countries and have set a target of about 70% growth in India. A multi-brand presence throughout cities is the goal. This action is being taken at a time when more individuals are willing to spend money on luxury vacations, and when South West Asia is expanding rapidly.
Corporate executives frequently book luxurious airport hotels or luxurious city hotels that are conveniently placed, which is another reason why business luxury hotels are growing.
For example, 2L De Blend in Utrecht, Netherlands, won the World Luxury Hotel Awards in the “LUXURY BUSINESS HOTEL” category twice in a row in 2019 and 2020. The 2L De Blend apartment hotel, which opened in October 2018 and is positioned roughly a kilometer from the Utrecht Zuilen train station, allows guests to stay for anywhere between one night and six months.
The location factor has long been emphasized as a success factor in the luxury hotel sector. In comparison to a hotel located in a less significant area, a hotel located in an important location is anticipated to perform well, with the services and amenities being followed.
Even the ITC group is on a mission to expand its presence. In July 2022, ITC hotels had announced that it might come up with two new properties in Gujarat-one in Ahmedabad, and the other in the outskirts of Gandhinagar.
Luxury Hotel Market Segmentation
By Type:
- Business Hotels
- Airport Hotels
- Suite Hotels
- Resorts
- Others
By Room Type:
- Luxury
- Upper-Upscale
- Upscale
By Category Type:
- Chain
- Independent
By Region:
- North America
- Latin America
- Asia Pacific
- MEA
- Europe
Frequently Asked Questions
What is the Growth Outlook for the Luxury Hotel Market?
The luxury hotel market is expected to have a CAGR of 5% during the forecast period.
What is the Luxury Hotel Market Size in 2022?
The luxury hotel market is valued at US$ 95,113 million in 2022.
What is the Expected Valuation of the Luxury Hotel Market by 2032?
The expected market value of the luxury hotel market is US$ 160,481.2 million by 2032.
What are the Main Factors Driving the Luxury Hotel Market?
Increasing disposable income and preference for royal treatment are the main driving factors of the luxury hotel market.
Which Region has the largest Share in the Luxury Hotel Market?
North America holds the largest share in the luxury hotel market.
Table of Content
1. Executive Summary 1.1. Global Market Outlook 1.2. Demand-side Trends 1.3. Supply-side Trends 1.4. Technology Roadmap Analysis 1.5. Analysis and Recommendations 2. Market Overview 2.1. Market Coverage / Taxonomy 2.2. Market Definition / Scope / Limitations 3. Market Background 3.1. Market Dynamics 3.1.1. Drivers 3.1.2. Restraints 3.1.3. Opportunity 3.1.4. Trends 3.2. Scenario Forecast 3.2.1. Demand in Optimistic Scenario 3.2.2. Demand in Likely Scenario 3.2.3. Demand in Conservative Scenario 3.3. Opportunity Map Analysis 3.4. Investment Feasibility Matrix 3.5. PESTLE and Porter’s Analysis 3.6. Regulatory Landscape 3.6.1. By Key Regions 3.6.2. By Key Countries 4. Global Industry: Sector Highlights, Analysis, & Industry Roundup Analysis 2017-2021 and Forecast, 2022-2032 4.1. Historical Market Size Value (US$ Mn) & Volume (Units) Analysis, 2017-2021 4.2. Current and Future Market Size Value (US$ Mn) & Volume (Units) Projections, 2022-2032 4.2.1. Y-o-Y Growth Trend Analysis 4.2.2. Absolute $ Opportunity Analysis 5. Global Industry: Sector Highlights, Analysis, & Industry Roundup Analysis 2017-2021 and Forecast 2022-2032, By Type 5.1. Introduction / Key Findings 5.2. Historical Market Size Value (US$ Mn) & Volume (Units) Analysis By Type, 2017-2021 5.3. Current and Future Market Size Value (US$ Mn) & Volume (Units) Analysis and Forecast By Type, 2022-2032 5.3.1. Business Hotels 5.3.2. Airport Hotels 5.3.3. Suite Hotels 5.3.4. Resorts 5.4. Y-o-Y Growth Trend Analysis By Type, 2017-2021 5.5. Absolute $ Opportunity Analysis By Type, 2022-2032 6. Global Industry: Sector Highlights, Analysis, & Industry Roundup Analysis 2017-2021 and Forecast 2022-2032, By Room Type 6.1. Introduction / Key Findings 6.2. Historical Market Size Value (US$ Mn) & Volume (Units) Analysis By Room Type, 2017-2021 6.3. Current and Future Market Size Value (US$ Mn) & Volume (Units) Analysis and Forecast By Room Type, 2022-2032 6.3.1. Luxury 6.3.2. Upper - Upscale 6.3.3. Upscale 6.4. Y-o-Y Growth Trend Analysis By Room Type, 2017-2021 6.5. Absolute $ Opportunity Analysis By Room Type, 2022-2032 7. Global Industry: Sector Highlights, Analysis, & Industry Roundup Analysis 2017-2021 and Forecast 2022-2032, By Category Type 7.1. Introduction / Key Findings 7.2. Historical Market Size Value (US$ Mn) & Volume (Units) Analysis By Category Type , 2017-2021 7.3. Current and Future Market Size Value (US$ Mn) & Volume (Units) Analysis and Forecast By Category Type , 2022-2032 7.3.1. Chain 7.3.2. Independent 7.4. Y-o-Y Growth Trend Analysis By Category Type , 2017-2021 7.5. Absolute $ Opportunity Analysis By Category Type , 2022-2032 8. Global Industry: Sector Highlights, Analysis, & Industry Roundup Analysis 2017-2021 and Forecast 2022-2032, By Region 8.1. Introduction 8.2. Historical Market Size Value (US$ Mn) & Volume (Units) Analysis By Region, 2017-2021 8.3. Current Market Size Value (US$ Mn) & Volume (Units) Analysis and Forecast By Region, 2022-2032 8.3.1. North America 8.3.2. Latin America 8.3.3. Europe 8.3.4. East Asia 8.3.5. South Asia 8.3.6. Oceania 8.3.7. MEA 8.4. Market Attractiveness Analysis By Region 9. North America Industry: Sector Highlights, Analysis, & Industry Roundup Analysis 2017-2021 and Forecast 2022-2032, By Country 9.1. Historical Market Size Value (US$ Mn) & Volume (Units) Trend Analysis By Market Taxonomy, 2017-2021 9.2. Market Size Value (US$ Mn) & Volume (Units) Forecast By Market Taxonomy, 2022-2032 9.2.1. By Country 9.2.1.1. U.S. 9.2.1.2. Canada 9.2.2. By Type 9.2.3. By Room Type 9.2.4. By Category Type 9.3. Market Attractiveness Analysis 9.3.1. By Country 9.3.2. By Type 9.3.3. By Room Type 9.3.4. By Category Type 9.4. Key Takeaways 10. Latin America Industry: Sector Highlights, Analysis, & Industry Roundup Analysis 2017-2021 and Forecast 2022-2032, By Country 10.1. Historical Market Size Value (US$ Mn) & Volume (Units) Trend Analysis By Market Taxonomy, 2017-2021 10.2. Market Size Value (US$ Mn) & Volume (Units) Forecast By Market Taxonomy, 2022-2032 10.2.1. By Country 10.2.1.1. Brazil 10.2.1.2. Mexico 10.2.1.3. Rest of Latin America 10.2.2. By Type 10.2.3. By Room Type 10.2.4. By Category Type 10.3. Market Attractiveness Analysis 10.3.1. By Country 10.3.2. By Type 10.3.3. By Room Type 10.3.4. By Category Type 10.4. Key Takeaways 11. Europe Industry: Sector Highlights, Analysis, & Industry Roundup Analysis 2017-2021 and Forecast 2022-2032, By Country 11.1. Historical Market Size Value (US$ Mn) & Volume (Units) Trend Analysis By Market Taxonomy, 2017-2021 11.2. Market Size Value (US$ Mn) & Volume (Units) Forecast By Market Taxonomy, 2022-2032 11.2.1. By Country 11.2.1.1. Germany 11.2.1.2. Italy 11.2.1.3. France 11.2.1.4. U.K. 11.2.1.5. Spain 11.2.1.6. Russia 11.2.1.7. BENELUX 11.2.1.8. Rest of Europe 11.2.2. By Type 11.2.3. By Room Type 11.2.4. By Category Type 11.3. Market Attractiveness Analysis 11.3.1. By Country 11.3.2. By Type 11.3.3. By Room Type 11.3.4. By Category Type 11.4. Key Takeaways 12. East Asia Industry: Sector Highlights, Analysis, & Industry Roundup Analysis 2017-2021 and Forecast 2022-2032, By Country 12.1. Historical Market Size Value (US$ Mn) & Volume (Units) Trend Analysis By Market Taxonomy, 2017-2021 12.2. Market Size Value (US$ Mn) & Volume (Units) Forecast By Market Taxonomy, 2022-2032 12.2.1. By Country 12.2.1.1. China 12.2.1.2. Japan 12.2.1.3. South Korea 12.2.2. By Type 12.2.3. By Room Type 12.2.4. By Category Type 12.3. Market Attractiveness Analysis 12.3.1. By Country 12.3.2. By Type 12.3.3. By Room Type 12.3.4. By Category Type 12.4. Key Takeaways 13. South Asia Industry: Sector Highlights, Analysis, & Industry Roundup Analysis 2017-2021 and Forecast 2022-2032, By Country 13.1. Historical Market Size Value (US$ Mn) & Volume (Units) Trend Analysis By Market Taxonomy, 2017-2021 13.2. Market Size Value (US$ Mn) & Volume (Units) Forecast By Market Taxonomy, 2022-2032 13.2.1. By Country 13.2.1.1. India 13.2.1.2. Thailand 13.2.1.3. Malaysia 13.2.1.4. Indonesia 13.2.1.5. Rest of South Asia 13.2.2. By Type 13.2.3. By Room Type 13.2.4. By Category Type 13.3. Market Attractiveness Analysis 13.3.1. By Country 13.3.2. By Type 13.3.3. By Room Type 13.3.4. By Category Type 13.4. Key Takeaways 14. Oceania Industry: Sector Highlights, Analysis, & Industry Roundup Analysis 2017-2021 and Forecast 2022-2032, By Country 14.1. Historical Market Size Value (US$ Mn) & Volume (Units) Trend Analysis By Market Taxonomy, 2017-2021 14.2. Market Size Value (US$ Mn) & Volume (Units) Forecast By Market Taxonomy, 2022-2032 14.2.1. By Country 14.2.1.1. Australia 14.2.1.2. New Zealand 14.2.2. By Type 14.2.3. By Room Type 14.2.4. By Category Type 14.3. Market Attractiveness Analysis 14.3.1. By Country 14.3.2. By Type 14.3.3. By Room Type 14.3.4. By Category Type 14.4. Key Takeaways 15. MEA Industry: Sector Highlights, Analysis, & Industry Roundup Analysis 2017-2021 and Forecast 2022-2032, By Country 15.1. Historical Market Size Value (US$ Mn) & Volume (Units) Trend Analysis By Market Taxonomy, 2017-2021 15.2. Market Size Value (US$ Mn) & Volume (Units) Forecast By Market Taxonomy, 2022-2032 15.2.1. By Country 15.2.1.1. GCC Countries 15.2.1.2. Turkey 15.2.1.3. Israel 15.2.1.4. South Africa 15.2.1.5. Egypt 15.2.1.6. Rest of MEA 15.2.2. By Type 15.2.3. By Room Type 15.2.4. By Category Type 15.3. Market Attractiveness Analysis 15.3.1. By Country 15.3.2. By Type 15.3.3. By Room Type 15.3.4. By Category Type 15.4. Key Takeaways 16. Key Countries Industry: Sector Highlights, Analysis, & Industry Roundup Analysis 16.1. U.S. 16.1.1. Pricing Analysis 16.1.2. Market Share Analysis, 2021 16.1.2.1. By Type 16.1.2.2. By Room Type 16.1.2.3. By Category Type 16.2. Canada 16.2.1. Pricing Analysis 16.2.2. Market Share Analysis, 2021 16.2.2.1. By Type 16.2.2.2. By Room Type 16.2.2.3. By Category Type 16.3. Brazil 16.3.1. Pricing Analysis 16.3.2. Market Share Analysis, 2021 16.3.2.1. By Type 16.3.2.2. By Room Type 16.3.2.3. By Category Type 16.4. Mexico 16.4.1. Pricing Analysis 16.4.2. Market Share Analysis, 2021 16.4.2.1. By Type 16.4.2.2. By Room Type 16.4.2.3. By Category Type 16.5. Argentina 16.5.1. Pricing Analysis 16.5.2. Market Share Analysis, 2021 16.5.2.1. By Type 16.5.2.2. By Room Type 16.5.2.3. By Category Type 16.6. Germany 16.6.1. Pricing Analysis 16.6.2. Market Share Analysis, 2021 16.6.2.1. By Type 16.6.2.2. By Room Type 16.6.2.3. By Category Type 16.7. Italy 16.7.1. Pricing Analysis 16.7.2. Market Share Analysis, 2021 16.7.2.1. By Type 16.7.2.2. By Room Type 16.7.2.3. By Category Type 16.8. France 16.8.1. Pricing Analysis 16.8.2. Market Share Analysis, 2021 16.8.2.1. By Type 16.8.2.2. By Room Type 16.8.2.3. By Category Type 16.9. U.K. 16.9.1. Pricing Analysis 16.9.2. Market Share Analysis, 2021 16.9.2.1. By Type 16.9.2.2. By Room Type 16.9.2.3. By Category Type 16.10. Spain 16.10.1. Pricing Analysis 16.10.2. Market Share Analysis, 2021 16.10.2.1. By Type 16.10.2.2. By Room Type 16.10.2.3. By Category Type 16.11. Russia 16.11.1. Pricing Analysis 16.11.2. Market Share Analysis, 2021 16.11.2.1. By Type 16.11.2.2. By Room Type 16.11.2.3. By Category Type 16.12. BENELUX 16.12.1. Pricing Analysis 16.12.2. Market Share Analysis, 2021 16.12.2.1. By Type 16.12.2.2. By Room Type 16.12.2.3. By Category Type 16.13. China 16.13.1. Pricing Analysis 16.13.2. Market Share Analysis, 2021 16.13.2.1. By Type 16.13.2.2. By Room Type 16.13.2.3. By Category Type 16.14. Japan 16.14.1. Pricing Analysis 16.14.2. Market Share Analysis, 2021 16.14.2.1. By Type 16.14.2.2. By Room Type 16.14.2.3. By Category Type 16.15. South Korea 16.15.1. Pricing Analysis 16.15.2. Market Share Analysis, 2021 16.15.2.1. By Type 16.15.2.2. By Room Type 16.15.2.3. By Category Type 16.16. India 16.16.1. Pricing Analysis 16.16.2. Market Share Analysis, 2021 16.16.2.1. By Type 16.16.2.2. By Room Type 16.16.2.3. By Category Type 16.17. GCC Countries 16.17.1. Pricing Analysis 16.17.2. Market Share Analysis, 2021 16.17.2.1. By Type 16.17.2.2. By Room Type 16.17.2.3. By Category Type 16.18. Turkey 16.18.1. Pricing Analysis 16.18.2. Market Share Analysis, 2021 16.18.2.1. By Type 16.18.2.2. By Room Type 16.18.2.3. By Category Type 16.19. Israel 16.19.1. Pricing Analysis 16.19.2. Market Share Analysis, 2021 16.19.2.1. By Type 16.19.2.2. By Room Type 16.19.2.3. By Category Type 16.20. South Africa 16.20.1. Pricing Analysis 16.20.2. Market Share Analysis, 2021 16.20.2.1. By Type 16.20.2.2. By Room Type 16.20.2.3. By Category Type 16.21. Egypt 16.21.1. Pricing Analysis 16.21.2. Market Share Analysis, 2021 16.21.2.1. By Type 16.21.2.2. By Room Type 16.21.2.3. By Category Type 17. Market Structure Analysis 17.1. Competition Dashboard 17.2. Competition Benchmarking 17.3. Market Share Analysis of Top Players 17.3.1. By Regional 17.3.2. By Type 17.3.3. By Room Type 17.3.4. By Category Type 18. Competition Analysis 18.1. Competition Deep Dive 18.1.1. Four Seasons Holdings Inc. 18.1.1.1. Overview 18.1.1.2. Product Portfolio 18.1.1.3. Profitability by Market Segment 18.1.1.4. Sales Footprint 18.1.1.5. Strategy Overview 18.1.1.5.1. Marketing Strategy 18.1.1.5.2. Product Strategy 18.1.2. Intercontinental Hotels Group 18.1.2.1. Overview 18.1.2.2. Product Portfolio 18.1.2.3. Profitability by Market Segment 18.1.2.4. Sales Footprint 18.1.2.5. Strategy Overview 18.1.2.5.1. Marketing Strategy 18.1.2.5.2. Product Strategy 18.1.3. Marriott International Inc. 18.1.3.1. Overview 18.1.3.2. Product Portfolio 18.1.3.3. Profitability by Market Segment 18.1.3.4. Sales Footprint 18.1.3.5. Strategy Overview 18.1.3.5.1. Marketing Strategy 18.1.3.5.2. Product Strategy 18.1.4. Hyatt Corporation 18.1.4.1. Overview 18.1.4.2. Product Portfolio 18.1.4.3. Profitability by Market Segment 18.1.4.4. Sales Footprint 18.1.4.5. Strategy Overview 18.1.4.5.1. Marketing Strategy 18.1.4.5.2. Product Strategy 18.1.5. ITC Hotels Limited 18.1.5.1. Overview 18.1.5.2. Product Portfolio 18.1.5.3. Profitability by Market Segment 18.1.5.4. Sales Footprint 18.1.5.5. Strategy Overview 18.1.5.5.1. Marketing Strategy 18.1.5.5.2. Product Strategy 18.1.6. Shangri-La International Hotel Management Ltd. 18.1.6.1. Overview 18.1.6.2. Product Portfolio 18.1.6.3. Profitability by Market Segment 18.1.6.4. Sales Footprint 18.1.6.5. Strategy Overview 18.1.6.5.1. Marketing Strategy 18.1.6.5.2. Product Strategy 18.1.7. Jumeirah International LLC 18.1.7.1. Overview 18.1.7.2. Product Portfolio 18.1.7.3. Profitability by Market Segment 18.1.7.4. Sales Footprint 18.1.7.5. Strategy Overview 18.1.7.5.1. Marketing Strategy 18.1.7.5.2. Product Strategy 18.1.8. The Indian Hotel Companies Limited 18.1.8.1. Overview 18.1.8.2. Product Portfolio 18.1.8.3. Profitability by Market Segment 18.1.8.4. Sales Footprint 18.1.8.5. Strategy Overview 18.1.8.5.1. Marketing Strategy 18.1.8.5.2. Product Strategy 19. Assumptions & Acronyms Used 20. Research Methodology
Let us know your requirement to get
100% FREE customization
List of Tables
Table 1: Global Industry: Sector Highlights, Analysis, & Industry Roundup Value (US$ Mn) Forecast by Region, 2017-2032 Table 2: Global Industry: Sector Highlights, Analysis, & Industry Roundup Volume (Units) Forecast by Region, 2017-2032 Table 3: Global Industry: Sector Highlights, Analysis, & Industry Roundup Value (US$ Mn) Forecast by Type, 2017-2032 Table 4: Global Industry: Sector Highlights, Analysis, & Industry Roundup Volume (Units) Forecast by Type, 2017-2032 Table 5: Global Industry: Sector Highlights, Analysis, & Industry Roundup Value (US$ Mn) Forecast by Room Type, 2017-2032 Table 6: Global Industry: Sector Highlights, Analysis, & Industry Roundup Volume (Units) Forecast by Room Type, 2017-2032 Table 7: Global Industry: Sector Highlights, Analysis, & Industry Roundup Value (US$ Mn) Forecast by Category Type , 2017-2032 Table 8: Global Industry: Sector Highlights, Analysis, & Industry Roundup Volume (Units) Forecast by Category Type , 2017-2032 Table 9: North America Industry: Sector Highlights, Analysis, & Industry Roundup Value (US$ Mn) Forecast by Country, 2017-2032 Table 10: North America Industry: Sector Highlights, Analysis, & Industry Roundup Volume (Units) Forecast by Country, 2017-2032 Table 11: North America Industry: Sector Highlights, Analysis, & Industry Roundup Value (US$ Mn) Forecast by Type, 2017-2032 Table 12: North America Industry: Sector Highlights, Analysis, & Industry Roundup Volume (Units) Forecast by Type, 2017-2032 Table 13: North America Industry: Sector Highlights, Analysis, & Industry Roundup Value (US$ Mn) Forecast by Room Type, 2017-2032 Table 14: North America Industry: Sector Highlights, Analysis, & Industry Roundup Volume (Units) Forecast by Room Type, 2017-2032 Table 15: North America Industry: Sector Highlights, Analysis, & Industry Roundup Value (US$ Mn) Forecast by Category Type , 2017-2032 Table 16: North America Industry: Sector Highlights, Analysis, & Industry Roundup Volume (Units) Forecast by Category Type , 2017-2032 Table 17: Latin America Industry: Sector Highlights, Analysis, & Industry Roundup Value (US$ Mn) Forecast by Country, 2017-2032 Table 18: Latin America Industry: Sector Highlights, Analysis, & Industry Roundup Volume (Units) Forecast by Country, 2017-2032 Table 19: Latin America Industry: Sector Highlights, Analysis, & Industry Roundup Value (US$ Mn) Forecast by Type, 2017-2032 Table 20: Latin America Industry: Sector Highlights, Analysis, & Industry Roundup Volume (Units) Forecast by Type, 2017-2032 Table 21: Latin America Industry: Sector Highlights, Analysis, & Industry Roundup Value (US$ Mn) Forecast by Room Type, 2017-2032 Table 22: Latin America Industry: Sector Highlights, Analysis, & Industry Roundup Volume (Units) Forecast by Room Type, 2017-2032 Table 23: Latin America Industry: Sector Highlights, Analysis, & Industry Roundup Value (US$ Mn) Forecast by Category Type , 2017-2032 Table 24: Latin America Industry: Sector Highlights, Analysis, & Industry Roundup Volume (Units) Forecast by Category Type , 2017-2032 Table 25: Europe Industry: Sector Highlights, Analysis, & Industry Roundup Value (US$ Mn) Forecast by Country, 2017-2032 Table 26: Europe Industry: Sector Highlights, Analysis, & Industry Roundup Volume (Units) Forecast by Country, 2017-2032 Table 27: Europe Industry: Sector Highlights, Analysis, & Industry Roundup Value (US$ Mn) Forecast by Type, 2017-2032 Table 28: Europe Industry: Sector Highlights, Analysis, & Industry Roundup Volume (Units) Forecast by Type, 2017-2032 Table 29: Europe Industry: Sector Highlights, Analysis, & Industry Roundup Value (US$ Mn) Forecast by Room Type, 2017-2032 Table 30: Europe Industry: Sector Highlights, Analysis, & Industry Roundup Volume (Units) Forecast by Room Type, 2017-2032 Table 31: Europe Industry: Sector Highlights, Analysis, & Industry Roundup Value (US$ Mn) Forecast by Category Type , 2017-2032 Table 32: Europe Industry: Sector Highlights, Analysis, & Industry Roundup Volume (Units) Forecast by Category Type , 2017-2032 Table 33: East Asia Industry: Sector Highlights, Analysis, & Industry Roundup Value (US$ Mn) Forecast by Country, 2017-2032 Table 34: East Asia Industry: Sector Highlights, Analysis, & Industry Roundup Volume (Units) Forecast by Country, 2017-2032 Table 35: East Asia Industry: Sector Highlights, Analysis, & Industry Roundup Value (US$ Mn) Forecast by Type, 2017-2032 Table 36: East Asia Industry: Sector Highlights, Analysis, & Industry Roundup Volume (Units) Forecast by Type, 2017-2032 Table 37: East Asia Industry: Sector Highlights, Analysis, & Industry Roundup Value (US$ Mn) Forecast by Room Type, 2017-2032 Table 38: East Asia Industry: Sector Highlights, Analysis, & Industry Roundup Volume (Units) Forecast by Room Type, 2017-2032 Table 39: East Asia Industry: Sector Highlights, Analysis, & Industry Roundup Value (US$ Mn) Forecast by Category Type , 2017-2032 Table 40: East Asia Industry: Sector Highlights, Analysis, & Industry Roundup Volume (Units) Forecast by Category Type , 2017-2032 Table 41: South Asia Industry: Sector Highlights, Analysis, & Industry Roundup Value (US$ Mn) Forecast by Country, 2017-2032 Table 42: South Asia Industry: Sector Highlights, Analysis, & Industry Roundup Volume (Units) Forecast by Country, 2017-2032 Table 43: South Asia Industry: Sector Highlights, Analysis, & Industry Roundup Value (US$ Mn) Forecast by Type, 2017-2032 Table 44: South Asia Industry: Sector Highlights, Analysis, & Industry Roundup Volume (Units) Forecast by Type, 2017-2032 Table 45: South Asia Industry: Sector Highlights, Analysis, & Industry Roundup Value (US$ Mn) Forecast by Room Type, 2017-2032 Table 46: South Asia Industry: Sector Highlights, Analysis, & Industry Roundup Volume (Units) Forecast by Room Type, 2017-2032 Table 47: South Asia Industry: Sector Highlights, Analysis, & Industry Roundup Value (US$ Mn) Forecast by Category Type , 2017-2032 Table 48: South Asia Industry: Sector Highlights, Analysis, & Industry Roundup Volume (Units) Forecast by Category Type , 2017-2032 Table 49: Oceania Industry: Sector Highlights, Analysis, & Industry Roundup Value (US$ Mn) Forecast by Country, 2017-2032 Table 50: Oceania Industry: Sector Highlights, Analysis, & Industry Roundup Volume (Units) Forecast by Country, 2017-2032 Table 51: Oceania Industry: Sector Highlights, Analysis, & Industry Roundup Value (US$ Mn) Forecast by Type, 2017-2032 Table 52: Oceania Industry: Sector Highlights, Analysis, & Industry Roundup Volume (Units) Forecast by Type, 2017-2032 Table 53: Oceania Industry: Sector Highlights, Analysis, & Industry Roundup Value (US$ Mn) Forecast by Room Type, 2017-2032 Table 54: Oceania Industry: Sector Highlights, Analysis, & Industry Roundup Volume (Units) Forecast by Room Type, 2017-2032 Table 55: Oceania Industry: Sector Highlights, Analysis, & Industry Roundup Value (US$ Mn) Forecast by Category Type , 2017-2032 Table 56: Oceania Industry: Sector Highlights, Analysis, & Industry Roundup Volume (Units) Forecast by Category Type , 2017-2032 Table 57: MEA Industry: Sector Highlights, Analysis, & Industry Roundup Value (US$ Mn) Forecast by Country, 2017-2032 Table 58: MEA Industry: Sector Highlights, Analysis, & Industry Roundup Volume (Units) Forecast by Country, 2017-2032 Table 59: MEA Industry: Sector Highlights, Analysis, & Industry Roundup Value (US$ Mn) Forecast by Type, 2017-2032 Table 60: MEA Industry: Sector Highlights, Analysis, & Industry Roundup Volume (Units) Forecast by Type, 2017-2032 Table 61: MEA Industry: Sector Highlights, Analysis, & Industry Roundup Value (US$ Mn) Forecast by Room Type, 2017-2032 Table 62: MEA Industry: Sector Highlights, Analysis, & Industry Roundup Volume (Units) Forecast by Room Type, 2017-2032 Table 63: MEA Industry: Sector Highlights, Analysis, & Industry Roundup Value (US$ Mn) Forecast by Category Type , 2017-2032 Table 64: MEA Industry: Sector Highlights, Analysis, & Industry Roundup Volume (Units) Forecast by Category Type , 2017-2032
Find your sweet spots for generating winning opportunities in this market.
Talk to AnalystList of Charts
Figure 1: Global Industry: Sector Highlights, Analysis, & Industry Roundup Value (US$ Mn) by Type, 2022-2032 Figure 2: Global Industry: Sector Highlights, Analysis, & Industry Roundup Value (US$ Mn) by Room Type, 2022-2032 Figure 3: Global Industry: Sector Highlights, Analysis, & Industry Roundup Value (US$ Mn) by Category Type , 2022-2032 Figure 4: Global Industry: Sector Highlights, Analysis, & Industry Roundup Value (US$ Mn) by Region, 2022-2032 Figure 5: Global Industry: Sector Highlights, Analysis, & Industry Roundup Value (US$ Mn) Analysis by Region, 2017-2032 Figure 6: Global Industry: Sector Highlights, Analysis, & Industry Roundup Volume (Units) Analysis by Region, 2017-2032 Figure 7: Global Industry: Sector Highlights, Analysis, & Industry Roundup Value Share (%) and BPS Analysis by Region, 2022-2032 Figure 8: Global Industry: Sector Highlights, Analysis, & Industry Roundup Y-o-Y Growth (%) Projections by Region, 2022-2032 Figure 9: Global Industry: Sector Highlights, Analysis, & Industry Roundup Value (US$ Mn) Analysis by Type, 2017-2032 Figure 10: Global Industry: Sector Highlights, Analysis, & Industry Roundup Volume (Units) Analysis by Type, 2017-2032 Figure 11: Global Industry: Sector Highlights, Analysis, & Industry Roundup Value Share (%) and BPS Analysis by Type, 2022-2032 Figure 12: Global Industry: Sector Highlights, Analysis, & Industry Roundup Y-o-Y Growth (%) Projections by Type, 2022-2032 Figure 13: Global Industry: Sector Highlights, Analysis, & Industry Roundup Value (US$ Mn) Analysis by Room Type, 2017-2032 Figure 14: Global Industry: Sector Highlights, Analysis, & Industry Roundup Volume (Units) Analysis by Room Type, 2017-2032 Figure 15: Global Industry: Sector Highlights, Analysis, & Industry Roundup Value Share (%) and BPS Analysis by Room Type, 2022-2032 Figure 16: Global Industry: Sector Highlights, Analysis, & Industry Roundup Y-o-Y Growth (%) Projections by Room Type, 2022-2032 Figure 17: Global Industry: Sector Highlights, Analysis, & Industry Roundup Value (US$ Mn) Analysis by Category Type , 2017-2032 Figure 18: Global Industry: Sector Highlights, Analysis, & Industry Roundup Volume (Units) Analysis by Category Type , 2017-2032 Figure 19: Global Industry: Sector Highlights, Analysis, & Industry Roundup Value Share (%) and BPS Analysis by Category Type , 2022-2032 Figure 20: Global Industry: Sector Highlights, Analysis, & Industry Roundup Y-o-Y Growth (%) Projections by Category Type , 2022-2032 Figure 21: Global Industry: Sector Highlights, Analysis, & Industry Roundup Attractiveness by Type, 2022-2032 Figure 22: Global Industry: Sector Highlights, Analysis, & Industry Roundup Attractiveness by Room Type, 2022-2032 Figure 23: Global Industry: Sector Highlights, Analysis, & Industry Roundup Attractiveness by Category Type , 2022-2032 Figure 24: Global Industry: Sector Highlights, Analysis, & Industry Roundup Attractiveness by Region, 2022-2032 Figure 25: North America Industry: Sector Highlights, Analysis, & Industry Roundup Value (US$ Mn) by Type, 2022-2032 Figure 26: North America Industry: Sector Highlights, Analysis, & Industry Roundup Value (US$ Mn) by Room Type, 2022-2032 Figure 27: North America Industry: Sector Highlights, Analysis, & Industry Roundup Value (US$ Mn) by Category Type , 2022-2032 Figure 28: North America Industry: Sector Highlights, Analysis, & Industry Roundup Value (US$ Mn) by Country, 2022-2032 Figure 29: North America Industry: Sector Highlights, Analysis, & Industry Roundup Value (US$ Mn) Analysis by Country, 2017-2032 Figure 30: North America Industry: Sector Highlights, Analysis, & Industry Roundup Volume (Units) Analysis by Country, 2017-2032 Figure 31: North America Industry: Sector Highlights, Analysis, & Industry Roundup Value Share (%) and BPS Analysis by Country, 2022-2032 Figure 32: North America Industry: Sector Highlights, Analysis, & Industry Roundup Y-o-Y Growth (%) Projections by Country, 2022-2032 Figure 33: North America Industry: Sector Highlights, Analysis, & Industry Roundup Value (US$ Mn) Analysis by Type, 2017-2032 Figure 34: North America Industry: Sector Highlights, Analysis, & Industry Roundup Volume (Units) Analysis by Type, 2017-2032 Figure 35: North America Industry: Sector Highlights, Analysis, & Industry Roundup Value Share (%) and BPS Analysis by Type, 2022-2032 Figure 36: North America Industry: Sector Highlights, Analysis, & Industry Roundup Y-o-Y Growth (%) Projections by Type, 2022-2032 Figure 37: North America Industry: Sector Highlights, Analysis, & Industry Roundup Value (US$ Mn) Analysis by Room Type, 2017-2032 Figure 38: North America Industry: Sector Highlights, Analysis, & Industry Roundup Volume (Units) Analysis by Room Type, 2017-2032 Figure 39: North America Industry: Sector Highlights, Analysis, & Industry Roundup Value Share (%) and BPS Analysis by Room Type, 2022-2032 Figure 40: North America Industry: Sector Highlights, Analysis, & Industry Roundup Y-o-Y Growth (%) Projections by Room Type, 2022-2032 Figure 41: North America Industry: Sector Highlights, Analysis, & Industry Roundup Value (US$ Mn) Analysis by Category Type , 2017-2032 Figure 42: North America Industry: Sector Highlights, Analysis, & Industry Roundup Volume (Units) Analysis by Category Type , 2017-2032 Figure 43: North America Industry: Sector Highlights, Analysis, & Industry Roundup Value Share (%) and BPS Analysis by Category Type , 2022-2032 Figure 44: North America Industry: Sector Highlights, Analysis, & Industry Roundup Y-o-Y Growth (%) Projections by Category Type , 2022-2032 Figure 45: North America Industry: Sector Highlights, Analysis, & Industry Roundup Attractiveness by Type, 2022-2032 Figure 46: North America Industry: Sector Highlights, Analysis, & Industry Roundup Attractiveness by Room Type, 2022-2032 Figure 47: North America Industry: Sector Highlights, Analysis, & Industry Roundup Attractiveness by Category Type , 2022-2032 Figure 48: North America Industry: Sector Highlights, Analysis, & Industry Roundup Attractiveness by Country, 2022-2032 Figure 49: Latin America Industry: Sector Highlights, Analysis, & Industry Roundup Value (US$ Mn) by Type, 2022-2032 Figure 50: Latin America Industry: Sector Highlights, Analysis, & Industry Roundup Value (US$ Mn) by Room Type, 2022-2032 Figure 51: Latin America Industry: Sector Highlights, Analysis, & Industry Roundup Value (US$ Mn) by Category Type , 2022-2032 Figure 52: Latin America Industry: Sector Highlights, Analysis, & Industry Roundup Value (US$ Mn) by Country, 2022-2032 Figure 53: Latin America Industry: Sector Highlights, Analysis, & Industry Roundup Value (US$ Mn) Analysis by Country, 2017-2032 Figure 54: Latin America Industry: Sector Highlights, Analysis, & Industry Roundup Volume (Units) Analysis by Country, 2017-2032 Figure 55: Latin America Industry: Sector Highlights, Analysis, & Industry Roundup Value Share (%) and BPS Analysis by Country, 2022-2032 Figure 56: Latin America Industry: Sector Highlights, Analysis, & Industry Roundup Y-o-Y Growth (%) Projections by Country, 2022-2032 Figure 57: Latin America Industry: Sector Highlights, Analysis, & Industry Roundup Value (US$ Mn) Analysis by Type, 2017-2032 Figure 58: Latin America Industry: Sector Highlights, Analysis, & Industry Roundup Volume (Units) Analysis by Type, 2017-2032 Figure 59: Latin America Industry: Sector Highlights, Analysis, & Industry Roundup Value Share (%) and BPS Analysis by Type, 2022-2032 Figure 60: Latin America Industry: Sector Highlights, Analysis, & Industry Roundup Y-o-Y Growth (%) Projections by Type, 2022-2032 Figure 61: Latin America Industry: Sector Highlights, Analysis, & Industry Roundup Value (US$ Mn) Analysis by Room Type, 2017-2032 Figure 62: Latin America Industry: Sector Highlights, Analysis, & Industry Roundup Volume (Units) Analysis by Room Type, 2017-2032 Figure 63: Latin America Industry: Sector Highlights, Analysis, & Industry Roundup Value Share (%) and BPS Analysis by Room Type, 2022-2032 Figure 64: Latin America Industry: Sector Highlights, Analysis, & Industry Roundup Y-o-Y Growth (%) Projections by Room Type, 2022-2032 Figure 65: Latin America Industry: Sector Highlights, Analysis, & Industry Roundup Value (US$ Mn) Analysis by Category Type , 2017-2032 Figure 66: Latin America Industry: Sector Highlights, Analysis, & Industry Roundup Volume (Units) Analysis by Category Type , 2017-2032 Figure 67: Latin America Industry: Sector Highlights, Analysis, & Industry Roundup Value Share (%) and BPS Analysis by Category Type , 2022-2032 Figure 68: Latin America Industry: Sector Highlights, Analysis, & Industry Roundup Y-o-Y Growth (%) Projections by Category Type , 2022-2032 Figure 69: Latin America Industry: Sector Highlights, Analysis, & Industry Roundup Attractiveness by Type, 2022-2032 Figure 70: Latin America Industry: Sector Highlights, Analysis, & Industry Roundup Attractiveness by Room Type, 2022-2032 Figure 71: Latin America Industry: Sector Highlights, Analysis, & Industry Roundup Attractiveness by Category Type , 2022-2032 Figure 72: Latin America Industry: Sector Highlights, Analysis, & Industry Roundup Attractiveness by Country, 2022-2032 Figure 73: Europe Industry: Sector Highlights, Analysis, & Industry Roundup Value (US$ Mn) by Type, 2022-2032 Figure 74: Europe Industry: Sector Highlights, Analysis, & Industry Roundup Value (US$ Mn) by Room Type, 2022-2032 Figure 75: Europe Industry: Sector Highlights, Analysis, & Industry Roundup Value (US$ Mn) by Category Type , 2022-2032 Figure 76: Europe Industry: Sector Highlights, Analysis, & Industry Roundup Value (US$ Mn) by Country, 2022-2032 Figure 77: Europe Industry: Sector Highlights, Analysis, & Industry Roundup Value (US$ Mn) Analysis by Country, 2017-2032 Figure 78: Europe Industry: Sector Highlights, Analysis, & Industry Roundup Volume (Units) Analysis by Country, 2017-2032 Figure 79: Europe Industry: Sector Highlights, Analysis, & Industry Roundup Value Share (%) and BPS Analysis by Country, 2022-2032 Figure 80: Europe Industry: Sector Highlights, Analysis, & Industry Roundup Y-o-Y Growth (%) Projections by Country, 2022-2032 Figure 81: Europe Industry: Sector Highlights, Analysis, & Industry Roundup Value (US$ Mn) Analysis by Type, 2017-2032 Figure 82: Europe Industry: Sector Highlights, Analysis, & Industry Roundup Volume (Units) Analysis by Type, 2017-2032 Figure 83: Europe Industry: Sector Highlights, Analysis, & Industry Roundup Value Share (%) and BPS Analysis by Type, 2022-2032 Figure 84: Europe Industry: Sector Highlights, Analysis, & Industry Roundup Y-o-Y Growth (%) Projections by Type, 2022-2032 Figure 85: Europe Industry: Sector Highlights, Analysis, & Industry Roundup Value (US$ Mn) Analysis by Room Type, 2017-2032 Figure 86: Europe Industry: Sector Highlights, Analysis, & Industry Roundup Volume (Units) Analysis by Room Type, 2017-2032 Figure 87: Europe Industry: Sector Highlights, Analysis, & Industry Roundup Value Share (%) and BPS Analysis by Room Type, 2022-2032 Figure 88: Europe Industry: Sector Highlights, Analysis, & Industry Roundup Y-o-Y Growth (%) Projections by Room Type, 2022-2032 Figure 89: Europe Industry: Sector Highlights, Analysis, & Industry Roundup Value (US$ Mn) Analysis by Category Type , 2017-2032 Figure 90: Europe Industry: Sector Highlights, Analysis, & Industry Roundup Volume (Units) Analysis by Category Type , 2017-2032 Figure 91: Europe Industry: Sector Highlights, Analysis, & Industry Roundup Value Share (%) and BPS Analysis by Category Type , 2022-2032 Figure 92: Europe Industry: Sector Highlights, Analysis, & Industry Roundup Y-o-Y Growth (%) Projections by Category Type , 2022-2032 Figure 93: Europe Industry: Sector Highlights, Analysis, & Industry Roundup Attractiveness by Type, 2022-2032 Figure 94: Europe Industry: Sector Highlights, Analysis, & Industry Roundup Attractiveness by Room Type, 2022-2032 Figure 95: Europe Industry: Sector Highlights, Analysis, & Industry Roundup Attractiveness by Category Type , 2022-2032 Figure 96: Europe Industry: Sector Highlights, Analysis, & Industry Roundup Attractiveness by Country, 2022-2032 Figure 97: East Asia Industry: Sector Highlights, Analysis, & Industry Roundup Value (US$ Mn) by Type, 2022-2032 Figure 98: East Asia Industry: Sector Highlights, Analysis, & Industry Roundup Value (US$ Mn) by Room Type, 2022-2032 Figure 99: East Asia Industry: Sector Highlights, Analysis, & Industry Roundup Value (US$ Mn) by Category Type , 2022-2032 Figure 100: East Asia Industry: Sector Highlights, Analysis, & Industry Roundup Value (US$ Mn) by Country, 2022-2032 Figure 101: East Asia Industry: Sector Highlights, Analysis, & Industry Roundup Value (US$ Mn) Analysis by Country, 2017-2032 Figure 102: East Asia Industry: Sector Highlights, Analysis, & Industry Roundup Volume (Units) Analysis by Country, 2017-2032 Figure 103: East Asia Industry: Sector Highlights, Analysis, & Industry Roundup Value Share (%) and BPS Analysis by Country, 2022-2032 Figure 104: East Asia Industry: Sector Highlights, Analysis, & Industry Roundup Y-o-Y Growth (%) Projections by Country, 2022-2032 Figure 105: East Asia Industry: Sector Highlights, Analysis, & Industry Roundup Value (US$ Mn) Analysis by Type, 2017-2032 Figure 106: East Asia Industry: Sector Highlights, Analysis, & Industry Roundup Volume (Units) Analysis by Type, 2017-2032 Figure 107: East Asia Industry: Sector Highlights, Analysis, & Industry Roundup Value Share (%) and BPS Analysis by Type, 2022-2032 Figure 108: East Asia Industry: Sector Highlights, Analysis, & Industry Roundup Y-o-Y Growth (%) Projections by Type, 2022-2032 Figure 109: East Asia Industry: Sector Highlights, Analysis, & Industry Roundup Value (US$ Mn) Analysis by Room Type, 2017-2032 Figure 110: East Asia Industry: Sector Highlights, Analysis, & Industry Roundup Volume (Units) Analysis by Room Type, 2017-2032 Figure 111: East Asia Industry: Sector Highlights, Analysis, & Industry Roundup Value Share (%) and BPS Analysis by Room Type, 2022-2032 Figure 112: East Asia Industry: Sector Highlights, Analysis, & Industry Roundup Y-o-Y Growth (%) Projections by Room Type, 2022-2032 Figure 113: East Asia Industry: Sector Highlights, Analysis, & Industry Roundup Value (US$ Mn) Analysis by Category Type , 2017-2032 Figure 114: East Asia Industry: Sector Highlights, Analysis, & Industry Roundup Volume (Units) Analysis by Category Type , 2017-2032 Figure 115: East Asia Industry: Sector Highlights, Analysis, & Industry Roundup Value Share (%) and BPS Analysis by Category Type , 2022-2032 Figure 116: East Asia Industry: Sector Highlights, Analysis, & Industry Roundup Y-o-Y Growth (%) Projections by Category Type , 2022-2032 Figure 117: East Asia Industry: Sector Highlights, Analysis, & Industry Roundup Attractiveness by Type, 2022-2032 Figure 118: East Asia Industry: Sector Highlights, Analysis, & Industry Roundup Attractiveness by Room Type, 2022-2032 Figure 119: East Asia Industry: Sector Highlights, Analysis, & Industry Roundup Attractiveness by Category Type , 2022-2032 Figure 120: East Asia Industry: Sector Highlights, Analysis, & Industry Roundup Attractiveness by Country, 2022-2032 Figure 121: South Asia Industry: Sector Highlights, Analysis, & Industry Roundup Value (US$ Mn) by Type, 2022-2032 Figure 122: South Asia Industry: Sector Highlights, Analysis, & Industry Roundup Value (US$ Mn) by Room Type, 2022-2032 Figure 123: South Asia Industry: Sector Highlights, Analysis, & Industry Roundup Value (US$ Mn) by Category Type , 2022-2032 Figure 124: South Asia Industry: Sector Highlights, Analysis, & Industry Roundup Value (US$ Mn) by Country, 2022-2032 Figure 125: South Asia Industry: Sector Highlights, Analysis, & Industry Roundup Value (US$ Mn) Analysis by Country, 2017-2032 Figure 126: South Asia Industry: Sector Highlights, Analysis, & Industry Roundup Volume (Units) Analysis by Country, 2017-2032 Figure 127: South Asia Industry: Sector Highlights, Analysis, & Industry Roundup Value Share (%) and BPS Analysis by Country, 2022-2032 Figure 128: South Asia Industry: Sector Highlights, Analysis, & Industry Roundup Y-o-Y Growth (%) Projections by Country, 2022-2032 Figure 129: South Asia Industry: Sector Highlights, Analysis, & Industry Roundup Value (US$ Mn) Analysis by Type, 2017-2032 Figure 130: South Asia Industry: Sector Highlights, Analysis, & Industry Roundup Volume (Units) Analysis by Type, 2017-2032 Figure 131: South Asia Industry: Sector Highlights, Analysis, & Industry Roundup Value Share (%) and BPS Analysis by Type, 2022-2032 Figure 132: South Asia Industry: Sector Highlights, Analysis, & Industry Roundup Y-o-Y Growth (%) Projections by Type, 2022-2032 Figure 133: South Asia Industry: Sector Highlights, Analysis, & Industry Roundup Value (US$ Mn) Analysis by Room Type, 2017-2032 Figure 134: South Asia Industry: Sector Highlights, Analysis, & Industry Roundup Volume (Units) Analysis by Room Type, 2017-2032 Figure 135: South Asia Industry: Sector Highlights, Analysis, & Industry Roundup Value Share (%) and BPS Analysis by Room Type, 2022-2032 Figure 136: South Asia Industry: Sector Highlights, Analysis, & Industry Roundup Y-o-Y Growth (%) Projections by Room Type, 2022-2032 Figure 137: South Asia Industry: Sector Highlights, Analysis, & Industry Roundup Value (US$ Mn) Analysis by Category Type , 2017-2032 Figure 138: South Asia Industry: Sector Highlights, Analysis, & Industry Roundup Volume (Units) Analysis by Category Type , 2017-2032 Figure 139: South Asia Industry: Sector Highlights, Analysis, & Industry Roundup Value Share (%) and BPS Analysis by Category Type , 2022-2032 Figure 140: South Asia Industry: Sector Highlights, Analysis, & Industry Roundup Y-o-Y Growth (%) Projections by Category Type , 2022-2032 Figure 141: South Asia Industry: Sector Highlights, Analysis, & Industry Roundup Attractiveness by Type, 2022-2032 Figure 142: South Asia Industry: Sector Highlights, Analysis, & Industry Roundup Attractiveness by Room Type, 2022-2032 Figure 143: South Asia Industry: Sector Highlights, Analysis, & Industry Roundup Attractiveness by Category Type , 2022-2032 Figure 144: South Asia Industry: Sector Highlights, Analysis, & Industry Roundup Attractiveness by Country, 2022-2032 Figure 145: Oceania Industry: Sector Highlights, Analysis, & Industry Roundup Value (US$ Mn) by Type, 2022-2032 Figure 146: Oceania Industry: Sector Highlights, Analysis, & Industry Roundup Value (US$ Mn) by Room Type, 2022-2032 Figure 147: Oceania Industry: Sector Highlights, Analysis, & Industry Roundup Value (US$ Mn) by Category Type , 2022-2032 Figure 148: Oceania Industry: Sector Highlights, Analysis, & Industry Roundup Value (US$ Mn) by Country, 2022-2032 Figure 149: Oceania Industry: Sector Highlights, Analysis, & Industry Roundup Value (US$ Mn) Analysis by Country, 2017-2032 Figure 150: Oceania Industry: Sector Highlights, Analysis, & Industry Roundup Volume (Units) Analysis by Country, 2017-2032 Figure 151: Oceania Industry: Sector Highlights, Analysis, & Industry Roundup Value Share (%) and BPS Analysis by Country, 2022-2032 Figure 152: Oceania Industry: Sector Highlights, Analysis, & Industry Roundup Y-o-Y Growth (%) Projections by Country, 2022-2032 Figure 153: Oceania Industry: Sector Highlights, Analysis, & Industry Roundup Value (US$ Mn) Analysis by Type, 2017-2032 Figure 154: Oceania Industry: Sector Highlights, Analysis, & Industry Roundup Volume (Units) Analysis by Type, 2017-2032 Figure 155: Oceania Industry: Sector Highlights, Analysis, & Industry Roundup Value Share (%) and BPS Analysis by Type, 2022-2032 Figure 156: Oceania Industry: Sector Highlights, Analysis, & Industry Roundup Y-o-Y Growth (%) Projections by Type, 2022-2032 Figure 157: Oceania Industry: Sector Highlights, Analysis, & Industry Roundup Value (US$ Mn) Analysis by Room Type, 2017-2032 Figure 158: Oceania Industry: Sector Highlights, Analysis, & Industry Roundup Volume (Units) Analysis by Room Type, 2017-2032 Figure 159: Oceania Industry: Sector Highlights, Analysis, & Industry Roundup Value Share (%) and BPS Analysis by Room Type, 2022-2032 Figure 160: Oceania Industry: Sector Highlights, Analysis, & Industry Roundup Y-o-Y Growth (%) Projections by Room Type, 2022-2032 Figure 161: Oceania Industry: Sector Highlights, Analysis, & Industry Roundup Value (US$ Mn) Analysis by Category Type , 2017-2032 Figure 162: Oceania Industry: Sector Highlights, Analysis, & Industry Roundup Volume (Units) Analysis by Category Type , 2017-2032 Figure 163: Oceania Industry: Sector Highlights, Analysis, & Industry Roundup Value Share (%) and BPS Analysis by Category Type , 2022-2032 Figure 164: Oceania Industry: Sector Highlights, Analysis, & Industry Roundup Y-o-Y Growth (%) Projections by Category Type , 2022-2032 Figure 165: Oceania Industry: Sector Highlights, Analysis, & Industry Roundup Attractiveness by Type, 2022-2032 Figure 166: Oceania Industry: Sector Highlights, Analysis, & Industry Roundup Attractiveness by Room Type, 2022-2032 Figure 167: Oceania Industry: Sector Highlights, Analysis, & Industry Roundup Attractiveness by Category Type , 2022-2032 Figure 168: Oceania Industry: Sector Highlights, Analysis, & Industry Roundup Attractiveness by Country, 2022-2032 Figure 169: MEA Industry: Sector Highlights, Analysis, & Industry Roundup Value (US$ Mn) by Type, 2022-2032 Figure 170: MEA Industry: Sector Highlights, Analysis, & Industry Roundup Value (US$ Mn) by Room Type, 2022-2032 Figure 171: MEA Industry: Sector Highlights, Analysis, & Industry Roundup Value (US$ Mn) by Category Type , 2022-2032 Figure 172: MEA Industry: Sector Highlights, Analysis, & Industry Roundup Value (US$ Mn) by Country, 2022-2032 Figure 173: MEA Industry: Sector Highlights, Analysis, & Industry Roundup Value (US$ Mn) Analysis by Country, 2017-2032 Figure 174: MEA Industry: Sector Highlights, Analysis, & Industry Roundup Volume (Units) Analysis by Country, 2017-2032 Figure 175: MEA Industry: Sector Highlights, Analysis, & Industry Roundup Value Share (%) and BPS Analysis by Country, 2022-2032 Figure 176: MEA Industry: Sector Highlights, Analysis, & Industry Roundup Y-o-Y Growth (%) Projections by Country, 2022-2032 Figure 177: MEA Industry: Sector Highlights, Analysis, & Industry Roundup Value (US$ Mn) Analysis by Type, 2017-2032 Figure 178: MEA Industry: Sector Highlights, Analysis, & Industry Roundup Volume (Units) Analysis by Type, 2017-2032 Figure 179: MEA Industry: Sector Highlights, Analysis, & Industry Roundup Value Share (%) and BPS Analysis by Type, 2022-2032 Figure 180: MEA Industry: Sector Highlights, Analysis, & Industry Roundup Y-o-Y Growth (%) Projections by Type, 2022-2032 Figure 181: MEA Industry: Sector Highlights, Analysis, & Industry Roundup Value (US$ Mn) Analysis by Room Type, 2017-2032 Figure 182: MEA Industry: Sector Highlights, Analysis, & Industry Roundup Volume (Units) Analysis by Room Type, 2017-2032 Figure 183: MEA Industry: Sector Highlights, Analysis, & Industry Roundup Value Share (%) and BPS Analysis by Room Type, 2022-2032 Figure 184: MEA Industry: Sector Highlights, Analysis, & Industry Roundup Y-o-Y Growth (%) Projections by Room Type, 2022-2032 Figure 185: MEA Industry: Sector Highlights, Analysis, & Industry Roundup Value (US$ Mn) Analysis by Category Type , 2017-2032 Figure 186: MEA Industry: Sector Highlights, Analysis, & Industry Roundup Volume (Units) Analysis by Category Type , 2017-2032 Figure 187: MEA Industry: Sector Highlights, Analysis, & Industry Roundup Value Share (%) and BPS Analysis by Category Type , 2022-2032 Figure 188: MEA Industry: Sector Highlights, Analysis, & Industry Roundup Y-o-Y Growth (%) Projections by Category Type , 2022-2032 Figure 189: MEA Industry: Sector Highlights, Analysis, & Industry Roundup Attractiveness by Type, 2022-2032 Figure 190: MEA Industry: Sector Highlights, Analysis, & Industry Roundup Attractiveness by Room Type, 2022-2032 Figure 191: MEA Industry: Sector Highlights, Analysis, & Industry Roundup Attractiveness by Category Type , 2022-2032 Figure 192: MEA Industry: Sector Highlights, Analysis, & Industry Roundup Attractiveness by Country, 2022-2032
Need specific information?
Request CustomizationExplore Travel and Tourism Insights
View Reports