Smart Contact Lens Market Size and Share Forecast Outlook 2025 to 2035

The Smart Contact Lens Market is estimated to be valued at USD 404.5 million in 2025 and is projected to reach USD 1128.0 million by 2035, registering a compound annual growth rate (CAGR) of 10.8% over the forecast period.
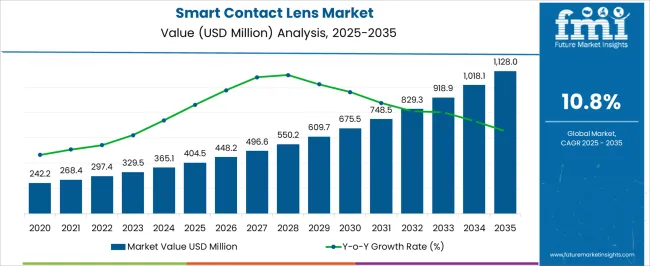
Quick Stats for Smart Contact Lens Market

  • Smart Contact Lens Market Value (2025): USD 404.5 million
  • Smart Contact Lens Market Forecast Value (2035): USD 1128.0 million
  • Smart Contact Lens Market Forecast CAGR: 10.8%
  • Leading Segment in Smart Contact Lens Market in 2025: Daily-Wear Soft Lenses (41.3%)
  • Key Growth Regions in Smart Contact Lens Market: North America, Asia-Pacific, Europe
  • Top Key Players in Smart Contact Lens Market: Johnson & Johnson Services Inc., Samsung Electronics Co., Ltd., Sony Group Corporation, Sensimed, Innovega Inc., InWith Corporation, RaayonNova LLC, Azalea Vision, EP Global Communications, Inc., GlakoLens Biyomedikal Biyoteknoloji San. ve Tic. A.S.

Smart Contact Lens Market Market Value Analysis

Smart Contact Lens Market Key Takeaways

Metric Value
Smart Contact Lens Market Estimated Value in (2025 E) USD 404.5 million
Smart Contact Lens Market Forecast Value in (2035 F) USD 1128.0 million
Forecast CAGR (2025 to 2035) 10.8%

Why is the Smart Contact Lens Market Growing?

The smart contact lens market is witnessing steady expansion, driven by the convergence of healthcare technologies, miniaturized electronics, and growing patient demand for advanced wearable solutions. These lenses are being increasingly adopted for applications that go beyond vision correction, particularly in areas such as health monitoring, drug delivery, and augmented reality. Advancements in micro-sensors, wireless connectivity, and biocompatible materials are improving the performance and safety profile of smart lenses, making them more suitable for long-term use.

The rising prevalence of chronic conditions, particularly diabetes, is driving demand for innovative solutions that can provide continuous monitoring without disrupting daily routines. Growing collaborations between healthcare providers, technology developers, and manufacturers are accelerating product development and regulatory approvals.

Increasing investments in smart healthcare infrastructure and patient-centric devices are also contributing to the market’s momentum As consumers and healthcare systems prioritize convenience, real-time data, and non-invasive monitoring methods, the smart contact lens market is expected to experience strong growth, supported by innovation and expanding commercial adoption across global markets.

Segmental Analysis

The smart contact lens market is segmented by type, application, end user, and geographic regions. By type, smart contact lens market is divided into Daily-Wear Soft Lenses, Rigid Gas-Permeable (RGP), Extended-Wear Lenses, and Others. In terms of application, smart contact lens market is classified into Continuous glucose monitoring, Continuous intraocular pressure monitoring, and Others. Based on end user, smart contact lens market is segmented into Hospitals, Ophthalmology Clinics, and Others. Regionally, the smart contact lens industry is classified into North America, Latin America, Western Europe, Eastern Europe, Balkan & Baltic Countries, Russia & Belarus, Central Asia, East Asia, South Asia & Pacific, and the Middle East & Africa.
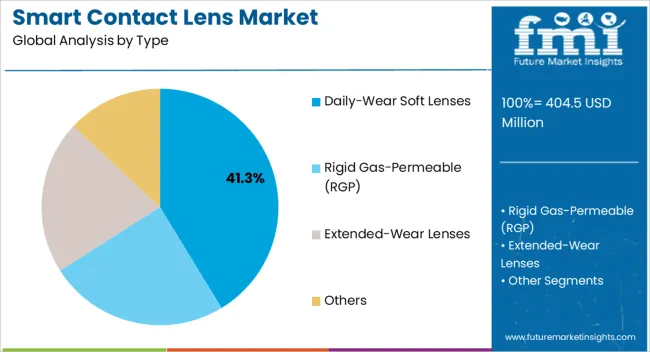
Insights into the Daily-wear Soft Lenses Type Segment

Smart Contact Lens Market Analysis By Type

The daily-wear soft lenses segment is projected to hold 41.3% of the smart contact lens market revenue share in 2025, making it the leading type segment. Its dominance is being reinforced by the comfort, convenience, and adaptability offered to users, who prefer lenses that can be worn throughout the day and easily replaced. The segment’s growth is supported by the integration of sensors and electronic components into flexible lens materials without compromising comfort or oxygen permeability, a critical factor in ensuring ocular health.

The preference for disposable and daily-use formats also minimizes risks of infection, which enhances patient confidence and adoption. Manufacturers are increasingly focusing on designing soft lenses with embedded health-monitoring capabilities, including glucose sensing and intraocular pressure detection, which expands their utility beyond vision correction.

Growing acceptance of contact lenses as lifestyle products, combined with the added functionality of smart features, is further driving market leadership As advancements in materials science and microelectronics continue, daily-wear soft lenses are expected to maintain their position as the most widely adopted smart lens type globally.
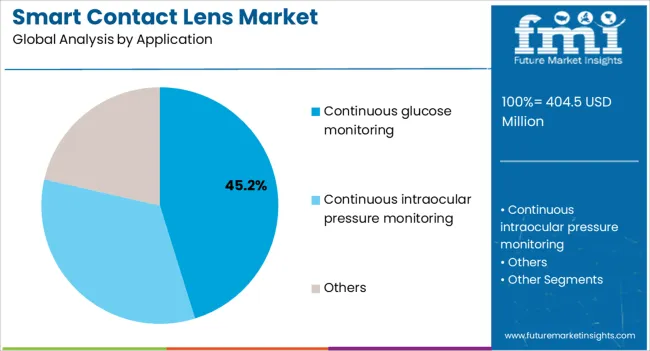
Insights into the Continuous Glucose Monitoring Application Segment

Smart Contact Lens Market Analysis By Application

The continuous glucose monitoring segment is anticipated to represent 45.2% of the smart contact lens market revenue share in 2025, making it the leading application area. Its dominance is being driven by the rising global prevalence of diabetes and the increasing need for non-invasive, real-time glucose monitoring solutions. Smart contact lenses designed for this application are capable of analyzing tear fluid glucose levels, reducing reliance on traditional blood-based testing methods and improving patient compliance.

The ability to transmit real-time data to connected devices enhances disease management and enables timely interventions, improving overall health outcomes. The segment’s leadership is further supported by the growing emphasis on preventive healthcare and patient empowerment, as individuals seek seamless monitoring solutions integrated into their daily lives.

Regulatory support for innovative diabetes management tools and rising investments by healthcare technology companies are accelerating development in this space As the burden of diabetes continues to grow, continuous glucose monitoring through smart lenses is expected to remain the most impactful and widely adopted application in the market.
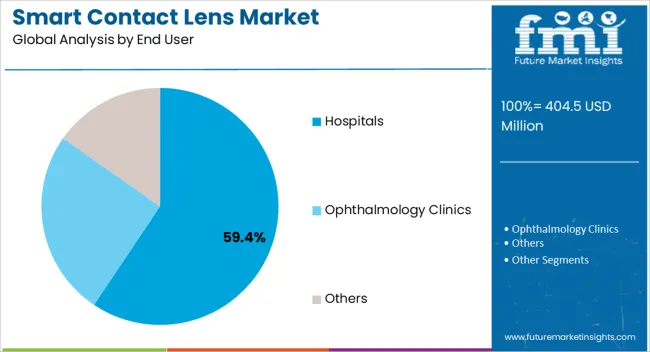
Insights into the Hospitals End User Segment

Smart Contact Lens Market Analysis By End User

The hospitals segment is expected to capture 59.4% of the smart contact lens market revenue share in 2025, establishing itself as the leading end-user category. Its dominance is being driven by the critical role hospitals play in the diagnosis, monitoring, and management of chronic and acute health conditions, making them primary adopters of advanced medical technologies. Hospitals are increasingly integrating smart contact lenses into patient care programs to provide continuous monitoring and support early detection of complications.

The ability of these devices to deliver real-time health data enhances clinical decision-making, reduces the need for invasive testing, and improves patient compliance. Strong investment in hospital infrastructure and digital health systems is also accelerating adoption, as institutions prioritize connected medical devices that integrate with electronic health records.

The segment’s leadership is further supported by ongoing collaborations between hospitals, technology developers, and healthcare providers to validate and scale clinical use cases As patient-centric care models gain prominence, hospitals are expected to remain the largest end-user segment, reinforcing the market’s growth trajectory.

Market Overview

Consumer electronics integration plays a crucial role in the growth of smart contact lenses. Enhanced connectivity allows these lenses to interface with smartphones, wearables, and other IoT devices, expanding their functionality from health monitoring to real-time information display. Improved user experience in terms of comfort, ease of use, and extended wear time also makes these lenses more appealing to consumers, encouraging broader adoption.

Rising health awareness among consumers also plays a significant role. There is a growing trend towards preventive healthcare, with individuals seeking regular monitoring of vital signs to catch potential health issues early. Smart contact lenses facilitate this by providing continuous health data, which consumers can collect and analyze for better personal health management.

Personalized vision correction is a growing trend in the market. Lenses with adjustable focus or custom vision correction capabilities are being developed to cater to individual visual needs, such as presbyopia and myopia. These lenses can adjust dynamically to different visual requirements, providing a more tailored and effective solution.
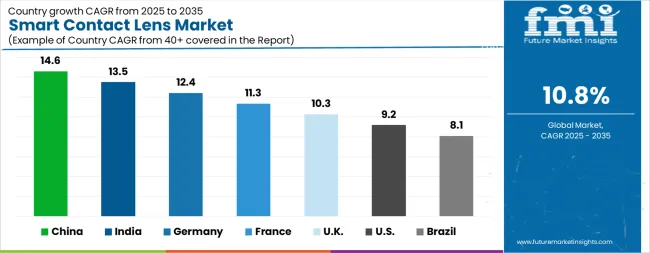
Analysis of Smart Contact Lens Market By Key Countries

Smart Contact Lens Market Cagr Analysis By Country

Country CAGR
China 14.6%
India 13.5%
Germany 12.4%
France 11.3%
UK 10.3%
USA 9.2%
Brazil 8.1%

Country-wise Analysis

The Smart Contact Lens Market is expected to register a CAGR of 10.8% during the forecast period, exhibiting varied country level momentum. China leads with the highest CAGR of 14.6%, followed by India at 13.5%. Developed markets such as Germany, France, and the UK continue to expand steadily, while the USA is likely to grow at consistent rates. Brazil posts the lowest CAGR at 8.1%, yet still underscores a broadly positive trajectory for the global Smart Contact Lens Market. In 2024, Germany held a dominant revenue in the Western Europe market and is expected to grow with a CAGR of 12.4%. The USA Smart Contact Lens Market is estimated to be valued at USD 150.3 million in 2025 and is anticipated to reach a valuation of USD 361.7 million by 2035. Sales are projected to rise at a CAGR of 9.2% over the forecast period between 2025 and 2035. While Japan and South Korea markets are estimated to be valued at USD 21.1 million and USD 13.2 million respectively in 2025.
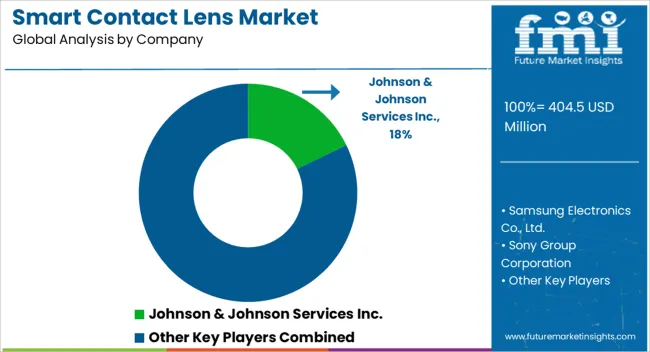
Key Players in the Smart Contact Lens Market

Smart Contact Lens Market Analysis By Company

  • Johnson & Johnson Services Inc.
  • Samsung Electronics Co., Ltd.
  • Sony Group Corporation
  • Sensimed
  • Innovega Inc.
  • InWith Corporation
  • RaayonNova LLC
  • Azalea Vision
  • EP Global Communications, Inc.
  • GlakoLens Biyomedikal Biyoteknoloji San. ve Tic. A.S.

Scope of the Report

Item Value
Quantitative Units USD 404.5 Million
Type Daily-Wear Soft Lenses, Rigid Gas-Permeable (RGP), Extended-Wear Lenses, and Others
Application Continuous glucose monitoring, Continuous intraocular pressure monitoring, and Others
End User Hospitals, Ophthalmology Clinics, and Others
Regions Covered North America, Europe, Asia-Pacific, Latin America, Middle East & Africa
Country Covered United States, Canada, Germany, France, United Kingdom, China, Japan, India, Brazil, South Africa
Key Companies Profiled Johnson & Johnson Services Inc., Samsung Electronics Co., Ltd., Sony Group Corporation, Sensimed, Innovega Inc., InWith Corporation, RaayonNova LLC, Azalea Vision, EP Global Communications, Inc., and GlakoLens Biyomedikal Biyoteknoloji San. ve Tic. A.S.

Smart Contact Lens Market by Segments

Type:

  • Daily-Wear Soft Lenses
  • Rigid Gas-Permeable (RGP)
  • Extended-Wear Lenses
  • Others

Application:

  • Continuous glucose monitoring
  • Continuous intraocular pressure monitoring
  • Others

End User:

  • Hospitals
  • Ophthalmology Clinics
  • Others

Region:

  • North America
    • USA
    • Canada
    • Mexico
  • Latin America
    • Brazil
    • Chile
    • Rest of Latin America
  • Western Europe
    • Germany
    • UK
    • Italy
    • Spain
    • France
    • Nordic
    • BENELUX
    • Rest of Western Europe
  • Eastern Europe
    • Russia
    • Poland
    • Hungary
    • Balkan & Baltic
    • Rest of Eastern Europe
  • East Asia
    • China
    • Japan
    • South Korea
  • South Asia and Pacific
    • India
    • ASEAN
    • Australia & New Zealand
    • Rest of South Asia and Pacific
  • Middle East & Africa
    • Kingdom of Saudi Arabia
    • Other GCC Countries
    • Turkiye
    • South Africa
    • Other African Union
    • Rest of Middle East & Africa

Frequently Asked Questions

How big is the smart contact lens market in 2025?

The global smart contact lens market is estimated to be valued at USD 404.5 million in 2025.

What will be the size of smart contact lens market in 2035?

The market size for the smart contact lens market is projected to reach USD 1,128.0 million by 2035.

How much will be the smart contact lens market growth between 2025 and 2035?

The smart contact lens market is expected to grow at a 10.8% CAGR between 2025 and 2035.

What are the key product types in the smart contact lens market?

The key product types in smart contact lens market are daily-wear soft lenses, rigid gas-permeable (rgp), extended-wear lenses and others.

Which application segment to contribute significant share in the smart contact lens market in 2025?

In terms of application, continuous glucose monitoring segment to command 45.2% share in the smart contact lens market in 2025.

Table of Content

  1. Executive Summary
    • Global Market Outlook
    • Demand-side Trends
    • Supply-side Trends
    • Technology Roadmap Analysis
    • Analysis and Recommendations
  2. Market Overview
    • Market Coverage / Taxonomy
    • Market Definition / Scope / Limitations
  3. Market Background
    • Market Dynamics
      • Drivers
      • Restraints
      • Opportunity
      • Trends
    • Scenario Forecast
      • Demand in Optimistic Scenario
      • Demand in Likely Scenario
      • Demand in Conservative Scenario
    • Opportunity Map Analysis
    • Product Life Cycle Analysis
    • Supply Chain Analysis
    • Investment Feasibility Matrix
    • Value Chain Analysis
    • PESTLE and Porter’s Analysis
    • Regulatory Landscape
    • Regional Parent Market Outlook
    • Production and Consumption Statistics
    • Import and Export Statistics
  4. Global Market Analysis 2020 to 2024 and Forecast, 2025 to 2035
    • Historical Market Size Value (USD Million) Analysis, 2020 to 2024
    • Current and Future Market Size Value (USD Million) Projections, 2025 to 2035
      • Y-o-Y Growth Trend Analysis
      • Absolute $ Opportunity Analysis
  5. Global Market Pricing Analysis 2020 to 2024 and Forecast 2025 to 2035
  6. Global Market Analysis 2020 to 2024 and Forecast 2025 to 2035, By Type
    • Introduction / Key Findings
    • Historical Market Size Value (USD Million) Analysis By Type , 2020 to 2024
    • Current and Future Market Size Value (USD Million) Analysis and Forecast By Type , 2025 to 2035
      • Daily-Wear Soft Lenses
      • Rigid Gas-Permeable (RGP)
      • Extended-Wear Lenses
      • Others
    • Y-o-Y Growth Trend Analysis By Type , 2020 to 2024
    • Absolute $ Opportunity Analysis By Type , 2025 to 2035
  7. Global Market Analysis 2020 to 2024 and Forecast 2025 to 2035, By Application
    • Introduction / Key Findings
    • Historical Market Size Value (USD Million) Analysis By Application, 2020 to 2024
    • Current and Future Market Size Value (USD Million) Analysis and Forecast By Application, 2025 to 2035
      • Continuous glucose monitoring
      • Continuous intraocular pressure monitoring
      • Others
    • Y-o-Y Growth Trend Analysis By Application, 2020 to 2024
    • Absolute $ Opportunity Analysis By Application, 2025 to 2035
  8. Global Market Analysis 2020 to 2024 and Forecast 2025 to 2035, By End User
    • Introduction / Key Findings
    • Historical Market Size Value (USD Million) Analysis By End User, 2020 to 2024
    • Current and Future Market Size Value (USD Million) Analysis and Forecast By End User, 2025 to 2035
      • Hospitals
      • Ophthalmology Clinics
      • Others
    • Y-o-Y Growth Trend Analysis By End User, 2020 to 2024
    • Absolute $ Opportunity Analysis By End User, 2025 to 2035
  9. Global Market Analysis 2020 to 2024 and Forecast 2025 to 2035, By Region
    • Introduction
    • Historical Market Size Value (USD Million) Analysis By Region, 2020 to 2024
    • Current Market Size Value (USD Million) Analysis and Forecast By Region, 2025 to 2035
      • North America
      • Latin America
      • Western Europe
      • Eastern Europe
      • East Asia
      • South Asia and Pacific
      • Middle East & Africa
    • Market Attractiveness Analysis By Region
  10. North America Market Analysis 2020 to 2024 and Forecast 2025 to 2035, By Country
    • Historical Market Size Value (USD Million) Trend Analysis By Market Taxonomy, 2020 to 2024
    • Market Size Value (USD Million) Forecast By Market Taxonomy, 2025 to 2035
      • By Country
        • USA
        • Canada
        • Mexico
      • By Type
      • By Application
      • By End User
    • Market Attractiveness Analysis
      • By Country
      • By Type
      • By Application
      • By End User
    • Key Takeaways
  11. Latin America Market Analysis 2020 to 2024 and Forecast 2025 to 2035, By Country
    • Historical Market Size Value (USD Million) Trend Analysis By Market Taxonomy, 2020 to 2024
    • Market Size Value (USD Million) Forecast By Market Taxonomy, 2025 to 2035
      • By Country
        • Brazil
        • Chile
        • Rest of Latin America
      • By Type
      • By Application
      • By End User
    • Market Attractiveness Analysis
      • By Country
      • By Type
      • By Application
      • By End User
    • Key Takeaways
  12. Western Europe Market Analysis 2020 to 2024 and Forecast 2025 to 2035, By Country
    • Historical Market Size Value (USD Million) Trend Analysis By Market Taxonomy, 2020 to 2024
    • Market Size Value (USD Million) Forecast By Market Taxonomy, 2025 to 2035
      • By Country
        • Germany
        • UK
        • Italy
        • Spain
        • France
        • Nordic
        • BENELUX
        • Rest of Western Europe
      • By Type
      • By Application
      • By End User
    • Market Attractiveness Analysis
      • By Country
      • By Type
      • By Application
      • By End User
    • Key Takeaways
  13. Eastern Europe Market Analysis 2020 to 2024 and Forecast 2025 to 2035, By Country
    • Historical Market Size Value (USD Million) Trend Analysis By Market Taxonomy, 2020 to 2024
    • Market Size Value (USD Million) Forecast By Market Taxonomy, 2025 to 2035
      • By Country
        • Russia
        • Poland
        • Hungary
        • Balkan & Baltic
        • Rest of Eastern Europe
      • By Type
      • By Application
      • By End User
    • Market Attractiveness Analysis
      • By Country
      • By Type
      • By Application
      • By End User
    • Key Takeaways
  14. East Asia Market Analysis 2020 to 2024 and Forecast 2025 to 2035, By Country
    • Historical Market Size Value (USD Million) Trend Analysis By Market Taxonomy, 2020 to 2024
    • Market Size Value (USD Million) Forecast By Market Taxonomy, 2025 to 2035
      • By Country
        • China
        • Japan
        • South Korea
      • By Type
      • By Application
      • By End User
    • Market Attractiveness Analysis
      • By Country
      • By Type
      • By Application
      • By End User
    • Key Takeaways
  15. South Asia and Pacific Market Analysis 2020 to 2024 and Forecast 2025 to 2035, By Country
    • Historical Market Size Value (USD Million) Trend Analysis By Market Taxonomy, 2020 to 2024
    • Market Size Value (USD Million) Forecast By Market Taxonomy, 2025 to 2035
      • By Country
        • India
        • ASEAN
        • Australia & New Zealand
        • Rest of South Asia and Pacific
      • By Type
      • By Application
      • By End User
    • Market Attractiveness Analysis
      • By Country
      • By Type
      • By Application
      • By End User
    • Key Takeaways
  16. Middle East & Africa Market Analysis 2020 to 2024 and Forecast 2025 to 2035, By Country
    • Historical Market Size Value (USD Million) Trend Analysis By Market Taxonomy, 2020 to 2024
    • Market Size Value (USD Million) Forecast By Market Taxonomy, 2025 to 2035
      • By Country
        • Kingdom of Saudi Arabia
        • Other GCC Countries
        • Turkiye
        • South Africa
        • Other African Union
        • Rest of Middle East & Africa
      • By Type
      • By Application
      • By End User
    • Market Attractiveness Analysis
      • By Country
      • By Type
      • By Application
      • By End User
    • Key Takeaways
  17. Key Countries Market Analysis
    • USA
      • Pricing Analysis
      • Market Share Analysis, 2024
        • By Type
        • By Application
        • By End User
    • Canada
      • Pricing Analysis
      • Market Share Analysis, 2024
        • By Type
        • By Application
        • By End User
    • Mexico
      • Pricing Analysis
      • Market Share Analysis, 2024
        • By Type
        • By Application
        • By End User
    • Brazil
      • Pricing Analysis
      • Market Share Analysis, 2024
        • By Type
        • By Application
        • By End User
    • Chile
      • Pricing Analysis
      • Market Share Analysis, 2024
        • By Type
        • By Application
        • By End User
    • Germany
      • Pricing Analysis
      • Market Share Analysis, 2024
        • By Type
        • By Application
        • By End User
    • UK
      • Pricing Analysis
      • Market Share Analysis, 2024
        • By Type
        • By Application
        • By End User
    • Italy
      • Pricing Analysis
      • Market Share Analysis, 2024
        • By Type
        • By Application
        • By End User
    • Spain
      • Pricing Analysis
      • Market Share Analysis, 2024
        • By Type
        • By Application
        • By End User
    • France
      • Pricing Analysis
      • Market Share Analysis, 2024
        • By Type
        • By Application
        • By End User
    • India
      • Pricing Analysis
      • Market Share Analysis, 2024
        • By Type
        • By Application
        • By End User
    • ASEAN
      • Pricing Analysis
      • Market Share Analysis, 2024
        • By Type
        • By Application
        • By End User
    • Australia & New Zealand
      • Pricing Analysis
      • Market Share Analysis, 2024
        • By Type
        • By Application
        • By End User
    • China
      • Pricing Analysis
      • Market Share Analysis, 2024
        • By Type
        • By Application
        • By End User
    • Japan
      • Pricing Analysis
      • Market Share Analysis, 2024
        • By Type
        • By Application
        • By End User
    • South Korea
      • Pricing Analysis
      • Market Share Analysis, 2024
        • By Type
        • By Application
        • By End User
    • Russia
      • Pricing Analysis
      • Market Share Analysis, 2024
        • By Type
        • By Application
        • By End User
    • Poland
      • Pricing Analysis
      • Market Share Analysis, 2024
        • By Type
        • By Application
        • By End User
    • Hungary
      • Pricing Analysis
      • Market Share Analysis, 2024
        • By Type
        • By Application
        • By End User
    • Kingdom of Saudi Arabia
      • Pricing Analysis
      • Market Share Analysis, 2024
        • By Type
        • By Application
        • By End User
    • Turkiye
      • Pricing Analysis
      • Market Share Analysis, 2024
        • By Type
        • By Application
        • By End User
    • South Africa
      • Pricing Analysis
      • Market Share Analysis, 2024
        • By Type
        • By Application
        • By End User
  18. Market Structure Analysis
    • Competition Dashboard
    • Competition Benchmarking
    • Market Share Analysis of Top Players
      • By Regional
      • By Type
      • By Application
      • By End User
  19. Competition Analysis
    • Competition Deep Dive
      • Johnson & Johnson Services Inc.
        • Overview
        • Product Portfolio
        • Profitability by Market Segments (Product/Age /Sales Channel/Region)
        • Sales Footprint
        • Strategy Overview
          • Marketing Strategy
          • Product Strategy
          • Channel Strategy
      • Samsung Electronics Co., Ltd.
      • Sony Group Corporation
      • Sensimed
      • Innovega Inc.
      • InWith Corporation
      • RaayonNova LLC
      • Azalea Vision
      • EP Global Communications, Inc.
      • GlakoLens Biyomedikal Biyoteknoloji San. ve Tic. A.S.
  20. Assumptions & Acronyms Used
  21. Research Methodology

List of Tables

  • Table 1: Global Market Value (USD Million) Forecast by Region, 2020 to 2035
  • Table 2: Global Market Value (USD Million) Forecast by Type , 2020 to 2035
  • Table 3: Global Market Value (USD Million) Forecast by Application, 2020 to 2035
  • Table 4: Global Market Value (USD Million) Forecast by End User, 2020 to 2035
  • Table 5: North America Market Value (USD Million) Forecast by Country, 2020 to 2035
  • Table 6: North America Market Value (USD Million) Forecast by Type , 2020 to 2035
  • Table 7: North America Market Value (USD Million) Forecast by Application, 2020 to 2035
  • Table 8: North America Market Value (USD Million) Forecast by End User, 2020 to 2035
  • Table 9: Latin America Market Value (USD Million) Forecast by Country, 2020 to 2035
  • Table 10: Latin America Market Value (USD Million) Forecast by Type , 2020 to 2035
  • Table 11: Latin America Market Value (USD Million) Forecast by Application, 2020 to 2035
  • Table 12: Latin America Market Value (USD Million) Forecast by End User, 2020 to 2035
  • Table 13: Western Europe Market Value (USD Million) Forecast by Country, 2020 to 2035
  • Table 14: Western Europe Market Value (USD Million) Forecast by Type , 2020 to 2035
  • Table 15: Western Europe Market Value (USD Million) Forecast by Application, 2020 to 2035
  • Table 16: Western Europe Market Value (USD Million) Forecast by End User, 2020 to 2035
  • Table 17: Eastern Europe Market Value (USD Million) Forecast by Country, 2020 to 2035
  • Table 18: Eastern Europe Market Value (USD Million) Forecast by Type , 2020 to 2035
  • Table 19: Eastern Europe Market Value (USD Million) Forecast by Application, 2020 to 2035
  • Table 20: Eastern Europe Market Value (USD Million) Forecast by End User, 2020 to 2035
  • Table 21: East Asia Market Value (USD Million) Forecast by Country, 2020 to 2035
  • Table 22: East Asia Market Value (USD Million) Forecast by Type , 2020 to 2035
  • Table 23: East Asia Market Value (USD Million) Forecast by Application, 2020 to 2035
  • Table 24: East Asia Market Value (USD Million) Forecast by End User, 2020 to 2035
  • Table 25: South Asia and Pacific Market Value (USD Million) Forecast by Country, 2020 to 2035
  • Table 26: South Asia and Pacific Market Value (USD Million) Forecast by Type , 2020 to 2035
  • Table 27: South Asia and Pacific Market Value (USD Million) Forecast by Application, 2020 to 2035
  • Table 28: South Asia and Pacific Market Value (USD Million) Forecast by End User, 2020 to 2035
  • Table 29: Middle East & Africa Market Value (USD Million) Forecast by Country, 2020 to 2035
  • Table 30: Middle East & Africa Market Value (USD Million) Forecast by Type , 2020 to 2035
  • Table 31: Middle East & Africa Market Value (USD Million) Forecast by Application, 2020 to 2035
  • Table 32: Middle East & Africa Market Value (USD Million) Forecast by End User, 2020 to 2035

List of Figures

  • Figure 1: Global Market Pricing Analysis
  • Figure 2: Global Market Value (USD Million) Forecast 2020-2035
  • Figure 3: Global Market Value Share and BPS Analysis by Type , 2025 and 2035
  • Figure 4: Global Market Y-o-Y Growth Comparison by Type , 2025-2035
  • Figure 5: Global Market Attractiveness Analysis by Type
  • Figure 6: Global Market Value Share and BPS Analysis by Application, 2025 and 2035
  • Figure 7: Global Market Y-o-Y Growth Comparison by Application, 2025-2035
  • Figure 8: Global Market Attractiveness Analysis by Application
  • Figure 9: Global Market Value Share and BPS Analysis by End User, 2025 and 2035
  • Figure 10: Global Market Y-o-Y Growth Comparison by End User, 2025-2035
  • Figure 11: Global Market Attractiveness Analysis by End User
  • Figure 12: Global Market Value (USD Million) Share and BPS Analysis by Region, 2025 and 2035
  • Figure 13: Global Market Y-o-Y Growth Comparison by Region, 2025-2035
  • Figure 14: Global Market Attractiveness Analysis by Region
  • Figure 15: North America Market Incremental Dollar Opportunity, 2025-2035
  • Figure 16: Latin America Market Incremental Dollar Opportunity, 2025-2035
  • Figure 17: Western Europe Market Incremental Dollar Opportunity, 2025-2035
  • Figure 18: Eastern Europe Market Incremental Dollar Opportunity, 2025-2035
  • Figure 19: East Asia Market Incremental Dollar Opportunity, 2025-2035
  • Figure 20: South Asia and Pacific Market Incremental Dollar Opportunity, 2025-2035
  • Figure 21: Middle East & Africa Market Incremental Dollar Opportunity, 2025-2035
  • Figure 22: North America Market Value Share and BPS Analysis by Country, 2025 and 2035
  • Figure 23: North America Market Value Share and BPS Analysis by Type , 2025 and 2035
  • Figure 24: North America Market Y-o-Y Growth Comparison by Type , 2025-2035
  • Figure 25: North America Market Attractiveness Analysis by Type
  • Figure 26: North America Market Value Share and BPS Analysis by Application, 2025 and 2035
  • Figure 27: North America Market Y-o-Y Growth Comparison by Application, 2025-2035
  • Figure 28: North America Market Attractiveness Analysis by Application
  • Figure 29: North America Market Value Share and BPS Analysis by End User, 2025 and 2035
  • Figure 30: North America Market Y-o-Y Growth Comparison by End User, 2025-2035
  • Figure 31: North America Market Attractiveness Analysis by End User
  • Figure 32: Latin America Market Value Share and BPS Analysis by Country, 2025 and 2035
  • Figure 33: Latin America Market Value Share and BPS Analysis by Type , 2025 and 2035
  • Figure 34: Latin America Market Y-o-Y Growth Comparison by Type , 2025-2035
  • Figure 35: Latin America Market Attractiveness Analysis by Type
  • Figure 36: Latin America Market Value Share and BPS Analysis by Application, 2025 and 2035
  • Figure 37: Latin America Market Y-o-Y Growth Comparison by Application, 2025-2035
  • Figure 38: Latin America Market Attractiveness Analysis by Application
  • Figure 39: Latin America Market Value Share and BPS Analysis by End User, 2025 and 2035
  • Figure 40: Latin America Market Y-o-Y Growth Comparison by End User, 2025-2035
  • Figure 41: Latin America Market Attractiveness Analysis by End User
  • Figure 42: Western Europe Market Value Share and BPS Analysis by Country, 2025 and 2035
  • Figure 43: Western Europe Market Value Share and BPS Analysis by Type , 2025 and 2035
  • Figure 44: Western Europe Market Y-o-Y Growth Comparison by Type , 2025-2035
  • Figure 45: Western Europe Market Attractiveness Analysis by Type
  • Figure 46: Western Europe Market Value Share and BPS Analysis by Application, 2025 and 2035
  • Figure 47: Western Europe Market Y-o-Y Growth Comparison by Application, 2025-2035
  • Figure 48: Western Europe Market Attractiveness Analysis by Application
  • Figure 49: Western Europe Market Value Share and BPS Analysis by End User, 2025 and 2035
  • Figure 50: Western Europe Market Y-o-Y Growth Comparison by End User, 2025-2035
  • Figure 51: Western Europe Market Attractiveness Analysis by End User
  • Figure 52: Eastern Europe Market Value Share and BPS Analysis by Country, 2025 and 2035
  • Figure 53: Eastern Europe Market Value Share and BPS Analysis by Type , 2025 and 2035
  • Figure 54: Eastern Europe Market Y-o-Y Growth Comparison by Type , 2025-2035
  • Figure 55: Eastern Europe Market Attractiveness Analysis by Type
  • Figure 56: Eastern Europe Market Value Share and BPS Analysis by Application, 2025 and 2035
  • Figure 57: Eastern Europe Market Y-o-Y Growth Comparison by Application, 2025-2035
  • Figure 58: Eastern Europe Market Attractiveness Analysis by Application
  • Figure 59: Eastern Europe Market Value Share and BPS Analysis by End User, 2025 and 2035
  • Figure 60: Eastern Europe Market Y-o-Y Growth Comparison by End User, 2025-2035
  • Figure 61: Eastern Europe Market Attractiveness Analysis by End User
  • Figure 62: East Asia Market Value Share and BPS Analysis by Country, 2025 and 2035
  • Figure 63: East Asia Market Value Share and BPS Analysis by Type , 2025 and 2035
  • Figure 64: East Asia Market Y-o-Y Growth Comparison by Type , 2025-2035
  • Figure 65: East Asia Market Attractiveness Analysis by Type
  • Figure 66: East Asia Market Value Share and BPS Analysis by Application, 2025 and 2035
  • Figure 67: East Asia Market Y-o-Y Growth Comparison by Application, 2025-2035
  • Figure 68: East Asia Market Attractiveness Analysis by Application
  • Figure 69: East Asia Market Value Share and BPS Analysis by End User, 2025 and 2035
  • Figure 70: East Asia Market Y-o-Y Growth Comparison by End User, 2025-2035
  • Figure 71: East Asia Market Attractiveness Analysis by End User
  • Figure 72: South Asia and Pacific Market Value Share and BPS Analysis by Country, 2025 and 2035
  • Figure 73: South Asia and Pacific Market Value Share and BPS Analysis by Type , 2025 and 2035
  • Figure 74: South Asia and Pacific Market Y-o-Y Growth Comparison by Type , 2025-2035
  • Figure 75: South Asia and Pacific Market Attractiveness Analysis by Type
  • Figure 76: South Asia and Pacific Market Value Share and BPS Analysis by Application, 2025 and 2035
  • Figure 77: South Asia and Pacific Market Y-o-Y Growth Comparison by Application, 2025-2035
  • Figure 78: South Asia and Pacific Market Attractiveness Analysis by Application
  • Figure 79: South Asia and Pacific Market Value Share and BPS Analysis by End User, 2025 and 2035
  • Figure 80: South Asia and Pacific Market Y-o-Y Growth Comparison by End User, 2025-2035
  • Figure 81: South Asia and Pacific Market Attractiveness Analysis by End User
  • Figure 82: Middle East & Africa Market Value Share and BPS Analysis by Country, 2025 and 2035
  • Figure 83: Middle East & Africa Market Value Share and BPS Analysis by Type , 2025 and 2035
  • Figure 84: Middle East & Africa Market Y-o-Y Growth Comparison by Type , 2025-2035
  • Figure 85: Middle East & Africa Market Attractiveness Analysis by Type
  • Figure 86: Middle East & Africa Market Value Share and BPS Analysis by Application, 2025 and 2035
  • Figure 87: Middle East & Africa Market Y-o-Y Growth Comparison by Application, 2025-2035
  • Figure 88: Middle East & Africa Market Attractiveness Analysis by Application
  • Figure 89: Middle East & Africa Market Value Share and BPS Analysis by End User, 2025 and 2035
  • Figure 90: Middle East & Africa Market Y-o-Y Growth Comparison by End User, 2025-2035
  • Figure 91: Middle East & Africa Market Attractiveness Analysis by End User
  • Figure 92: Global Market - Tier Structure Analysis
  • Figure 93: Global Market - Company Share Analysis
Dashboard
Dashboard
Dashboard
Dashboard
Dashboard
Dashboard

Full Research Suite comprises of:

Market outlook & trends analysis

Market outlook & trends analysis

Interviews & case studies

Interviews & case studies

Strategic recommendations

Strategic recommendations

Vendor profiles & capabilities analysis

Vendor profiles & capabilities analysis

5-year forecasts

5-year forecasts

8 regions and 60+ country-level data splits

8 regions and 60+ country-level data splits

Market segment data splits

Market segment data splits

12 months of continuous data updates

12 months of continuous data updates

DELIVERED AS:

PDF EXCEL ONLINE

Full Research Suite


$5000

$7500

$10000

Buy Report Now
Similar Industry Reports

Similar Industry Reports

Smart Locks Market
Smart Locks Market

Smart Locks Market Size and Share Forecast Outlook 2025 to 2035

Smart Sprinkler Controller Market

Smart Sprinkler Controller Market Size and Share Forecast Outlook 2025 to 2035

Smart Indoor Gardening System Market

Smart Indoor Gardening System Market Size and Share Forecast Outlook 2025 to 2035

Smart Building Delivery Robot Market

Smart Building Delivery Robot Market Size and Share Forecast Outlook 2025 to 2035

Smart Watch Market
Smart Watch Market

Smart Watch Market Size and Share Forecast Outlook 2025 to 2035

Smart Label Market
Smart Label Market

Smart Label Market Size and Share Forecast Outlook 2025 to 2035

Smart Mat Market
Smart Mat Market

Smart Mat Market Size and Share Forecast Outlook 2025 to 2035

Smart Water Management Market

Smart Water Management Market Size and Share Forecast Outlook 2025 to 2035

Smart Built-In Kitchen Appliance Market

Smart Built-In Kitchen Appliance Market Size and Share Forecast Outlook 2025 to 2035

Smart Cold Therapy Machine Market

Smart Cold Therapy Machine Market Size and Share Forecast Outlook 2025 to 2035

Smart Personal Assistance Devices Market

Smart Personal Assistance Devices Market Size and Share Forecast Outlook 2025 to 2035

Smart Speaker Market

Smart Speaker Market Size and Share Forecast Outlook 2025 to 2035

Smart Vehicle Architecture Market

Smart Vehicle Architecture Market Size and Share Forecast Outlook 2025 to 2035

Smart City Platforms Market

Smart City Platforms Market Size and Share Forecast Outlook 2025 to 2035

Smart Doorbell Market

Smart Doorbell Market Size and Share Forecast Outlook 2025 to 2035

Smart Water Monitoring Market

Smart Water Monitoring Market Size and Share Forecast Outlook 2025 to 2035

Smart Welding Monitoring Solution Market

Smart Welding Monitoring Solution Market Analysis - Size, Share, and Forecast Outlook 2025 to 2035

Smart Behind-The-Ear Hearing Aid Market

Smart Behind-The-Ear Hearing Aid Market Size and Share Forecast Outlook 2025 to 2035

Smart Pill Box Market

Smart Pill Box Market Size and Share Forecast Outlook 2025 to 2035

Smart Medical Mattress Market

Smart Medical Mattress Market Size and Share Forecast Outlook 2025 to 2035

Future Market Insights

Smart Contact Lens Market

Chat With MaRIA

Chat With

MaRIA

Hi There, I am MaRIA, Your Market Research Intelligence Assistant. How may I help you?