Global Snail Mucin Market Size and Share Forecast Outlook 2025 to 2035

The Global Snail Mucin Market is expected to record a valuation of USD 989.4 million in 2025 and USD 3,112.7 million in 2035, with an increase of USD 2,123.3 million, which equals a growth of ~214% over the decade. The overall expansion represents a CAGR of 12.1% and more than a 3X increase in market size.
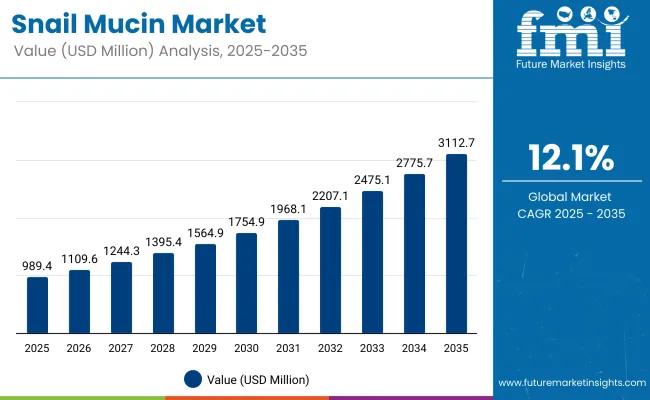
Quick Stats for Global Snail Mucin Market

  • Global Snail Mucin Market Value (2025): USD 989.4 million
  • Global Snail Mucin Market Forecast Value (2035): USD 3,112.7 million
  • Global Snail Mucin Market Forecast CAGR: 12.1%
  • Leading Segment in 2025 (Product Type): Facial Skincare - 42.3% (USD 418.52 million)
  • Leading Segment in 2025 (Skin/Hair Concern): Anti-aging & Fine Lines - 38.7% (USD 382.90 million) Leading Segment in 2025 (Packaging Type): Dropper Bottle - 36.3% (USD 359.15 million)
  • Key Growth Regions: Asia-Pacific (South Korea, China, Japan), North America, Europe
  • Top Key Players: CoSeedBioPharm Co., Ltd., Amicogen, Inc., Bioland Co., Ltd., Technature Co., Ltd., Korea BioCell Co., Ltd., Able C&C Co., Ltd., BIO-FD&C Co., Ltd., INIST BioPharm Co., Ltd., Mibelle Biochemistry, BioSpectrum, Inc., Green Cross WellBeing Co., Ltd., Bio Genesis Co., Ltd., Natural Solution Co., Ltd., LS Cosmetic Co., Ltd.

Snail Mucin Market

Global Snail Mucin Market Key Takeaways

Metric Value
Market Estimated Value in (2025E) USD 989.4 million
Market Forecast Value in (2035F) USD 3,112.7 million
Forecast CAGR (2025 to 2035) 12.1%

During the first five-year period from 2025 to 2030, the market increases from USD 989.4 million to USD 1,754.9 million, adding USD 765.5 million, which accounts for 36% of the total decade growth. This phase records steady adoption across premium beauty brands, K-beauty exports, and cosmeceutical innovation, driven by demand for proven natural actives. Facial Skincare dominates this period, catering to over 42% of product applications, especially in concentrated serums and ampoules.

The second half from 2030 to 2035 contributes USD 1,357.8 million, equal to 64% of total growth, as the market jumps from USD 1,754.9 million to USD 3,112.7 million. This acceleration is powered by global brand diversification into personal care lines, rapid e-commerce penetration in emerging markets, and rising adoption of snail mucin in multifunctional products like hybrid skincare-makeup formats.

Dropper Bottles maintain their lead in packaging due to association with premium active formulations, while growing demand for eco-friendly refill systems begins reshaping packaging dynamics by the end of the decade.

From 2020 to 2024, the Global Snail Mucin Market expanded steadily from an estimated USD 740 million to USD 920 million, driven by K-beauty brand penetration in Western markets and increased awareness of natural regenerative skincare actives.

During this period, the competitive landscape was dominated by South Korean ingredient manufacturers controlling nearly 60% of the global supply, with leaders like CoSeedBioPharm and Bioland specializing in high-purity, cruelty-free snail secretion filtrate. Competitive differentiation relied on extraction quality, purity levels, and cruelty-free certifications, while branding focused on efficacy claims backed by clinical testing.

Demand for snail mucin-based products will expand to USD 989.4 million in 2025, and the revenue mix will evolve as personal care applications gain share alongside facial skincare. Traditional ingredient suppliers face rising competition from vertically integrated brands and cosmetic OEM/ODM manufacturers offering white-label snail mucin formulations.

Major suppliers are pivoting to sustainability-led sourcing, traceability, and clean-beauty positioning to retain relevance. Emerging entrants with novel encapsulation technologies, fermentation-based extraction, and vegan-alternative mucin solutions are gaining share. The competitive advantage is moving away from basic supply capacity to innovation, ethical sourcing, and strong brand partnerships.

Why the Global Snail Mucin Market is Growing?

The Global Snail Mucin Market is expanding rapidly due to the rising popularity of natural, clinically proven active ingredients in skincare and personal care. Advances in extraction technologyincluding low-stress harvesting, enzymatic processing, and multi-stage filtrationhave improved purity, stability, and consumer safety. Snail mucin is widely recognized for its anti-aging, hydration, and barrier repair benefits, driving demand in both premium facial skincare and emerging personal care categories.

E-commerce platforms, especially in Asia-Pacific and North America, are boosting cross-border sales of snail mucin products, with K-beauty brands playing a major role in global adoption. Innovation in serums, ampoules, creams, and hybrid products is expanding market reach, while sustainability trendssuch as traceable sourcing, cruelty-free certification, and eco-friendly packagingare increasingly influencing brand strategies.

Segmental Analysis

The Global Snail Mucin Market is segmented by product type, skin/hair concern, packaging type, application area, and region. Product types include facial skincare, body care, lip care, hair & scalp care, sun & after-sun care, and men’s grooming. Skin/hair concerns cover anti-aging & fine lines, hydration, barrier repair, post-acne care, redness relief, scar & stretch-mark care, elasticity & firmness, post-procedure recovery, and scalp care.

Packaging types include dropper bottles, airless pumps, tubes, jars, single-dose capsules, sachet/mask packs, and stick formats. Application areas span face, eye contour, lips, body, hands, feet, and scalp. Regionally, the market covers North America, Latin America, Europe, East Asia, South Asia & Pacific, Central Asia, and the Middle East & Africa.
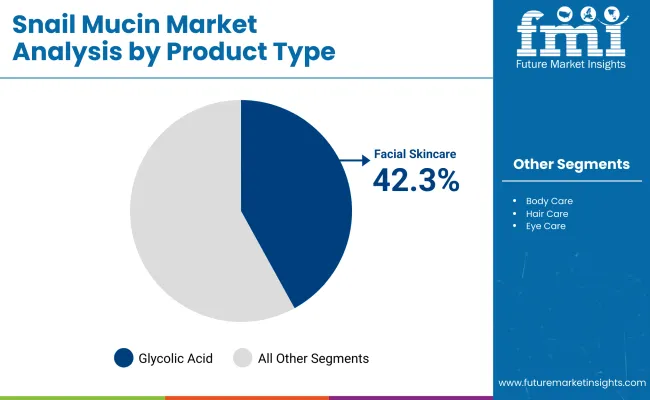
Insights into the Product Type Segment with Facial Skincare Leading in Market Share

Snail Mucin Market By Product

Product Type Segment Market Value Share, 2025
Facial Skincare 42.3%
Others 57.7%

The Facial Skincare segment is projected to contribute USD 418.52 million in 2025, representing 42.3% of the global snail mucin market and making it the dominant product category. This leadership is driven by the widespread adoption of snail mucin-based serums, ampoules, creams, and masks, which are valued for their targeted delivery of actives for anti-aging, hydration, and skin repair. Premium branding strategies, the global influence of K-beauty, and visible, clinically backed results have reinforced this dominance.

The segment’s strength also comes from higher snail mucin concentrations in facial formulations compared to other categories, which increases ingredient demand per unit sold. Innovation is strong, with brands introducing hybrid skincare-makeup formats and combining mucin with complementary actives such as hyaluronic acid, peptides, and niacinamide. By 2035, Facial Skincare is expected to retain its top position with a forecast value of USD 1,310 million, supported by ongoing consumer preference for premium, result-oriented products.

Insights into the Skin/Hair Concern Segment with Anti-aging & Fine Lines Dominating

Skin/Hair Concern Segment Market Value Share, 2025
Anti-aging & Fine Lines 38.7%
Others 61.3%

The Anti-aging & Fine Lines segment within the skin/hair concern category will lead in 2025 with USD 382.90 million in sales, representing 38.7% of the global snail mucin market. Its dominance is rooted in snail mucin’s proven ability to promote collagen production, improve skin elasticity, and reduce fine lines, making it highly appealing to both preventive and corrective skincare consumers. This category has particular strength among 25-45-year-old urban buyers who seek natural alternatives to synthetic anti-aging actives such as retinoids.

Its growth is further reinforced by cross-category presence in serums, all-in-one creams, under-eye treatments, and night repair masks, enabling brands to command premium price points. Anti-aging claims have positioned this segment as the most commercially valuable concern-based category, with its value projected to rise to USD 1,200 million by 2035 while maintaining a clear lead over hydration and barrier-repair claims.
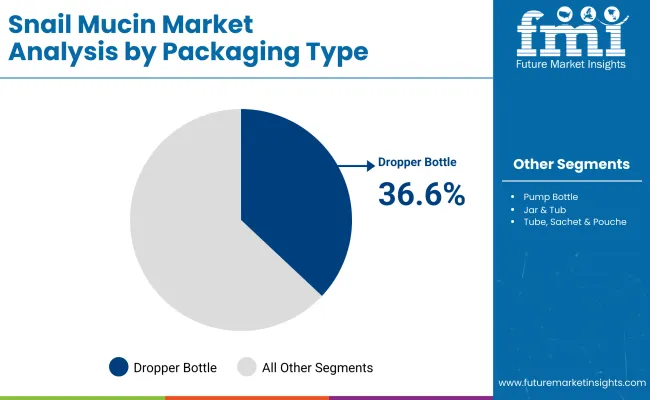
Insights into the Packaging Type Segment with Dropper Bottles Dominating

Snail Mucin Market By Packaging

Packaging Type Segment Market Value Share, 2025
Dropper Bottles 36.3%
Others 63.7%

In the packaging type category, Dropper Bottles will dominate in 2025 with USD 359.15 million in sales, representing 36.3% of the global snail mucin market. Their leadership stems from their suitability for premium, concentrated formulations such as serums and ampoules, offering precise dosage, reduced contamination risk, and a sophisticated look and feel. This format’s association with high-value, active-rich products has made it a staple in both offline retail and e-commerce channels.

Additionally, brands are increasingly introducing eco-friendly dropper options using recyclable glass, PCR plastics, and refillable systems to align with sustainability trends without compromising product integrity. By 2035, the dropper bottle segment is expected to reach USD 1,130 million, maintaining its position as the most preferred packaging format for snail mucin products while evolving in design and material innovation to meet shifting consumer expectations.

What are the Drivers, Restraints, and Key Trends of the Global Snail Mucin Market?

Drivers

Diversification into New Personal Care Categories

The Global Snail Mucin Market is witnessing strong growth as the ingredient expands beyond its traditional K-beauty facial care roots into adjacent personal care segments such as scalp serums, body lotions, and hand creams. This expansion is driven by targeted R&D efforts that adapt snail mucin’s regenerative, hydrating, and barrier-repair properties to different skin and hair needs.

By tailoring formulations for specific applications, brands are able to deliver highly specialized solutions, reinforcing snail mucin’s premium positioning. The result is a broader addressable market, with increased product launches across diverse beauty and personal care categories.

Premiumization through Dermatology-Led and Ethical Branding

Snail mucin’s integration into high-purity, cruelty-free, and clinically tested formulations in luxury and dermatology-led cosmeceutical brands is accelerating market penetration, particularly in North America and Europe. Consumers in these regions are increasingly drawn to active ingredients with proven efficacy, backed by ethical sourcing and traceability. This demand is prompting suppliers to invest in transparent supply chains, small-batch extraction, and advanced purification methods, enabling brands to justify higher price points and capture a more premium consumer base.

Restraints

Supply Chain Vulnerability from Climate and Disease Risks

The reliance on farmed snail populations creates a unique supply chain vulnerability for the market. Climate fluctuations, disease outbreaks, and environmental stressors can impact snail health and secretion yield, leading to inconsistencies in quality and supply shortages. These disruptions are particularly challenging for large-scale production contracts where brands require consistent purity levels, making long-term planning and global expansion strategies more complex.

Regulatory Pressures and Compliance Costs

Markets such as the EU are imposing stricter regulations on animal welfare, traceability, and ingredient origin disclosures, pushing snail mucin suppliers to undertake rigorous certification processes. These compliance requirements not only increase operational costs but can also delay product launches, especially for brands entering highly regulated regions. The rising need for verifiable ethical claims is reshaping sourcing strategies and adding to the overall production burden.

Key Trends

Rise of Biotechnology-Derived “Vegan Mucin”

Biotechnology innovation is giving rise to fermentation-based snail mucin alternatives that replicate the bioactive composition of traditional mucin without involving live snails. These vegan mucin solutions appeal to cruelty-free and plant-based brands while reducing the supply chain risks associated with snail farming. This trend is expanding the potential consumer base, particularly among ethically conscious and vegan beauty buyers, while positioning snail mucin-like actives as a future-proof skincare ingredient.

Multi-Active Hybrid Formulations for Advanced Skincare

Brands are increasingly incorporating snail mucin alongside trending actives such as bakuchiol, ceramides, and tranexamic acid to create hybrid formulations targeting multiple skin concerns in a single product. This approach enhances perceived value, boosts consumer loyalty, and allows brands to position their offerings as science-backed, multifunctional solutions rather than single-ingredient products. The hybrid trend is particularly strong in premium skincare, where innovation and efficacy are central to competitive differentiation.
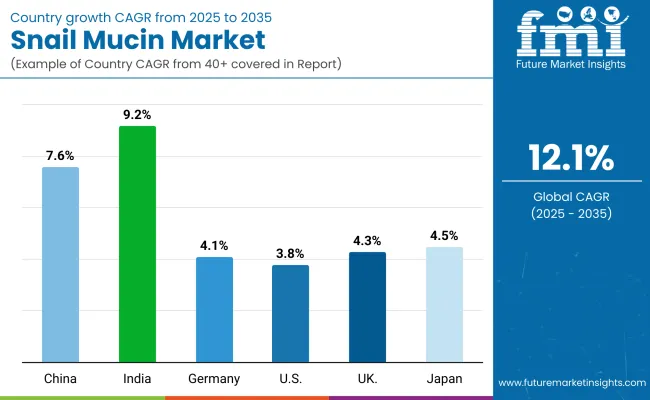
Analysis of Global Snail Mucin Market By Key Countries

Snail Mucin Market By Country

Countries CAGR (2025 to 2035)
China 7.6%
India 9.2%
Germany 4.1%
USA 3.8%
UK 4.3%
Japan 4.5%

The Global Snail Mucin Market displays notable regional differences in growth momentum, shaped by consumer awareness, beauty culture influence, and the pace of premium skincare adoption. Asia-Pacific stands out as the fastest-growing region, anchored by India at 9.2% CAGR and China at 7.6% CAGR. India’s rapid growth is fueled by rising disposable incomes, increased penetration of K-beauty brands, and a surge in domestic cosmeceutical manufacturing, particularly targeting hydration and anti-aging categories.

China’s expansion is supported by its large-scale beauty and personal care manufacturing ecosystem, aggressive marketing of multifunctional actives, and government-backed initiatives promoting innovation in cosmetic R&D and exports. Europe maintains a steady but more moderate growth profile, led by the UK at 4.3% CAGR, Germany at 4.1% CAGR, and France following closely. Germany’s growth is underpinned by its strong premium skincare market, strict EU product compliance standards, and demand for traceable, ethically sourced snail mucin.

The UK market benefits from high consumer receptivity to K-beauty trends and a strong e-commerce channel presence for imported brands, while sustainability certifications remain a major purchase driver across the continent. North America, led by the USA at 3.8% CAGR, shows the lowest growth rate among major economies, reflecting a mature beauty market where snail mucin adoption is already well-established in niche premium skincare. Growth in the USA is being driven more by product innovation such as hybrid actives and biotech-derived vegan mucin rather than new consumer acquisition.

Meanwhile, Japan posts a 4.5% CAGR, reflecting its steady demand for high-purity, clinically backed skincare actives and its role as both a consumer and influencer market for broader Asia-Pacific beauty trends. This stable growth is supported by Japan’s integration of snail mucin into high-end cosmetic formulations with a strong focus on texture refinement and skin barrier repair.

Sales Outlook for Snail Mucin in the United States

Year USA Snail Mucin Market (USD Million)
2025 198.87
2026 221.18
2027 245.99
2028 273.58
2029 304.27
2030 338.41
2031 376.37
2032 418.59
2033 465.54
2034 517.77
2035 575.85

The USA Snail Mucin Market is set to grow from USD 198.87 million in 2025 to USD 575.85 million by 2035, at a CAGR of 11.2%. This expansion is led by rising consumer interest in K-beauty-inspired formulations and dermatologist-backed claims around hydration, skin repair, and barrier strengthening.

Premium positioning is reinforced by the demand for concentrated snail mucin serums, with facial skincare emerging as the dominant category, accounting for 45.8% (USD 91.08 million) of 2025 sales. Growth is also supported by e-commerce-led availability of niche Korean brands, strategic retail partnerships, and increasing adoption among men’s grooming lines.

Growth and Expansion Outlook for Snail Mucin in the United Kingdom

The UK Snail Mucin Market is projected to expand at a CAGR of around 8.5% between 2025 and 2035, though its share will decline from 6.3% to 5.2% as faster-growing Asian markets increase their dominance. In the UK, adoption is concentrated in hydration-focused and anti-aging products, supported by strong penetration of beauty subscription boxes, influencer-driven marketing, and expansion of premium K-beauty retail displays in department stores. While facial skincare leads the adoption, growth in multi-benefit productscombining snail mucin with niacinamide, ceramides, or peptidesis emerging as a key differentiator.

Growth and Expansion Outlook for Snail Mucin in India

India is set to record one of the highest growth rates globally, with market share rising from 12.3% in 2025 to 15.2% in 2035. The rapid adoption is driven by urban middle-class consumers embracing multi-step skincare routines and the entry of both affordable and premium snail mucin products into modern trade and online platforms.

High climate variability across regionsfrom dry winters to humid summershas encouraged year-round use. Indian consumers are increasingly drawn to anti-aging and barrier-repair benefits, and domestic manufacturers are exploring hybrid products that blend snail mucin with Ayurveda-inspired actives to capture both traditional and modern beauty segments.

Sales Outlook for Snail Mucin in China

Market Share 2025
China 17.2%
India 12.3%
Germany 7.2%
USA 20.1%
UK 6.3%
Japan 9.4%
Market Share 2035
China 19.2%
India 15.2%
Germany 6.1%
USA 18.5%
UK 5.2%
Japan 8.3%

China is expected to grow at a CAGR of 12.7% from 2025 to 2035, with market share increasing from 17.2% to 19.2% and a 2035 market value of USD 170.18 million. The Anti-aging & Fine Lines category leads the market, holding 39.2% (USD 66.71 million) of 2025 sales.

Growth is fueled by the popularity of snail mucin as a high-performance, naturally derived ingredient capable of improving elasticity and reducing fine lines. Social commerce platforms like Douyin and Xiaohongshu are accelerating product discovery, while local brands continue to innovate with snail mucin sheet masks, sprays, and creams targeting younger demographics for preventive skincare.

Growth Outlook for Snail Mucin Market in the United States

Product Type Segment Market Value Share, 2025
Facial Skincare 45.8%
Others 54.2%

The Snail Mucin Market in the United States is projected at USD 198.87 million in 2025, with Facial Skincare products contributing 45.8% of total value. This dominance stems from the rising demand for targeted solutions such as snail mucin serums, creams, and masks, which are perceived as high-efficacy products for hydration, skin barrier repair, and visible anti-aging results. The category’s growth is also reinforced by premium positioning through K-beauty influence and strong penetration in both online and offline specialty beauty channels.

While the “Others” categoryincluding body care, hair care, and multi-purpose formulationsstill holds a slight majority share, the faster growth trajectory lies within facial skincare due to its higher consumer willingness to pay for concentrated actives. USA consumers are increasingly aligning skincare purchases with dermatological claims and clean beauty credentials, making snail mucin-based facial products a prime beneficiary of these trends.

  • Market in the USA holds 20.1% share in 2025 in the global market.
  • Facial Skincare leads over “Others” at 45.8% vs 54.2% share split.
  • Growth supported by strong consumer adoption of K-beauty formats and premium hydration/anti-aging claims.

Growth Outlook for Snail Mucin Market in China

Skin/Hair Segment Market Value Share, 2025
Anti-aging & Fine Lines 39.2%
Others 60.8%

The Snail Mucin Market in China is valued at USD 170.18 million in 2025, with Anti-aging & Fine Lines products accounting for 39.2% of sales. This segment’s strength reflects the high prioritization of preventive and corrective anti-aging solutions among Chinese consumers, particularly within the 25-45 demographic. Snail mucin’s reputation for enhancing collagen production, improving skin elasticity, and delivering a smoother texture aligns closely with these needs, making it a favored active in both domestic and international brand portfolios.

The “Others” category, encompassing hydration, skin barrier repair, and brightening concerns, holds the majority share, but anti-aging continues to be the primary image-building and premium-priced segment. Influencer marketing, livestreaming e-commerce, and local innovation in sheet masks and ampoules are further driving awareness and trial among younger, skincare-savvy buyers.
  • Market size for China in 2025 is USD 170.18 million.
  • Global market share is approximately 17.2% in 2025.
  • Anti-aging & Fine Lines leads within concern-based segmentation due to high consumer focus on visible results and collagen-boosting actives.

Competitive Landscape of Global Snail Mucin Market

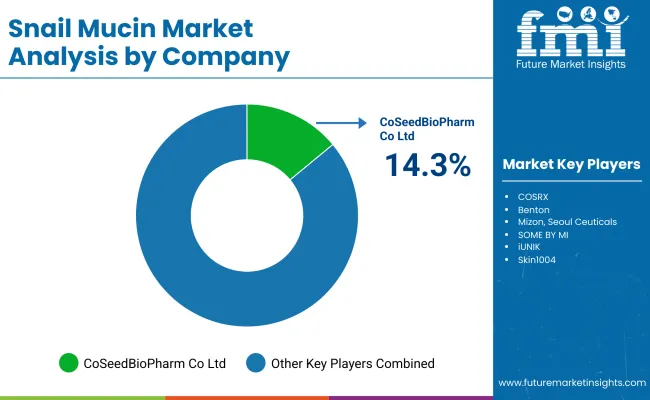
Snail Mucin Market By Company

The Global Snail Mucin Market is moderately fragmented, with a mix of large-scale ingredient producers, mid-tier cosmetic formulators, and niche artisanal brands competing across diverse end-use applications. CoSeedBioPharm Co., Ltd. holds the largest individual market share at 14.3% in 2025, driven by its vertically integrated supply chain from snail farming to purified mucin extraction, ensuring consistent quality and bioactive concentration.

The company’s partnerships with leading K-beauty brands and expansion into cosmeceutical-grade formulations for anti-aging and skin repair have further strengthened its global footprint. The remaining 85.7% share is distributed among a wide range of playersfrom established Asian cosmetic manufacturers to emerging clean beauty startupseach leveraging unique positioning.

Mid-sized innovators are focusing on high-purity, cruelty-free snail mucin variants, investing in biotechnology-based extraction processes to appeal to ethically conscious consumers. Brands are increasingly differentiating through proprietary formulation blends that combine snail mucin with hyaluronic acid, peptides, or plant-based antioxidants to enhance efficacy and marketing appeal.

Specialized providers, including small-scale regional producers in Southeast Asia and Latin America, are catering to localized preferences by integrating snail mucin into traditional beauty regimens and multi-functional skin treatments. Competitive strategies are evolving beyond ingredient purity to emphasize sustainability, traceability, and brand storytellingwith transparency on sourcing and processing becoming a key purchase driver in both online and offline premium beauty channels.

Key Developments in Global Snail Mucin Market

  • On March 12, 2025, CoSeedBioPharm launched “Golden Shell Mucin,” a novel snail secretion filtrate product with inherent UV-blocking, regenerative, and anti-inflammatory properties boosting SPF from 11.8 to 19.6 when formulated at 1% concentration, per B2B specification sheets
  • On July 8, 2025, CoSeedBioPharm introduced “Alo‑Mucin,” a snail mucin variant enriched with aloe polysaccharides for enhanced moisturizing, soothing, and regeneration effects; the product passed a 48-hour patch test among 30 volunteers with no irritation recorded.

Scope of the Report

Item Value
Quantitative Units USD 989.4 million
Product Type Facial Skincare, Body Care, Hair Care, Eye Care, Lip Care, Others
Skin/Hair Concern Anti-aging & Fine Lines, Hydration & Moisturization, Brightening & Pigmentation, Acne & Blemishes, Hair Repair & Strengthening, Others
Packaging Type Dropper Bottles, Pump Bottles, Jars & Tubs, Tubes, Sachets & Pouches, Others
Sales Channel Online (E-commerce Marketplaces, Brand-owned Websites), Offline (Specialty Stores, Supermarkets & Hypermarkets, Pharmacy/Drugstores, Beauty Salons), Others
Regions Covered North America, Europe, Asia-Pacific, Latin America, Middle East & Africa
Country Covered United States, Canada, Germany, France, United Kingdom, China, Japan, India, Brazil, South Africa
Key Companies Profiled CoSeedBioPharm Co., Ltd., COSRX, Benton, Mizon, Seoul Ceuticals, SOME BY MI, iUNIK, Skin1004, ElishaCoy, BIO-FD&C Co., Ltd., The Saem, TONYMOLY, It’s Skin, Missha, Nature Republic, Holika Holika, A’PIEU, Medipeel, Dewytree, Secret Key
Additional Attributes Dollar sales by product type, skin/hair concern, packaging type, end-use, and sales channel; adoption trends in K-beauty and natural actives; surging demand for anti-aging and hydration-focused formulations; expansion of premium and clean beauty product lines; professional and salon-oriented offerings; rapid e-commerce penetration; regional growth driven by influencer marketing, TikTok virality, and celebrity endorsements; innovation in snail secretion extraction, purification, and stability-enhancing encapsulation technologies.

Key Segments

By Product Type:

  • Facial Hydrating Sprays
  • Body Hydrating Sprays
  • Hair Hydrating Sprays
  • Multi-Purpose Hydrating Sprays

By Ingredient Base:

  • Water-Based
  • Humectant-Enriched
  • Botanical Extract-Based
  • Vitamin-Enriched / Antioxidant Sprays
  • SPF or Functional Additive-Based
  • Natural / Organic Formulations

By Packaging Size:

  • Below 100 ml
  • 100-200 ml
  • 201-300 ml
  • Above 300 ml

By Distribution Channel:

  • Offline Channels
    • Supermarkets / Hypermarkets
    • Beauty & Cosmetics Specialty Stores
    • Pharmacies / Drugstores
    • Department Stores
    • Salons & Spas
  • Online Channels
    • E-commerce Marketplaces
    • Brand-Owned D2C Websites
    • Subscription-Based Online Models

By Region:

  • South Asia & Pacific
  • North America
  • Latin America
  • Europe
  • East Asia
  • Middle East and Africa

Table of Content

  1. Executive Summary
    • Global Market Outlook
    • Demand-side Trends
    • Supply-side Trends
    • Technology Roadmap Analysis
    • Analysis and Recommendations
  2. Market Overview
    • Market Coverage / Taxonomy
    • Market Definition / Scope / Limitations
  3. Market Background
    • Market Dynamics
      • Drivers
      • Restraints
      • Opportunity
      • Trends
    • Scenario Forecast
      • Demand in Optimistic Scenario
      • Demand in Likely Scenario
      • Demand in Conservative Scenario
    • Opportunity Map Analysis
    • Product Life Cycle Analysis
    • Supply Chain Analysis
      • Supply Side Participants and their Roles
        • Producers
        • Mid-Level Participants (Traders/ Agents/ Brokers)
        • Wholesalers and Distributors
      • Value Added and Value Created at Node in the Supply Chain
      • List of Raw Material Suppliers
      • List of Existing and Potential Buyer’s
    • Investment Feasibility Matrix
    • Value Chain Analysis
      • Profit Margin Analysis
      • Wholesalers and Distributors
      • Retailers
    • PESTLE and Porter’s Analysis
    • Regulatory Landscape
      • By Key Regions
      • By Key Countries
    • Regional Parent Market Outlook
    • Production and Consumption Statistics
    • Import and Export Statistics
  4. Global Market Analysis 2020 to 2024 and Forecast, 2025 to 2035
    • Historical Market Size Value (USD Million) & Volume (Units) Analysis, 2020 to 2024
    • Current and Future Market Size Value (USD Million) & Volume (Units) Projections, 2025 to 2035
      • Y-o-Y Growth Trend Analysis
      • Absolute $ Opportunity Analysis
  5. Global Market Analysis 2020 to 2024 and Forecast 2025 to 2035, By Product Type
    • Introduction / Key Findings
    • Historical Market Size Value (USD Million) & Volume (Units) Analysis By Product Type, 2020 to 2024
    • Current and Future Market Size Value (USD Million) & Volume (Units) Analysis and Forecast By Product Type, 2025 to 2035
      • Facial Hydrating Sprays
      • Body Hydrating Sprays
      • Hair Hydrating Sprays
      • Multi-Purpose Hydrating Sprays
    • Y-o-Y Growth Trend Analysis By Product Type, 2020 to 2024
    • Absolute $ Opportunity Analysis By Product Type, 2025 to 2035
  6. Global Market Analysis 2020 to 2024 and Forecast 2025 to 2035, By Ingredient Base
    • Introduction / Key Findings
    • Historical Market Size Value (USD Million) & Volume (Units) Analysis By Ingredient Base, 2020 to 2024
    • Current and Future Market Size Value (USD Million) & Volume (Units) Analysis and Forecast By Ingredient Base, 2025 to 2035
      • Water-Based
      • Humectant-Enriched
      • Botanical Extract-Based
      • Vitamin-Enriched / Antioxidant Sprays
      • SPF or Functional Additive-Based
      • Natural / Organic Formulations
    • Y-o-Y Growth Trend Analysis By Ingredient Base, 2020 to 2024
    • Absolute $ Opportunity Analysis By Ingredient Base, 2025 to 2035
  7. Global Market Analysis 2020 to 2024 and Forecast 2025 to 2035, By Packaging Size
    • Introduction / Key Findings
    • Historical Market Size Value (USD Million) & Volume (Units) Analysis By Packaging Size, 2020 to 2024
    • Current and Future Market Size Value (USD Million) & Volume (Units) Analysis and Forecast By Packaging Size, 2025 to 2035
      • Below 100 ml
      • 100-200 ml
      • 201-300 ml
      • Above 300 ml
    • Y-o-Y Growth Trend Analysis By Packaging Size, 2020 to 2024
    • Absolute $ Opportunity Analysis By Packaging Size, 2025 to 2035
  8. Global Market Analysis 2020 to 2024 and Forecast 2025 to 2035, By Distribution Channel
    • Introduction / Key Findings
    • Historical Market Size Value (USD Million) & Volume (Units) Analysis By Distribution Channel, 2020 to 2024
    • Current and Future Market Size Value (USD Million) & Volume (Units) Analysis and Forecast By Distribution Channel, 2025 to 2035
      • Offline Channels
        • Supermarkets / Hypermarkets
        • Beauty & Cosmetics Specialty Stores
        • Pharmacies / Drugstores
        • Department Stores
        • Salons & Spas
      • Online Channels
        • E-commerce Marketplaces
        • Brand-Owned D2C Websites
        • Subscription-Based Online Models
    • Y-o-Y Growth Trend Analysis By Distribution Channel, 2020 to 2024
    • Absolute $ Opportunity Analysis By Distribution Channel, 2025 to 2035
  9. Global Market Analysis 2020 to 2024 and Forecast 2025 to 2035, By Region
    • Introduction
    • Historical Market Size Value (USD Million) & Volume (Units) Analysis By Region, 2020 to 2024
    • Current Market Size Value (USD Million) & Volume (Units) Analysis and Forecast By Region, 2025 to 2035
      • South Asia & Pacific
      • North America
      • Latin America
      • Europe
      • East Asia
      • Middle East and Africa
    • Market Attractiveness Analysis By Region
  10. South Asia & Pacific Market Analysis 2020 to 2024 and Forecast 2025 to 2035, By Country
    • Historical Market Size Value (USD Million) & Volume (Units) Trend Analysis By Market Taxonomy, 2020 to 2024
    • Market Size Value (USD Million) & Volume (Units) Forecast By Market Taxonomy, 2025 to 2035
      • By Country
        • India
        • Thailand
        • Malaysia
        • Indonesia
        • Singapore
        • Vietnam
        • Australia
        • New Zealand
        • Rest of South Asia
      • By Product Type
      • By Ingredient Base
      • By Packaging Size
      • By Distribution Channel
    • Market Attractiveness Analysis
      • By Country
      • By Product Type
      • By Ingredient Base
      • By Packaging Size
      • By Distribution Channel
    • Key Takeaways
  11. North America Market Analysis 2020 to 2024 and Forecast 2025 to 2035, By Country
    • Historical Market Size Value (USD Million) & Volume (Units) Trend Analysis By Market Taxonomy, 2020 to 2024
    • Market Size Value (USD Million) & Volume (Units) Forecast By Market Taxonomy, 2025 to 2035
      • By Country
        • USA
        • Canada
      • By Product Type
      • By Ingredient Base
      • By Packaging Size
      • By Distribution Channel
    • Market Attractiveness Analysis
      • By Country
      • By Product Type
      • By Ingredient Base
      • By Packaging Size
      • By Distribution Channel
    • Key Takeaways
  12. Latin America Market Analysis 2020 to 2024 and Forecast 2025 to 2035, By Country
    • Historical Market Size Value (USD Million) & Volume (Units) Trend Analysis By Market Taxonomy, 2020 to 2024
    • Market Size Value (USD Million) & Volume (Units) Forecast By Market Taxonomy, 2025 to 2035
      • By Country
        • Brazil
        • Mexico
        • Colombia
        • Rest of Latin America
      • By Product Type
      • By Ingredient Base
      • By Packaging Size
      • By Distribution Channel
    • Market Attractiveness Analysis
      • By Country
      • By Product Type
      • By Ingredient Base
      • By Packaging Size
      • By Distribution Channel
    • Key Takeaways
  13. Europe Market Analysis 2020 to 2024 and Forecast 2025 to 2035, By Country
    • Historical Market Size Value (USD Million) & Volume (Units) Trend Analysis By Market Taxonomy, 2020 to 2024
    • Market Size Value (USD Million) & Volume (Units) Forecast By Market Taxonomy, 2025 to 2035
      • By Country
        • Germany
        • UK
        • France
        • Italy
        • Spain
        • Belgium
        • Netherlands
        • Nordic
        • Switzerland
        • Russia
        • Poland
        • Rest of Europe
      • By Product Type
      • By Ingredient Base
      • By Packaging Size
      • By Distribution Channel
    • Market Attractiveness Analysis
      • By Country
      • By Product Type
      • By Ingredient Base
      • By Packaging Size
      • By Distribution Channel
    • Key Takeaways
  14. East Asia Market Analysis 2020 to 2024 and Forecast 2025 to 2035, By Country
    • Historical Market Size Value (USD Million) & Volume (Units) Trend Analysis By Market Taxonomy, 2020 to 2024
    • Market Size Value (USD Million) & Volume (Units) Forecast By Market Taxonomy, 2025 to 2035
      • By Country
        • China
        • Japan
        • South Korea
      • By Product Type
      • By Ingredient Base
      • By Packaging Size
      • By Distribution Channel
    • Market Attractiveness Analysis
      • By Country
      • By Product Type
      • By Ingredient Base
      • By Packaging Size
      • By Distribution Channel
    • Key Takeaways
  15. Middle East and Africa Market Analysis 2020 to 2024 and Forecast 2025 to 2035, By Country
    • Historical Market Size Value (USD Million) & Volume (Units) Trend Analysis By Market Taxonomy, 2020 to 2024
    • Market Size Value (USD Million) & Volume (Units) Forecast By Market Taxonomy, 2025 to 2035
      • By Country
        • Turkey
        • UAE
        • Saudi Arabia
        • Israel
        • Other GCC Countries
        • North Africa
        • South Africa
      • By Product Type
      • By Ingredient Base
      • By Packaging Size
      • By Distribution Channel
    • Market Attractiveness Analysis
      • By Country
      • By Product Type
      • By Ingredient Base
      • By Packaging Size
      • By Distribution Channel
    • Key Takeaways
  16. Key Countries Market Analysis
    • USA
      • Pricing Analysis
      • Market Share Analysis, 2024
        • By Product Type
        • By Ingredient Base
        • By Packaging Size
        • By Distribution Channel
    • Canada
      • Pricing Analysis
      • Market Share Analysis, 2024
        • By Product Type
        • By Ingredient Base
        • By Packaging Size
        • By Distribution Channel
    • Brazil
      • Pricing Analysis
      • Market Share Analysis, 2024
        • By Product Type
        • By Ingredient Base
        • By Packaging Size
        • By Distribution Channel
    • Mexico
      • Pricing Analysis
      • Market Share Analysis, 2024
        • By Product Type
        • By Ingredient Base
        • By Packaging Size
        • By Distribution Channel
    • Colombia
      • Pricing Analysis
      • Market Share Analysis, 2024
        • By Product Type
        • By Ingredient Base
        • By Packaging Size
        • By Distribution Channel
    • Rest of Latin America
      • Pricing Analysis
      • Market Share Analysis, 2024
        • By Product Type
        • By Ingredient Base
        • By Packaging Size
        • By Distribution Channel
    • Germany
      • Pricing Analysis
      • Market Share Analysis, 2024
        • By Product Type
        • By Ingredient Base
        • By Packaging Size
        • By Distribution Channel
    • UK
      • Pricing Analysis
      • Market Share Analysis, 2024
        • By Product Type
        • By Ingredient Base
        • By Packaging Size
        • By Distribution Channel
    • France
      • Pricing Analysis
      • Market Share Analysis, 2024
        • By Product Type
        • By Ingredient Base
        • By Packaging Size
        • By Distribution Channel
    • Italy
      • Pricing Analysis
      • Market Share Analysis, 2024
        • By Product Type
        • By Ingredient Base
        • By Packaging Size
        • By Distribution Channel
    • Spain
      • Pricing Analysis
      • Market Share Analysis, 2024
        • By Product Type
        • By Ingredient Base
        • By Packaging Size
        • By Distribution Channel
    • Belgium
      • Pricing Analysis
      • Market Share Analysis, 2024
        • By Product Type
        • By Ingredient Base
        • By Packaging Size
        • By Distribution Channel
    • Netherlands
      • Pricing Analysis
      • Market Share Analysis, 2024
        • By Product Type
        • By Ingredient Base
        • By Packaging Size
        • By Distribution Channel
    • Nordic
      • Pricing Analysis
      • Market Share Analysis, 2024
        • By Product Type
        • By Ingredient Base
        • By Packaging Size
        • By Distribution Channel
    • Switzerland
      • Pricing Analysis
      • Market Share Analysis, 2024
        • By Product Type
        • By Ingredient Base
        • By Packaging Size
        • By Distribution Channel
    • Russia
      • Pricing Analysis
      • Market Share Analysis, 2024
        • By Product Type
        • By Ingredient Base
        • By Packaging Size
        • By Distribution Channel
    • Poland
      • Pricing Analysis
      • Market Share Analysis, 2024
        • By Product Type
        • By Ingredient Base
        • By Packaging Size
        • By Distribution Channel
    • Rest of Europe
      • Pricing Analysis
      • Market Share Analysis, 2024
        • By Product Type
        • By Ingredient Base
        • By Packaging Size
        • By Distribution Channel
    • China
      • Pricing Analysis
      • Market Share Analysis, 2024
        • By Product Type
        • By Ingredient Base
        • By Packaging Size
        • By Distribution Channel
    • Japan
      • Pricing Analysis
      • Market Share Analysis, 2024
        • By Product Type
        • By Ingredient Base
        • By Packaging Size
        • By Distribution Channel
    • South Korea
      • Pricing Analysis
      • Market Share Analysis, 2024
        • By Product Type
        • By Ingredient Base
        • By Packaging Size
        • By Distribution Channel
    • India
      • Pricing Analysis
      • Market Share Analysis, 2024
        • By Product Type
        • By Ingredient Base
        • By Packaging Size
        • By Distribution Channel
    • Thailand
      • Pricing Analysis
      • Market Share Analysis, 2024
        • By Product Type
        • By Ingredient Base
        • By Packaging Size
        • By Distribution Channel
    • Malaysia
      • Pricing Analysis
      • Market Share Analysis, 2024
        • By Product Type
        • By Ingredient Base
        • By Packaging Size
        • By Distribution Channel
    • Indonesia
      • Pricing Analysis
      • Market Share Analysis, 2024
        • By Product Type
        • By Ingredient Base
        • By Packaging Size
        • By Distribution Channel
    • Singapore
      • Pricing Analysis
      • Market Share Analysis, 2024
        • By Product Type
        • By Ingredient Base
        • By Packaging Size
        • By Distribution Channel
    • Vietnam
      • Pricing Analysis
      • Market Share Analysis, 2024
        • By Product Type
        • By Ingredient Base
        • By Packaging Size
        • By Distribution Channel
    • Australia
      • Pricing Analysis
      • Market Share Analysis, 2024
        • By Product Type
        • By Ingredient Base
        • By Packaging Size
        • By Distribution Channel
    • New Zealand
      • Pricing Analysis
      • Market Share Analysis, 2024
        • By Product Type
        • By Ingredient Base
        • By Packaging Size
        • By Distribution Channel
    • Rest of South Asia
      • Pricing Analysis
      • Market Share Analysis, 2024
        • By Product Type
        • By Ingredient Base
        • By Packaging Size
        • By Distribution Channel
  17. Market Structure Analysis
    • Competition Dashboard
    • Competition Benchmarking
    • Market Share Analysis of Top Players
      • By Regional
      • By Product Type
      • By Ingredient Base
      • By Packaging Size
      • By Distribution Channel
  18. Competition Analysis
    • Competition Deep Dive
      • Unilever
        • Overview
        • Product Portfolio
        • Profitability by Market Segments (Product/Age /Sales Channel/Region)
        • Sales Footprint
        • Strategy Overview
          • Marketing Strategy
          • Product Strategy
          • Channel Strategy
      • L’Oréal
        • Overview
        • Product Portfolio
        • Profitability by Market Segments (Product/Age /Sales Channel/Region)
        • Sales Footprint
        • Strategy Overview
          • Marketing Strategy
          • Product Strategy
          • Channel Strategy
      • Estée Lauder Companies
        • Overview
        • Product Portfolio
        • Profitability by Market Segments (Product/Age /Sales Channel/Region)
        • Sales Footprint
        • Strategy Overview
          • Marketing Strategy
          • Product Strategy
          • Channel Strategy
      • Shiseido
        • Overview
        • Product Portfolio
        • Profitability by Market Segments (Product/Age /Sales Channel/Region)
        • Sales Footprint
        • Strategy Overview
          • Marketing Strategy
          • Product Strategy
          • Channel Strategy
      • Johnson & Johnson Services, Inc.
        • Overview
        • Product Portfolio
        • Profitability by Market Segments (Product/Age /Sales Channel/Region)
        • Sales Footprint
        • Strategy Overview
          • Marketing Strategy
          • Product Strategy
          • Channel Strategy
      • Cardinal Sprayers
        • Overview
        • Product Portfolio
        • Profitability by Market Segments (Product/Age /Sales Channel/Region)
        • Sales Footprint
        • Strategy Overview
          • Marketing Strategy
          • Product Strategy
          • Channel Strategy
      • Oriflame Cosmetics AG
        • Overview
        • Product Portfolio
        • Profitability by Market Segments (Product/Age /Sales Channel/Region)
        • Sales Footprint
        • Strategy Overview
          • Marketing Strategy
          • Product Strategy
          • Channel Strategy
      • Kao Corporation
        • Overview
        • Product Portfolio
        • Profitability by Market Segments (Product/Age /Sales Channel/Region)
        • Sales Footprint
        • Strategy Overview
          • Marketing Strategy
          • Product Strategy
          • Channel Strategy
      • Procter & Gamble
        • Overview
        • Product Portfolio
        • Profitability by Market Segments (Product/Age /Sales Channel/Region)
        • Sales Footprint
        • Strategy Overview
          • Marketing Strategy
          • Product Strategy
          • Channel Strategy
      • Revlon
        • Overview
        • Product Portfolio
        • Profitability by Market Segments (Product/Age /Sales Channel/Region)
        • Sales Footprint
        • Strategy Overview
          • Marketing Strategy
          • Product Strategy
          • Channel Strategy
      • Eau Thermale Avène
        • Overview
        • Product Portfolio
        • Profitability by Market Segments (Product/Age /Sales Channel/Region)
        • Sales Footprint
        • Strategy Overview
          • Marketing Strategy
          • Product Strategy
          • Channel Strategy
      • Mario Badescu Skin Care Inc.
        • Overview
        • Product Portfolio
        • Profitability by Market Segments (Product/Age /Sales Channel/Region)
        • Sales Footprint
        • Strategy Overview
          • Marketing Strategy
          • Product Strategy
          • Channel Strategy
      • The Nature’s Co.
        • Overview
        • Product Portfolio
        • Profitability by Market Segments (Product/Age /Sales Channel/Region)
        • Sales Footprint
        • Strategy Overview
          • Marketing Strategy
          • Product Strategy
          • Channel Strategy
      • Heritage Store
        • Overview
        • Product Portfolio
        • Profitability by Market Segments (Product/Age /Sales Channel/Region)
        • Sales Footprint
        • Strategy Overview
          • Marketing Strategy
          • Product Strategy
          • Channel Strategy
      • La Roche Posay
        • Overview
        • Product Portfolio
        • Profitability by Market Segments (Product/Age /Sales Channel/Region)
        • Sales Footprint
        • Strategy Overview
          • Marketing Strategy
          • Product Strategy
          • Channel Strategy
  19. Assumptions & Acronyms Used
  20. Research Methodology

List of Tables

  • Table 1: Global Market Value (USD Million) Forecast by Region, 2020-2035
  • Table 2: Global Market Volume (Units) Forecast by Region, 2020-2035
  • Table 3: Global Market Value (USD Million) Forecast by Product Type, 2020-2035
  • Table 4: Global Market Volume (Units) Forecast by Product Type, 2020-2035
  • Table 5: Global Market Value (USD Million) Forecast by Ingredient Base, 2020-2035
  • Table 6: Global Market Volume (Units) Forecast by Ingredient Base, 2020-2035
  • Table 7: Global Market Value (USD Million) Forecast by Packaging Size, 2020-2035
  • Table 8: Global Market Volume (Units) Forecast by Packaging Size, 2020-2035
  • Table 9: Global Market Value (USD Million) Forecast by Distribution Channel, 2020-2035
  • Table 10: Global Market Volume (Units) Forecast by Distribution Channel, 2020-2035
  • Table 11: South Asia & Pacific Market Value (USD Million) Forecast by Country, 2020-2035
  • Table 12: South Asia & Pacific Market Volume (Units) Forecast by Country, 2020-2035
  • Table 13: South Asia & Pacific Market Value (USD Million) Forecast by Product Type, 2020-2035
  • Table 14: South Asia & Pacific Market Volume (Units) Forecast by Product Type, 2020-2035
  • Table 15: South Asia & Pacific Market Value (USD Million) Forecast by Ingredient Base, 2020-2035
  • Table 16: South Asia & Pacific Market Volume (Units) Forecast by Ingredient Base, 2020-2035
  • Table 17: South Asia & Pacific Market Value (USD Million) Forecast by Packaging Size, 2020-2035
  • Table 18: South Asia & Pacific Market Volume (Units) Forecast by Packaging Size, 2020-2035
  • Table 19: South Asia & Pacific Market Value (USD Million) Forecast by Distribution Channel, 2020-2035
  • Table 20: South Asia & Pacific Market Volume (Units) Forecast by Distribution Channel, 2020-2035
  • Table 21: North America Market Value (USD Million) Forecast by Country, 2020-2035
  • Table 22: North America Market Volume (Units) Forecast by Country, 2020-2035
  • Table 23: North America Market Value (USD Million) Forecast by Product Type, 2020-2035
  • Table 24: North America Market Volume (Units) Forecast by Product Type, 2020-2035
  • Table 25: North America Market Value (USD Million) Forecast by Ingredient Base, 2020-2035
  • Table 26: North America Market Volume (Units) Forecast by Ingredient Base, 2020-2035
  • Table 27: North America Market Value (USD Million) Forecast by Packaging Size, 2020-2035
  • Table 28: North America Market Volume (Units) Forecast by Packaging Size, 2020-2035
  • Table 29: North America Market Value (USD Million) Forecast by Distribution Channel, 2020-2035
  • Table 30: North America Market Volume (Units) Forecast by Distribution Channel, 2020-2035
  • Table 31: Latin America Market Value (USD Million) Forecast by Country, 2020-2035
  • Table 32: Latin America Market Volume (Units) Forecast by Country, 2020-2035
  • Table 33: Latin America Market Value (USD Million) Forecast by Product Type, 2020-2035
  • Table 34: Latin America Market Volume (Units) Forecast by Product Type, 2020-2035
  • Table 35: Latin America Market Value (USD Million) Forecast by Ingredient Base, 2020-2035
  • Table 36: Latin America Market Volume (Units) Forecast by Ingredient Base, 2020-2035
  • Table 37: Latin America Market Value (USD Million) Forecast by Packaging Size, 2020-2035
  • Table 38: Latin America Market Volume (Units) Forecast by Packaging Size, 2020-2035
  • Table 39: Latin America Market Value (USD Million) Forecast by Distribution Channel, 2020-2035
  • Table 40: Latin America Market Volume (Units) Forecast by Distribution Channel, 2020-2035
  • Table 41: Europe Market Value (USD Million) Forecast by Country, 2020-2035
  • Table 42: Europe Market Volume (Units) Forecast by Country, 2020-2035
  • Table 43: Europe Market Value (USD Million) Forecast by Product Type, 2020-2035
  • Table 44: Europe Market Volume (Units) Forecast by Product Type, 2020-2035
  • Table 45: Europe Market Value (USD Million) Forecast by Ingredient Base, 2020-2035
  • Table 46: Europe Market Volume (Units) Forecast by Ingredient Base, 2020-2035
  • Table 47: Europe Market Value (USD Million) Forecast by Packaging Size, 2020-2035
  • Table 48: Europe Market Volume (Units) Forecast by Packaging Size, 2020-2035
  • Table 49: Europe Market Value (USD Million) Forecast by Distribution Channel, 2020-2035
  • Table 50: Europe Market Volume (Units) Forecast by Distribution Channel, 2020-2035
  • Table 51: East Asia Market Value (USD Million) Forecast by Country, 2020-2035
  • Table 52: East Asia Market Volume (Units) Forecast by Country, 2020-2035
  • Table 53: East Asia Market Value (USD Million) Forecast by Product Type, 2020-2035
  • Table 54: East Asia Market Volume (Units) Forecast by Product Type, 2020-2035
  • Table 55: East Asia Market Value (USD Million) Forecast by Ingredient Base, 2020-2035
  • Table 56: East Asia Market Volume (Units) Forecast by Ingredient Base, 2020-2035
  • Table 57: East Asia Market Value (USD Million) Forecast by Packaging Size, 2020-2035
  • Table 58: East Asia Market Volume (Units) Forecast by Packaging Size, 2020-2035
  • Table 59: East Asia Market Value (USD Million) Forecast by Distribution Channel, 2020-2035
  • Table 60: East Asia Market Volume (Units) Forecast by Distribution Channel, 2020-2035
  • Table 61: Middle East and Africa Market Value (USD Million) Forecast by Country, 2020-2035
  • Table 62: Middle East and Africa Market Volume (Units) Forecast by Country, 2020-2035
  • Table 63: Middle East and Africa Market Value (USD Million) Forecast by Product Type, 2020-2035
  • Table 64: Middle East and Africa Market Volume (Units) Forecast by Product Type, 2020-2035
  • Table 65: Middle East and Africa Market Value (USD Million) Forecast by Ingredient Base, 2020-2035
  • Table 66: Middle East and Africa Market Volume (Units) Forecast by Ingredient Base, 2020-2035
  • Table 67: Middle East and Africa Market Value (USD Million) Forecast by Packaging Size, 2020-2035
  • Table 68: Middle East and Africa Market Volume (Units) Forecast by Packaging Size, 2020-2035
  • Table 69: Middle East and Africa Market Value (USD Million) Forecast by Distribution Channel, 2020-2035
  • Table 70: Middle East and Africa Market Volume (Units) Forecast by Distribution Channel, 2020-2035

List of Figures

  • Figure 1: Global Market Value (USD Million) by Product Type, 2025-2035
  • Figure 2: Global Market Value (USD Million) by Ingredient Base, 2025-2035
  • Figure 3: Global Market Value (USD Million) by Packaging Size, 2025-2035
  • Figure 4: Global Market Value (USD Million) by Distribution Channel, 2025-2035
  • Figure 5: Global Market Value (USD Million) by Region, 2025-2035
  • Figure 6: Global Market Value (USD Million) Analysis by Region, 2020-2035
  • Figure 7: Global Market Volume (Units) Analysis by Region, 2020-2035
  • Figure 8: Global Market Value Share (%) and BPS Analysis by Region, 2025-2035
  • Figure 9: Global Market Y-o-Y Growth (%) Projections by Region, 2025-2035
  • Figure 10: Global Market Value (USD Million) Analysis by Product Type, 2020-2035
  • Figure 11: Global Market Volume (Units) Analysis by Product Type, 2020-2035
  • Figure 12: Global Market Value Share (%) and BPS Analysis by Product Type, 2025-2035
  • Figure 13: Global Market Y-o-Y Growth (%) Projections by Product Type, 2025-2035
  • Figure 14: Global Market Value (USD Million) Analysis by Ingredient Base, 2020-2035
  • Figure 15: Global Market Volume (Units) Analysis by Ingredient Base, 2020-2035
  • Figure 16: Global Market Value Share (%) and BPS Analysis by Ingredient Base, 2025-2035
  • Figure 17: Global Market Y-o-Y Growth (%) Projections by Ingredient Base, 2025-2035
  • Figure 18: Global Market Value (USD Million) Analysis by Packaging Size, 2020-2035
  • Figure 19: Global Market Volume (Units) Analysis by Packaging Size, 2020-2035
  • Figure 20: Global Market Value Share (%) and BPS Analysis by Packaging Size, 2025-2035
  • Figure 21: Global Market Y-o-Y Growth (%) Projections by Packaging Size, 2025-2035
  • Figure 22: Global Market Value (USD Million) Analysis by Distribution Channel, 2020-2035
  • Figure 23: Global Market Volume (Units) Analysis by Distribution Channel, 2020-2035
  • Figure 24: Global Market Value Share (%) and BPS Analysis by Distribution Channel, 2025-2035
  • Figure 25: Global Market Y-o-Y Growth (%) Projections by Distribution Channel, 2025-2035
  • Figure 26: Global Market Attractiveness by Product Type, 2025-2035
  • Figure 27: Global Market Attractiveness by Ingredient Base, 2025-2035
  • Figure 28: Global Market Attractiveness by Packaging Size, 2025-2035
  • Figure 29: Global Market Attractiveness by Distribution Channel, 2025-2035
  • Figure 30: Global Market Attractiveness by Region, 2025-2035
  • Figure 31: South Asia & Pacific Market Value (USD Million) by Product Type, 2025-2035
  • Figure 32: South Asia & Pacific Market Value (USD Million) by Ingredient Base, 2025-2035
  • Figure 33: South Asia & Pacific Market Value (USD Million) by Packaging Size, 2025-2035
  • Figure 34: South Asia & Pacific Market Value (USD Million) by Distribution Channel, 2025-2035
  • Figure 35: South Asia & Pacific Market Value (USD Million) by Country, 2025-2035
  • Figure 36: South Asia & Pacific Market Value (USD Million) Analysis by Country, 2020-2035
  • Figure 37: South Asia & Pacific Market Volume (Units) Analysis by Country, 2020-2035
  • Figure 38: South Asia & Pacific Market Value Share (%) and BPS Analysis by Country, 2025-2035
  • Figure 39: South Asia & Pacific Market Y-o-Y Growth (%) Projections by Country, 2025-2035
  • Figure 40: South Asia & Pacific Market Value (USD Million) Analysis by Product Type, 2020-2035
  • Figure 41: South Asia & Pacific Market Volume (Units) Analysis by Product Type, 2020-2035
  • Figure 42: South Asia & Pacific Market Value Share (%) and BPS Analysis by Product Type, 2025-2035
  • Figure 43: South Asia & Pacific Market Y-o-Y Growth (%) Projections by Product Type, 2025-2035
  • Figure 44: South Asia & Pacific Market Value (USD Million) Analysis by Ingredient Base, 2020-2035
  • Figure 45: South Asia & Pacific Market Volume (Units) Analysis by Ingredient Base, 2020-2035
  • Figure 46: South Asia & Pacific Market Value Share (%) and BPS Analysis by Ingredient Base, 2025-2035
  • Figure 47: South Asia & Pacific Market Y-o-Y Growth (%) Projections by Ingredient Base, 2025-2035
  • Figure 48: South Asia & Pacific Market Value (USD Million) Analysis by Packaging Size, 2020-2035
  • Figure 49: South Asia & Pacific Market Volume (Units) Analysis by Packaging Size, 2020-2035
  • Figure 50: South Asia & Pacific Market Value Share (%) and BPS Analysis by Packaging Size, 2025-2035
  • Figure 51: South Asia & Pacific Market Y-o-Y Growth (%) Projections by Packaging Size, 2025-2035
  • Figure 52: South Asia & Pacific Market Value (USD Million) Analysis by Distribution Channel, 2020-2035
  • Figure 53: South Asia & Pacific Market Volume (Units) Analysis by Distribution Channel, 2020-2035
  • Figure 54: South Asia & Pacific Market Value Share (%) and BPS Analysis by Distribution Channel, 2025-2035
  • Figure 55: South Asia & Pacific Market Y-o-Y Growth (%) Projections by Distribution Channel, 2025-2035
  • Figure 56: South Asia & Pacific Market Attractiveness by Product Type, 2025-2035
  • Figure 57: South Asia & Pacific Market Attractiveness by Ingredient Base, 2025-2035
  • Figure 58: South Asia & Pacific Market Attractiveness by Packaging Size, 2025-2035
  • Figure 59: South Asia & Pacific Market Attractiveness by Distribution Channel, 2025-2035
  • Figure 60: South Asia & Pacific Market Attractiveness by Country, 2025-2035
  • Figure 61: North America Market Value (USD Million) by Product Type, 2025-2035
  • Figure 62: North America Market Value (USD Million) by Ingredient Base, 2025-2035
  • Figure 63: North America Market Value (USD Million) by Packaging Size, 2025-2035
  • Figure 64: North America Market Value (USD Million) by Distribution Channel, 2025-2035
  • Figure 65: North America Market Value (USD Million) by Country, 2025-2035
  • Figure 66: North America Market Value (USD Million) Analysis by Country, 2020-2035
  • Figure 67: North America Market Volume (Units) Analysis by Country, 2020-2035
  • Figure 68: North America Market Value Share (%) and BPS Analysis by Country, 2025-2035
  • Figure 69: North America Market Y-o-Y Growth (%) Projections by Country, 2025-2035
  • Figure 70: North America Market Value (USD Million) Analysis by Product Type, 2020-2035
  • Figure 71: North America Market Volume (Units) Analysis by Product Type, 2020-2035
  • Figure 72: North America Market Value Share (%) and BPS Analysis by Product Type, 2025-2035
  • Figure 73: North America Market Y-o-Y Growth (%) Projections by Product Type, 2025-2035
  • Figure 74: North America Market Value (USD Million) Analysis by Ingredient Base, 2020-2035
  • Figure 75: North America Market Volume (Units) Analysis by Ingredient Base, 2020-2035
  • Figure 76: North America Market Value Share (%) and BPS Analysis by Ingredient Base, 2025-2035
  • Figure 77: North America Market Y-o-Y Growth (%) Projections by Ingredient Base, 2025-2035
  • Figure 78: North America Market Value (USD Million) Analysis by Packaging Size, 2020-2035
  • Figure 79: North America Market Volume (Units) Analysis by Packaging Size, 2020-2035
  • Figure 80: North America Market Value Share (%) and BPS Analysis by Packaging Size, 2025-2035
  • Figure 81: North America Market Y-o-Y Growth (%) Projections by Packaging Size, 2025-2035
  • Figure 82: North America Market Value (USD Million) Analysis by Distribution Channel, 2020-2035
  • Figure 83: North America Market Volume (Units) Analysis by Distribution Channel, 2020-2035
  • Figure 84: North America Market Value Share (%) and BPS Analysis by Distribution Channel, 2025-2035
  • Figure 85: North America Market Y-o-Y Growth (%) Projections by Distribution Channel, 2025-2035
  • Figure 86: North America Market Attractiveness by Product Type, 2025-2035
  • Figure 87: North America Market Attractiveness by Ingredient Base, 2025-2035
  • Figure 88: North America Market Attractiveness by Packaging Size, 2025-2035
  • Figure 89: North America Market Attractiveness by Distribution Channel, 2025-2035
  • Figure 90: North America Market Attractiveness by Country, 2025-2035
  • Figure 91: Latin America Market Value (USD Million) by Product Type, 2025-2035
  • Figure 92: Latin America Market Value (USD Million) by Ingredient Base, 2025-2035
  • Figure 93: Latin America Market Value (USD Million) by Packaging Size, 2025-2035
  • Figure 94: Latin America Market Value (USD Million) by Distribution Channel, 2025-2035
  • Figure 95: Latin America Market Value (USD Million) by Country, 2025-2035
  • Figure 96: Latin America Market Value (USD Million) Analysis by Country, 2020-2035
  • Figure 97: Latin America Market Volume (Units) Analysis by Country, 2020-2035
  • Figure 98: Latin America Market Value Share (%) and BPS Analysis by Country, 2025-2035
  • Figure 99: Latin America Market Y-o-Y Growth (%) Projections by Country, 2025-2035
  • Figure 100: Latin America Market Value (USD Million) Analysis by Product Type, 2020-2035
  • Figure 101: Latin America Market Volume (Units) Analysis by Product Type, 2020-2035
  • Figure 102: Latin America Market Value Share (%) and BPS Analysis by Product Type, 2025-2035
  • Figure 103: Latin America Market Y-o-Y Growth (%) Projections by Product Type, 2025-2035
  • Figure 104: Latin America Market Value (USD Million) Analysis by Ingredient Base, 2020-2035
  • Figure 105: Latin America Market Volume (Units) Analysis by Ingredient Base, 2020-2035
  • Figure 106: Latin America Market Value Share (%) and BPS Analysis by Ingredient Base, 2025-2035
  • Figure 107: Latin America Market Y-o-Y Growth (%) Projections by Ingredient Base, 2025-2035
  • Figure 108: Latin America Market Value (USD Million) Analysis by Packaging Size, 2020-2035
  • Figure 109: Latin America Market Volume (Units) Analysis by Packaging Size, 2020-2035
  • Figure 110: Latin America Market Value Share (%) and BPS Analysis by Packaging Size, 2025-2035
  • Figure 111: Latin America Market Y-o-Y Growth (%) Projections by Packaging Size, 2025-2035
  • Figure 112: Latin America Market Value (USD Million) Analysis by Distribution Channel, 2020-2035
  • Figure 113: Latin America Market Volume (Units) Analysis by Distribution Channel, 2020-2035
  • Figure 114: Latin America Market Value Share (%) and BPS Analysis by Distribution Channel, 2025-2035
  • Figure 115: Latin America Market Y-o-Y Growth (%) Projections by Distribution Channel, 2025-2035
  • Figure 116: Latin America Market Attractiveness by Product Type, 2025-2035
  • Figure 117: Latin America Market Attractiveness by Ingredient Base, 2025-2035
  • Figure 118: Latin America Market Attractiveness by Packaging Size, 2025-2035
  • Figure 119: Latin America Market Attractiveness by Distribution Channel, 2025-2035
  • Figure 120: Latin America Market Attractiveness by Country, 2025-2035
  • Figure 121: Europe Market Value (USD Million) by Product Type, 2025-2035
  • Figure 122: Europe Market Value (USD Million) by Ingredient Base, 2025-2035
  • Figure 123: Europe Market Value (USD Million) by Packaging Size, 2025-2035
  • Figure 124: Europe Market Value (USD Million) by Distribution Channel, 2025-2035
  • Figure 125: Europe Market Value (USD Million) by Country, 2025-2035
  • Figure 126: Europe Market Value (USD Million) Analysis by Country, 2020-2035
  • Figure 127: Europe Market Volume (Units) Analysis by Country, 2020-2035
  • Figure 128: Europe Market Value Share (%) and BPS Analysis by Country, 2025-2035
  • Figure 129: Europe Market Y-o-Y Growth (%) Projections by Country, 2025-2035
  • Figure 130: Europe Market Value (USD Million) Analysis by Product Type, 2020-2035
  • Figure 131: Europe Market Volume (Units) Analysis by Product Type, 2020-2035
  • Figure 132: Europe Market Value Share (%) and BPS Analysis by Product Type, 2025-2035
  • Figure 133: Europe Market Y-o-Y Growth (%) Projections by Product Type, 2025-2035
  • Figure 134: Europe Market Value (USD Million) Analysis by Ingredient Base, 2020-2035
  • Figure 135: Europe Market Volume (Units) Analysis by Ingredient Base, 2020-2035
  • Figure 136: Europe Market Value Share (%) and BPS Analysis by Ingredient Base, 2025-2035
  • Figure 137: Europe Market Y-o-Y Growth (%) Projections by Ingredient Base, 2025-2035
  • Figure 138: Europe Market Value (USD Million) Analysis by Packaging Size, 2020-2035
  • Figure 139: Europe Market Volume (Units) Analysis by Packaging Size, 2020-2035
  • Figure 140: Europe Market Value Share (%) and BPS Analysis by Packaging Size, 2025-2035
  • Figure 141: Europe Market Y-o-Y Growth (%) Projections by Packaging Size, 2025-2035
  • Figure 142: Europe Market Value (USD Million) Analysis by Distribution Channel, 2020-2035
  • Figure 143: Europe Market Volume (Units) Analysis by Distribution Channel, 2020-2035
  • Figure 144: Europe Market Value Share (%) and BPS Analysis by Distribution Channel, 2025-2035
  • Figure 145: Europe Market Y-o-Y Growth (%) Projections by Distribution Channel, 2025-2035
  • Figure 146: Europe Market Attractiveness by Product Type, 2025-2035
  • Figure 147: Europe Market Attractiveness by Ingredient Base, 2025-2035
  • Figure 148: Europe Market Attractiveness by Packaging Size, 2025-2035
  • Figure 149: Europe Market Attractiveness by Distribution Channel, 2025-2035
  • Figure 150: Europe Market Attractiveness by Country, 2025-2035
  • Figure 151: East Asia Market Value (USD Million) by Product Type, 2025-2035
  • Figure 152: East Asia Market Value (USD Million) by Ingredient Base, 2025-2035
  • Figure 153: East Asia Market Value (USD Million) by Packaging Size, 2025-2035
  • Figure 154: East Asia Market Value (USD Million) by Distribution Channel, 2025-2035
  • Figure 155: East Asia Market Value (USD Million) by Country, 2025-2035
  • Figure 156: East Asia Market Value (USD Million) Analysis by Country, 2020-2035
  • Figure 157: East Asia Market Volume (Units) Analysis by Country, 2020-2035
  • Figure 158: East Asia Market Value Share (%) and BPS Analysis by Country, 2025-2035
  • Figure 159: East Asia Market Y-o-Y Growth (%) Projections by Country, 2025-2035
  • Figure 160: East Asia Market Value (USD Million) Analysis by Product Type, 2020-2035
  • Figure 161: East Asia Market Volume (Units) Analysis by Product Type, 2020-2035
  • Figure 162: East Asia Market Value Share (%) and BPS Analysis by Product Type, 2025-2035
  • Figure 163: East Asia Market Y-o-Y Growth (%) Projections by Product Type, 2025-2035
  • Figure 164: East Asia Market Value (USD Million) Analysis by Ingredient Base, 2020-2035
  • Figure 165: East Asia Market Volume (Units) Analysis by Ingredient Base, 2020-2035
  • Figure 166: East Asia Market Value Share (%) and BPS Analysis by Ingredient Base, 2025-2035
  • Figure 167: East Asia Market Y-o-Y Growth (%) Projections by Ingredient Base, 2025-2035
  • Figure 168: East Asia Market Value (USD Million) Analysis by Packaging Size, 2020-2035
  • Figure 169: East Asia Market Volume (Units) Analysis by Packaging Size, 2020-2035
  • Figure 170: East Asia Market Value Share (%) and BPS Analysis by Packaging Size, 2025-2035
  • Figure 171: East Asia Market Y-o-Y Growth (%) Projections by Packaging Size, 2025-2035
  • Figure 172: East Asia Market Value (USD Million) Analysis by Distribution Channel, 2020-2035
  • Figure 173: East Asia Market Volume (Units) Analysis by Distribution Channel, 2020-2035
  • Figure 174: East Asia Market Value Share (%) and BPS Analysis by Distribution Channel, 2025-2035
  • Figure 175: East Asia Market Y-o-Y Growth (%) Projections by Distribution Channel, 2025-2035
  • Figure 176: East Asia Market Attractiveness by Product Type, 2025-2035
  • Figure 177: East Asia Market Attractiveness by Ingredient Base, 2025-2035
  • Figure 178: East Asia Market Attractiveness by Packaging Size, 2025-2035
  • Figure 179: East Asia Market Attractiveness by Distribution Channel, 2025-2035
  • Figure 180: East Asia Market Attractiveness by Country, 2025-2035
  • Figure 181: Middle East and Africa Market Value (USD Million) by Product Type, 2025-2035
  • Figure 182: Middle East and Africa Market Value (USD Million) by Ingredient Base, 2025-2035
  • Figure 183: Middle East and Africa Market Value (USD Million) by Packaging Size, 2025-2035
  • Figure 184: Middle East and Africa Market Value (USD Million) by Distribution Channel, 2025-2035
  • Figure 185: Middle East and Africa Market Value (USD Million) by Country, 2025-2035
  • Figure 186: Middle East and Africa Market Value (USD Million) Analysis by Country, 2020-2035
  • Figure 187: Middle East and Africa Market Volume (Units) Analysis by Country, 2020-2035
  • Figure 188: Middle East and Africa Market Value Share (%) and BPS Analysis by Country, 2025-2035
  • Figure 189: Middle East and Africa Market Y-o-Y Growth (%) Projections by Country, 2025-2035
  • Figure 190: Middle East and Africa Market Value (USD Million) Analysis by Product Type, 2020-2035
  • Figure 191: Middle East and Africa Market Volume (Units) Analysis by Product Type, 2020-2035
  • Figure 192: Middle East and Africa Market Value Share (%) and BPS Analysis by Product Type, 2025-2035
  • Figure 193: Middle East and Africa Market Y-o-Y Growth (%) Projections by Product Type, 2025-2035
  • Figure 194: Middle East and Africa Market Value (USD Million) Analysis by Ingredient Base, 2020-2035
  • Figure 195: Middle East and Africa Market Volume (Units) Analysis by Ingredient Base, 2020-2035
  • Figure 196: Middle East and Africa Market Value Share (%) and BPS Analysis by Ingredient Base, 2025-2035
  • Figure 197: Middle East and Africa Market Y-o-Y Growth (%) Projections by Ingredient Base, 2025-2035
  • Figure 198: Middle East and Africa Market Value (USD Million) Analysis by Packaging Size, 2020-2035
  • Figure 199: Middle East and Africa Market Volume (Units) Analysis by Packaging Size, 2020-2035
  • Figure 200: Middle East and Africa Market Value Share (%) and BPS Analysis by Packaging Size, 2025-2035
  • Figure 201: Middle East and Africa Market Y-o-Y Growth (%) Projections by Packaging Size, 2025-2035
  • Figure 202: Middle East and Africa Market Value (USD Million) Analysis by Distribution Channel, 2020-2035
  • Figure 203: Middle East and Africa Market Volume (Units) Analysis by Distribution Channel, 2020-2035
  • Figure 204: Middle East and Africa Market Value Share (%) and BPS Analysis by Distribution Channel, 2025-2035
  • Figure 205: Middle East and Africa Market Y-o-Y Growth (%) Projections by Distribution Channel, 2025-2035
  • Figure 206: Middle East and Africa Market Attractiveness by Product Type, 2025-2035
  • Figure 207: Middle East and Africa Market Attractiveness by Ingredient Base, 2025-2035
  • Figure 208: Middle East and Africa Market Attractiveness by Packaging Size, 2025-2035
  • Figure 209: Middle East and Africa Market Attractiveness by Distribution Channel, 2025-2035
  • Figure 210: Middle East and Africa Market Attractiveness by Country, 2025-2035

Frequently Asked Questions

How big is the Global Snail Mucin Market in 2025?

The Global Snail Mucin Market is estimated to be valued at USD 989.4 million in 2025.

What will be the size of the Global Snail Mucin Market in 2035?

The market size for the Global Snail Mucin Market is projected to reach USD 1,873.9 million by 2035.

How much will the Global Snail Mucin Market grow between 2025 and 2035?

The Global Snail Mucin Market is expected to grow at a 6.6% CAGR between 2025 and 2035.

What are the key product types in the Global Snail Mucin Market?

The key product types include Facial Skincare, Body Care, Hair Care, Eye Care, Lip Care, and Others.

Which skin/hair concern segment is expected to contribute a significant share in the Global Snail Mucin Market in 2025?

In China, Anti-aging & Fine Lines is projected to command a 39.2% share in 2025.

Explore Similar Insights

Future Market Insights

Snail Mucin Market