SocialFi NFTs Market Forecast and Outlook 2025 to 2035

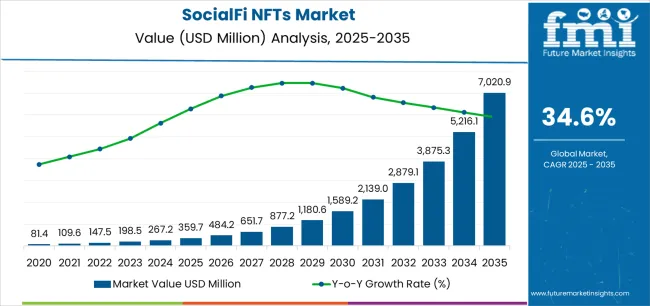
The SocialFi NFTs market is poised for exceptional growth, expected to increase from USD 359.7 million in 2025 to USD 7,021.4 million by 2035, reflecting a CAGR of 34.6%. This rapid expansion is driven by the convergence of social finance (SocialFi) and NFTs, which offer users the opportunity to monetize their online presence, content, and social interactions in decentralized environments. As more platforms integrate NFT-based social features and allow users to create, trade, and leverage their digital assets, SocialFi NFTs will gain traction among both creators and users in digital spaces.

The growing interest in Web3 technologies, decentralized finance (DeFi), and blockchain-based social media platforms will be key drivers of market growth. By enabling users to retain ownership and control over their digital identity and assets, SocialFi NFTs provide a new way to engage with social media, reward creators, and facilitate peer-to-peer transactions. As social networks evolve into decentralized communities and virtual spaces, the demand for NFTs tied to social experiences, content sharing, and digital communities will continue to increase, securing a dominant position for SocialFi NFTs in the broader digital economy.
Quick Stats of the SocialFi NFTs Market

  • SocialFi NFTs Market Value (2025): USD 359.7 million
  • SocialFi NFTs Market Forecast Value (2035): USD 7,021.4 million
  • SocialFi NFTs Market Forecast CAGR (2025-2035): 34.6%
  • SocialFi NFTs Market Leading Segment: Social Content Monetization NFT (30%)
  • SocialFi NFTs Market Key Growth Regions: China, India, Germany, Brazil, USA, UK, Japan
  • SocialFi NFTs Market Top Players: Friend.tech, Galxe, Fren Pet, Tako Protocol, QuestN, Roll, P00LS, Mirror.xyz, Zora, StepN, Genopets, Lens Protocol, Farcaster, POAP, Memeland

Socialfi Nfts Market Market Value Analysis

SocialFi NFTs Market Year-over-Year Forecast 2025 to 2035

From 2025 to 2030, the market is projected to grow from USD 359.7 million to USD 1,589.3 million, a rise of USD 1,229.6 million. This growth will be driven by the increasing integration of NFTs in social media platforms and the expanding creator economy. As decentralized social finance platforms gain popularity, users will increasingly seek ways to monetize their content and digital identities through NFTs, which will further accelerate market growth during this period.

Between 2030 and 2035, the market is forecast to expand from USD 1,589.3 million to USD 7,021.4 million, adding USD 5,432.1 million. This rapid surge will be fueled by the mainstream adoption of NFTs in social networks, gaming, and virtual worlds, where social interactions and content creation are increasingly tied to digital ownership. As Web3 technologies continue to transform how people interact online, SocialFi NFTs will play a central role in reshaping digital economies and fostering new monetization opportunities for creators and communities, driving strong growth throughout the decade.

SocialFi NFTs Market Key Takeaways

Metric Value
Market Value (2025) USD 359.7 million
Market Forecast Value (2035) USD 7,021.4 million
Forecast CAGR (2025-2035) 34.6%

What is driving the growth of the SocialFi NFTs market?

The SocialFi NFTs market is experiencing rapid growth due to the increasing integration of NFTs in social media platforms, content monetization, and digital identities. As the demand for decentralized finance (DeFi) continues to rise, social platforms are increasingly adopting NFTs as a means to reward content creators and foster community engagement. Social content monetization NFTs are becoming a key driver of this growth, allowing creators to tokenize their content and receive compensation directly from their audiences. The rise of web3 technologies and the growing interest in decentralized social platforms are providing new avenues for NFT applications in areas like reputation management, social gamification, and digital identities. Additionally, the increasing popularity of social tokens and the ability to monetize social media activities are further contributing to the market's expansion. With platforms like Friend.tech, Galxe, and StepN leading the charge, the SocialFi NFTs market is expected to grow rapidly, providing new ways for users and creators to interact, earn, and own digital assets in decentralized environments.

What are the key segments of the SocialFi NFTs market?

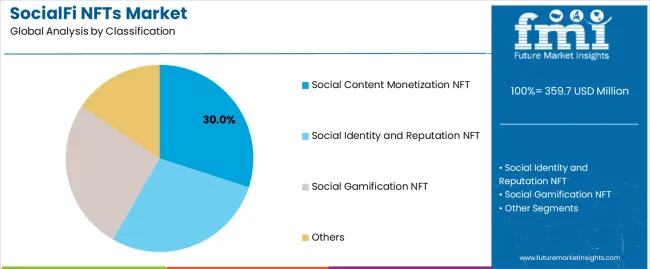
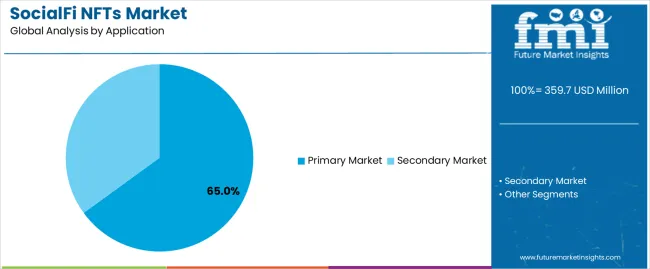
The SocialFi NFTs market is segmented by classification and application. By classification, the market covers social content monetization NFTs, social identity and reputation NFTs, social gamification NFTs, and others. Among these, social content monetization NFTs hold the leading share at 30%, driven by creator-led earning models across web3 social platforms. By application, the market is divided into the primary market and secondary market, with the primary market holding a dominant 65% share. Regions such as China, India, and Germany exhibit the strongest adoption due to rapid blockchain expansion and creator economy growth.
Why is the social content monetization NFT segment leading the SocialFi NFTs market?

Socialfi Nfts Market Analysis By Classification

The social content monetization NFT segment leads the SocialFi NFTs market with a 30% share because it directly addresses the evolving creator economy, where individuals seek autonomy and direct revenue channels without relying on centralized platforms. This segment allows creators to tokenize posts, artwork, experiences, or exclusive community access as NFTs, enabling supporters and followers to own moments and interactions rather than simply consuming them. Platforms such as Friend.tech, Mirror.xyz, and Roll are driving adoption by offering infrastructure for decentralized monetization, shifting control from traditional social platforms to individual creators.

The ability to transform engagement into ownership is a key growth catalyst. Users purchasing these NFTs not only support creators but also gain assets that can appreciate with the creator’s brand growth, introducing value exchange into social interactions. Additionally, micro-transaction models and fan-token ecosystems elevate ongoing engagement, making creator-fan relationships deeper and financially meaningful. As web3 social platforms expand and creator monetization norms evolve, this segment’s leading position is expected to strengthen, particularly in markets like China, India, and Brazil, where digital creator entrepreneurship is expanding rapidly.
Why is the primary market dominating the SocialFi NFTs market?

Socialfi Nfts Market Analysis By Application

The primary market dominates the SocialFi NFTs market with a 65% share because it represents the point of first issuance, where creators and platforms establish direct value capture from NFT sales. This eliminates intermediary control and reduces revenue leakage, allowing creators to earn more, while giving early adopters access to NFTs at original issue prices. The primary market is especially active on SocialFi platforms like Friend.tech, Galxe, and Lens Protocol, where NFTs are launched as membership badges, access tokens, creator passes, or identity-linked collectibles.

The appeal of exclusivity, first-access rights, and early-value acquisition drives strong user participation in the primary market. These NFTs often grant privileges such as gated chat access, tiered memberships, or early participation in tokenized events, making them valuable beyond speculative resale. The rise of decentralized fan economies and token-driven communities has strengthened the primary issuance model further. Moreover, the availability of easy-to-use minting and identity linking tools has lowered the barrier of entry for new creators worldwide. As more social platforms transition to decentralized engagement models, the dominance of the primary market will continue, supported by rapid adoption in regions like China, India, and Germany, where social tokenization is scaling fastest.

What are the drivers, restraints, and key trends of the SocialFi NFTs market?

The SocialFi NFTs market is expanding rapidly due to the increasing demand for decentralized social platforms, which offer creators the opportunity to monetize their content directly via NFTs. The shift from centralized social media models to web3-based platforms is reshaping the way digital content is valued. Platforms like Friend.tech and StepN are leading the charge, allowing users to tokenize and trade social interactions. The creator economy, the rise of digital identity management, and social gamification are also driving market growth as platforms continue to evolve.

What are the key drivers of the SocialFi NFTs market?

The key drivers of the SocialFi NFTs market include the growing adoption of web3 technologies and NFTs within social media platforms. The ability for content creators to monetize their work directly through NFTs is attracting significant interest from influencers, artists, and creators across digital spaces. Additionally, the increasing demand for decentralized and transparent platforms where digital identity and reputation can be securely managed is another important factor. Platforms like Galxe and Mirror.xyz enable users to engage in social gamification and reputation building, leading to stronger consumer participation in the SocialFi ecosystem.

What are the key restraints in the SocialFi NFTs market?

Despite strong growth, the SocialFi NFTs market faces several challenges. Market volatility is one of the main concerns, as NFT prices can fluctuate widely, creating uncertainty for investors and content creators. Furthermore, regulatory uncertainty regarding the use of NFTs and cryptocurrency in decentralized applications can deter potential users from engaging in the market. Additionally, the environmental impact of blockchain transactions, especially those using proof-of-work systems, is raising concerns about the sustainability of SocialFi NFTs. These challenges may hinder wider adoption in certain regions.

What are the key trends in the SocialFi NFTs market?

Several key trends are shaping the SocialFi NFTs market. Social tokens and NFT-based digital assets are gaining popularity as platforms move toward decentralization. The rise of social gamification is encouraging deeper user engagement, where NFTs are used as rewards in community-driven activities. Another key trend is the increasing focus on digital identity management, where reputation NFTs are allowing users to build and maintain their online identity securely on blockchain platforms. Additionally, the growing integration of NFTs in decentralized social media platforms will continue to drive the market as new players enter the Web3 space.
What is the country-wise analysis of the SocialFi NFTs market?

Socialfi Nfts Market Cagr Analysis By Country

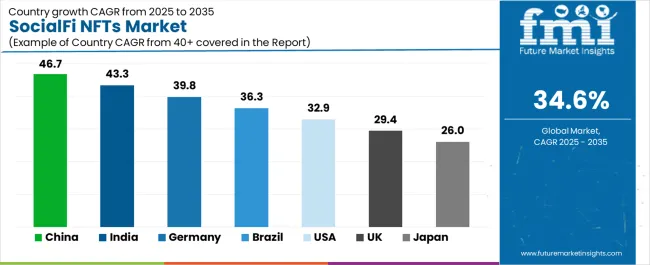
The SocialFi NFTs market is growing rapidly across the globe, with significant contributions from regions such as China, India, and Germany. These countries are leading the charge due to their large and tech-savvy populations and the increasing demand for web3 technologies and NFT platforms. The rise of decentralized social networks and social content monetization platforms is fueling the demand for NFTs in digital identity management, social gamification, and reputation building. Meanwhile, markets like the USA and UK are contributing to the growth, driven by institutional investment and early adoption of NFT-based solutions in social media and digital asset ecosystems. As these regions continue to embrace blockchain-based innovations, the SocialFi NFTs market is set to experience sustained growth.

Country CAGR (%)
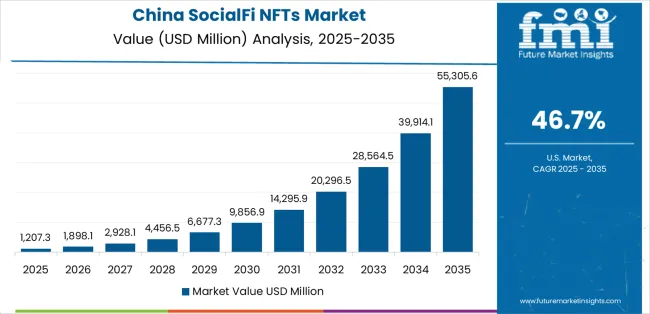
China 46.7
India 43.3
Germany 39.8
Brazil 36.3
USA 32.9
UK 29.4
Japan 26

How is China contributing to the growth of the SocialFi NFTs market?

Socialfi Nfts Market Country Value Analysis

China is the leader in the SocialFi NFTs market, with an impressive CAGR of 46.7%. The rapid adoption of blockchain technology and the country’s tech-forward consumer base are key drivers of this growth. China’s interest in decentralized platforms and NFT-based social content monetization has opened new opportunities for digital identity management and social gamification. Platforms like Friend.tech and Galxe are becoming increasingly popular in China, where users can tokenize their social presence and participate in the growing Web3 ecosystem. The Chinese government’s support for blockchain innovation and NFTs, alongside its fast-growing gaming sector, is enabling an environment that is conducive to the rise of socialFi applications. As Chinese platforms expand, offering opportunities to engage and monetize social media activities, China is poised to remain the top player in the SocialFi NFTs market.

What factors are driving India’s growth in the SocialFi NFTs market?

India is projected to grow at a CAGR of 43.3% in the SocialFi NFTs market, fueled by its large, tech-savvy population and rapid adoption of blockchain-based platforms. India’s growing digital economy, combined with a significant rise in content creators and NFT adoption, has led to increased demand for social content monetization NFTs. Platforms like Lens Protocol and Tako Protocol are gaining traction in India, providing creators the tools to tokenize their content and engage with audiences in decentralized ways. Additionally, the gaming industry’s rise and increasing interest in NFT-based virtual goods are boosting demand for digital assets in the country. India’s growing presence in crypto adoption and the decentralized finance space further contribute to the expansion of SocialFi NFTs, positioning the country as a major player in the global market.
How is Germany influencing the SocialFi NFTs market?

Socialfi Nfts Market Europe Country Market Share Analysis, 2025 & 2035

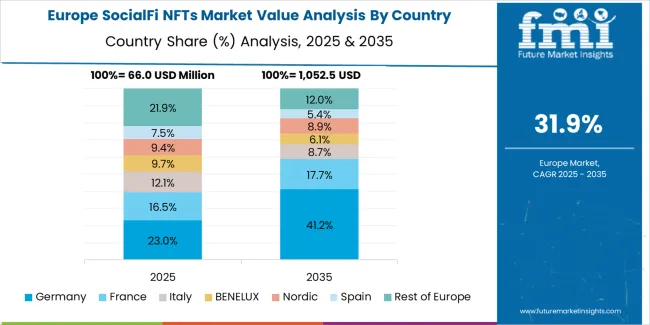
Germany is projected to grow at a CAGR of 39.8% in the SocialFi NFTs market, driven by its strong blockchain infrastructure and commitment to digital innovation. As one of Europe’s leading hubs for technology, Germany has embraced the rise of decentralized applications (dApps) and NFT platforms, particularly those focusing on social content monetization and digital identity management. The growth of social gamification and NFT-based platforms in Germany, such as Mirror.xyz and Zora, is fostering the widespread adoption of NFTs. Additionally, the German gaming market is booming, with NFT-based assets and virtual goods becoming an integral part of the gaming economy. As blockchain technology continues to be adopted across industries, Germany is expected to remain a major player in the SocialFi NFTs market, with further adoption driven by its growing crypto-friendly environment.

What is contributing to Brazil’s growth in the SocialFi NFTs market?

Brazil is projected to grow at a CAGR of 36.3% in the SocialFi NFTs market, fueled by its expanding digital economy and increasing adoption of blockchain technologies. As content creators and digital artists in Brazil look for new ways to monetize their work, the demand for social content monetization NFTs is growing rapidly. Platforms such as StepN and Fren Pet are seeing increasing usage in Brazil, where NFTs are being used to tokenize social interactions and fan experiences. The rising popularity of gaming and virtual assets is also contributing to the growth of the SocialFi NFTs market in Brazil. Moreover, the country’s strong social media presence, combined with the increasing adoption of cryptocurrencies, is creating a vibrant ecosystem for decentralized social platforms. As blockchain solutions gain traction in Brazil, the SocialFi NFTs market is expected to continue expanding, making Brazil one of the most promising markets for NFT adoption in Latin America.

What factors are driving the USA growth in the SocialFi NFTs market?

The USA is projected to grow at a CAGR of 32.9% in the SocialFi NFTs market, supported by its established tech infrastructure and institutional investment in blockchain technology. The USA is home to some of the world’s largest NFT platforms, including Friend.tech and Galxe, which have spurred NFT adoption for social content monetization and digital identity management. The rise of social gamification and decentralized social networks is driving engagement and NFT participation among USA-based users. Additionally, the USA has a thriving creator economy, where influencers, artists, and brands are embracing NFTs as a new way to engage with audiences and monetize content. As crypto adoption increases and the metaverse continues to expand, the SocialFi NFTs market in the USA is expected to see sustained growth, solidifying the country’s position as a global leader in NFT adoption.

What is shaping the UK’s growth in the SocialFi NFTs market?

The UK is expected to grow at a CAGR of 29.4% in the SocialFi NFTs market, driven by the country’s strong digital ecosystem and blockchain adoption. The rise of decentralized social platforms that allow creators to tokenize content has gained significant momentum in the UK, with platforms like Farcaster and Zora gaining traction. The UK is a hub for digital creators, and the growing interest in NFT-based social identity management is contributing to the expansion of the SocialFi NFTs market. The increasing demand for NFT-based content monetization and social gamification is also shaping the UK market, particularly among younger consumers and digital entrepreneurs. As the UK continues to innovate in the Web3 space, it is expected to maintain its position as a strong player in the SocialFi NFTs market in Europe.
How is Japan contributing to the growth of the SocialFi NFTs market?

Socialfi Nfts Market Japan Market Share Analysis By Classification

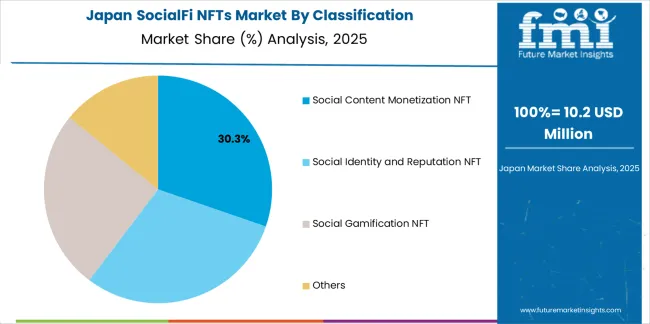
Japan is projected to grow at a CAGR of 26% in the SocialFi NFTs market, driven by its strong gaming culture and increasing interest in NFT-based assets. Japan has a large gaming community, which is one of the main drivers of NFT adoption in the country, particularly for social gamification and digital collectibles. The rise of blockchain-based solutions for digital content monetization is fostering the growth of NFT platforms in Japan, with social content NFTs being increasingly integrated into virtual worlds and gaming platforms. Japan’s high-tech infrastructure and openness to decentralized finance (DeFi) further support the rapid expansion of the SocialFi NFTs market. As NFT adoption continues to rise in Japan, the country is expected to remain a key player in the global SocialFi NFTs market, particularly in the gaming and digital art sectors.
What is the competitive landscape of the SocialFi NFTs market?

Socialfi Nfts Market Analysis By Company

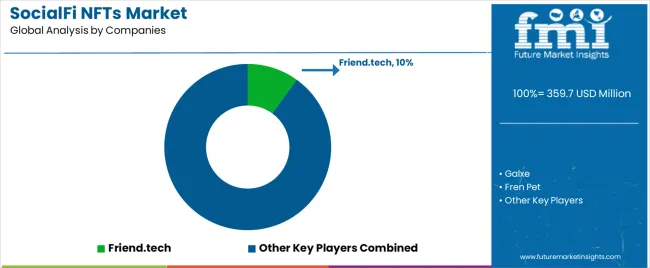
The SocialFi NFTs market is highly competitive, with platforms such as Friend.tech, Galxe, and Fren Pet taking leading positions. These companies are pioneering in the social content monetization and digital identity management space, offering solutions for creators to tokenize and sell their content as NFTs. Friend.tech, with its significant market share, has emerged as a prominent player, enabling social interactions and engagements to be tokenized. Other key players like Tako Protocol, StepN, and Lens Protocol are carving out niches in social gamification and NFT-based identity management. These platforms are establishing communities where users can earn rewards, trade digital assets, and engage in decentralized social environments.

Regional and niche players are also making an impact by targeting specific audiences or providing unique features. Zora and Mirror.xyz focus on enabling creators to monetize through NFTs, while POAP and Memeland are integrating social experiences and NFT badges into their platforms, enhancing user engagement. As the market grows, competition will intensify, with new entrants bringing innovative solutions for digital asset monetization. Platforms that offer seamless user experience, high community engagement, and strong security features will remain dominant as the SocialFi NFTs market continues to expand globally.

Key Players of the SocialFi NFTs Market

  • Friend.tech
  • Galxe
  • Fren Pet
  • Tako Protocol
  • QuestN
  • Roll
  • P00LS
  • Mirror.xyz
  • Zora
  • StepN
  • Genopets
  • Lens Protocol
  • Farcaster
  • POAP
  • Memeland

Scope of the report

Items Details
Quantitative Units USD Million
Regions Covered China, India, Germany, Brazil, USA, UK, Japan
Classification Social Content Monetization NFT, Social Identity and Reputation NFT, Social Gamification NFT, Others
Application Primary Market, Secondary Market
Key Companies Profiled Friend.tech, Galxe, Fren Pet, Tako Protocol, QuestN, Roll, P00LS, Mirror.xyz, Zora, StepN, Genopets, Lens Protocol, Farcaster, POAP, Memeland
Additional Attributes The market analysis includes dollar sales by classification and application categories. It also covers regional adoption trends across major markets such as China, India, Germany, and the USA The competitive landscape focuses on leading players in the SocialFi NFTs ecosystem, emphasizing innovations in social content monetization, identity, and gamification. Trends in the integration of NFTs with social platforms, user engagement, and gamified social experiences are explored, along with the primary and secondary market dynamics.

Key Segments of the SocialFi NFTs Market

Classification

  • Social Content Monetization NFT
  • Social Identity and Reputation NFT
  • Social Gamification NFT
  • Others

Application

  • Primary Market
  • Secondary Market

Region

  • Asia Pacific
    • China
    • Japan
    • South Korea
    • India
    • Australia & New Zealand
    • ASEAN
    • Rest of Asia Pacific
  • Europe
    • Germany
    • United Kingdom
    • France
    • Italy
    • Spain
    • Nordic
    • BENELUX
    • Rest of Europe
  • North America
    • United States
    • Canada
    • Mexico
  • Latin America
    • Brazil
    • Chile
    • Rest of Latin America
  • Middle East & Africa
    • Kingdom of Saudi Arabia
    • Other GCC Countries
    • Turkey
    • South Africa
    • Other African Union
    • Rest of Middle East & Africa

Frequently Asked Questions

How big is the socialfi nfts market in 2025?

The global socialfi nfts market is estimated to be valued at USD 359.7 million in 2025.

What will be the size of socialfi nfts market in 2035?

The market size for the socialfi nfts market is projected to reach USD 7,020.9 million by 2035.

How much will be the socialfi nfts market growth between 2025 and 2035?

The socialfi nfts market is expected to grow at a 34.6% CAGR between 2025 and 2035.

What are the key product types in the socialfi nfts market?

The key product types in socialfi nfts market are social content monetization nft, social identity and reputation nft, social gamification NFT and others.

Which application segment to contribute significant share in the socialfi nfts market in 2025?

In terms of application, primary market segment to command 65.0% share in the socialfi nfts market in 2025.

Table of Content

  1. Executive Summary
    • Global Market Outlook
    • Demand to side Trends
    • Supply to side Trends
    • Technology Roadmap Analysis
    • Analysis and Recommendations
  2. Market Overview
    • Market Coverage / Taxonomy
    • Market Definition / Scope / Limitations
  3. Market Background
    • Market Dynamics
      • Drivers
      • Restraints
      • Opportunity
      • Trends
    • Scenario Forecast
      • Demand in Optimistic Scenario
      • Demand in Likely Scenario
      • Demand in Conservative Scenario
    • Opportunity Map Analysis
    • Product Life Cycle Analysis
    • Supply Chain Analysis
    • Investment Feasibility Matrix
    • Value Chain Analysis
    • PESTLE and Porter’s Analysis
    • Regulatory Landscape
    • Regional Parent Market Outlook
    • Production and Consumption Statistics
    • Import and Export Statistics
  4. Global Market Analysis 2020 to 2024 and Forecast, 2025 to 2035
    • Historical Market Size Value (USD Million) Analysis, 2020 to 2024
    • Current and Future Market Size Value (USD Million) Projections, 2025 to 2035
      • Y to o to Y Growth Trend Analysis
      • Absolute $ Opportunity Analysis
  5. Global Market Pricing Analysis 2020 to 2024 and Forecast 2025 to 2035
  6. Global Market Analysis 2020 to 2024 and Forecast 2025 to 2035, By Classification
    • Introduction / Key Findings
    • Historical Market Size Value (USD Million) Analysis By Classification , 2020 to 2024
    • Current and Future Market Size Value (USD Million) Analysis and Forecast By Classification , 2025 to 2035
      • Social Content Monetization NFT
      • Social Identity and Reputation NFT
      • Social Gamification NFT
      • Others
    • Y to o to Y Growth Trend Analysis By Classification , 2020 to 2024
    • Absolute $ Opportunity Analysis By Classification , 2025 to 2035
  7. Global Market Analysis 2020 to 2024 and Forecast 2025 to 2035, By Application
    • Introduction / Key Findings
    • Historical Market Size Value (USD Million) Analysis By Application, 2020 to 2024
    • Current and Future Market Size Value (USD Million) Analysis and Forecast By Application, 2025 to 2035
      • Primary Market
      • Secondary Market
    • Y to o to Y Growth Trend Analysis By Application, 2020 to 2024
    • Absolute $ Opportunity Analysis By Application, 2025 to 2035
  8. Global Market Analysis 2020 to 2024 and Forecast 2025 to 2035, By Region
    • Introduction
    • Historical Market Size Value (USD Million) Analysis By Region, 2020 to 2024
    • Current Market Size Value (USD Million) Analysis and Forecast By Region, 2025 to 2035
      • North America
      • Latin America
      • Western Europe
      • Eastern Europe
      • East Asia
      • South Asia and Pacific
      • Middle East & Africa
    • Market Attractiveness Analysis By Region
  9. North America Market Analysis 2020 to 2024 and Forecast 2025 to 2035, By Country
    • Historical Market Size Value (USD Million) Trend Analysis By Market Taxonomy, 2020 to 2024
    • Market Size Value (USD Million) Forecast By Market Taxonomy, 2025 to 2035
      • By Country
        • USA
        • Canada
        • Mexico
      • By Classification
      • By Application
    • Market Attractiveness Analysis
      • By Country
      • By Classification
      • By Application
    • Key Takeaways
  10. Latin America Market Analysis 2020 to 2024 and Forecast 2025 to 2035, By Country
    • Historical Market Size Value (USD Million) Trend Analysis By Market Taxonomy, 2020 to 2024
    • Market Size Value (USD Million) Forecast By Market Taxonomy, 2025 to 2035
      • By Country
        • Brazil
        • Chile
        • Rest of Latin America
      • By Classification
      • By Application
    • Market Attractiveness Analysis
      • By Country
      • By Classification
      • By Application
    • Key Takeaways
  11. Western Europe Market Analysis 2020 to 2024 and Forecast 2025 to 2035, By Country
    • Historical Market Size Value (USD Million) Trend Analysis By Market Taxonomy, 2020 to 2024
    • Market Size Value (USD Million) Forecast By Market Taxonomy, 2025 to 2035
      • By Country
        • Germany
        • UK
        • Italy
        • Spain
        • France
        • Nordic
        • BENELUX
        • Rest of Western Europe
      • By Classification
      • By Application
    • Market Attractiveness Analysis
      • By Country
      • By Classification
      • By Application
    • Key Takeaways
  12. Eastern Europe Market Analysis 2020 to 2024 and Forecast 2025 to 2035, By Country
    • Historical Market Size Value (USD Million) Trend Analysis By Market Taxonomy, 2020 to 2024
    • Market Size Value (USD Million) Forecast By Market Taxonomy, 2025 to 2035
      • By Country
        • Russia
        • Poland
        • Hungary
        • Balkan & Baltic
        • Rest of Eastern Europe
      • By Classification
      • By Application
    • Market Attractiveness Analysis
      • By Country
      • By Classification
      • By Application
    • Key Takeaways
  13. East Asia Market Analysis 2020 to 2024 and Forecast 2025 to 2035, By Country
    • Historical Market Size Value (USD Million) Trend Analysis By Market Taxonomy, 2020 to 2024
    • Market Size Value (USD Million) Forecast By Market Taxonomy, 2025 to 2035
      • By Country
        • China
        • Japan
        • South Korea
      • By Classification
      • By Application
    • Market Attractiveness Analysis
      • By Country
      • By Classification
      • By Application
    • Key Takeaways
  14. South Asia and Pacific Market Analysis 2020 to 2024 and Forecast 2025 to 2035, By Country
    • Historical Market Size Value (USD Million) Trend Analysis By Market Taxonomy, 2020 to 2024
    • Market Size Value (USD Million) Forecast By Market Taxonomy, 2025 to 2035
      • By Country
        • India
        • ASEAN
        • Australia & New Zealand
        • Rest of South Asia and Pacific
      • By Classification
      • By Application
    • Market Attractiveness Analysis
      • By Country
      • By Classification
      • By Application
    • Key Takeaways
  15. Middle East & Africa Market Analysis 2020 to 2024 and Forecast 2025 to 2035, By Country
    • Historical Market Size Value (USD Million) Trend Analysis By Market Taxonomy, 2020 to 2024
    • Market Size Value (USD Million) Forecast By Market Taxonomy, 2025 to 2035
      • By Country
        • Kingdom of Saudi Arabia
        • Other GCC Countries
        • Turkiye
        • South Africa
        • Other African Union
        • Rest of Middle East & Africa
      • By Classification
      • By Application
    • Market Attractiveness Analysis
      • By Country
      • By Classification
      • By Application
    • Key Takeaways
  16. Key Countries Market Analysis
    • USA
      • Pricing Analysis
      • Market Share Analysis, 2024
        • By Classification
        • By Application
    • Canada
      • Pricing Analysis
      • Market Share Analysis, 2024
        • By Classification
        • By Application
    • Mexico
      • Pricing Analysis
      • Market Share Analysis, 2024
        • By Classification
        • By Application
    • Brazil
      • Pricing Analysis
      • Market Share Analysis, 2024
        • By Classification
        • By Application
    • Chile
      • Pricing Analysis
      • Market Share Analysis, 2024
        • By Classification
        • By Application
    • Germany
      • Pricing Analysis
      • Market Share Analysis, 2024
        • By Classification
        • By Application
    • UK
      • Pricing Analysis
      • Market Share Analysis, 2024
        • By Classification
        • By Application
    • Italy
      • Pricing Analysis
      • Market Share Analysis, 2024
        • By Classification
        • By Application
    • Spain
      • Pricing Analysis
      • Market Share Analysis, 2024
        • By Classification
        • By Application
    • France
      • Pricing Analysis
      • Market Share Analysis, 2024
        • By Classification
        • By Application
    • India
      • Pricing Analysis
      • Market Share Analysis, 2024
        • By Classification
        • By Application
    • ASEAN
      • Pricing Analysis
      • Market Share Analysis, 2024
        • By Classification
        • By Application
    • Australia & New Zealand
      • Pricing Analysis
      • Market Share Analysis, 2024
        • By Classification
        • By Application
    • China
      • Pricing Analysis
      • Market Share Analysis, 2024
        • By Classification
        • By Application
    • Japan
      • Pricing Analysis
      • Market Share Analysis, 2024
        • By Classification
        • By Application
    • South Korea
      • Pricing Analysis
      • Market Share Analysis, 2024
        • By Classification
        • By Application
    • Russia
      • Pricing Analysis
      • Market Share Analysis, 2024
        • By Classification
        • By Application
    • Poland
      • Pricing Analysis
      • Market Share Analysis, 2024
        • By Classification
        • By Application
    • Hungary
      • Pricing Analysis
      • Market Share Analysis, 2024
        • By Classification
        • By Application
    • Kingdom of Saudi Arabia
      • Pricing Analysis
      • Market Share Analysis, 2024
        • By Classification
        • By Application
    • Turkiye
      • Pricing Analysis
      • Market Share Analysis, 2024
        • By Classification
        • By Application
    • South Africa
      • Pricing Analysis
      • Market Share Analysis, 2024
        • By Classification
        • By Application
  17. Market Structure Analysis
    • Competition Dashboard
    • Competition Benchmarking
    • Market Share Analysis of Top Players
      • By Regional
      • By Classification
      • By Application
  18. Competition Analysis
    • Competition Deep Dive
      • Friend.tech
        • Overview
        • Product Portfolio
        • Profitability by Market Segments (Product/Age /Sales Channel/Region)
        • Sales Footprint
        • Strategy Overview
          • Marketing Strategy
          • Product Strategy
          • Channel Strategy
      • Galxe
      • Fren Pet
      • Tako Protocol
      • QuestN
      • Roll
      • P00LS
      • Mirror.xyz
      • Zora
      • StepN
      • Genopets
      • Lens Protocol
      • Farcaster
      • POAP
      • Memeland
  19. Assumptions & Acronyms Used
  20. Research Methodology

List of Tables

  • Table 1: Global Market Value (USD Million) Forecast by Region, 2020 to 2035
  • Table 2: Global Market Value (USD Million) Forecast by Classification , 2020 to 2035
  • Table 3: Global Market Value (USD Million) Forecast by Application, 2020 to 2035
  • Table 4: North America Market Value (USD Million) Forecast by Country, 2020 to 2035
  • Table 5: North America Market Value (USD Million) Forecast by Classification , 2020 to 2035
  • Table 6: North America Market Value (USD Million) Forecast by Application, 2020 to 2035
  • Table 7: Latin America Market Value (USD Million) Forecast by Country, 2020 to 2035
  • Table 8: Latin America Market Value (USD Million) Forecast by Classification , 2020 to 2035
  • Table 9: Latin America Market Value (USD Million) Forecast by Application, 2020 to 2035
  • Table 10: Western Europe Market Value (USD Million) Forecast by Country, 2020 to 2035
  • Table 11: Western Europe Market Value (USD Million) Forecast by Classification , 2020 to 2035
  • Table 12: Western Europe Market Value (USD Million) Forecast by Application, 2020 to 2035
  • Table 13: Eastern Europe Market Value (USD Million) Forecast by Country, 2020 to 2035
  • Table 14: Eastern Europe Market Value (USD Million) Forecast by Classification , 2020 to 2035
  • Table 15: Eastern Europe Market Value (USD Million) Forecast by Application, 2020 to 2035
  • Table 16: East Asia Market Value (USD Million) Forecast by Country, 2020 to 2035
  • Table 17: East Asia Market Value (USD Million) Forecast by Classification , 2020 to 2035
  • Table 18: East Asia Market Value (USD Million) Forecast by Application, 2020 to 2035
  • Table 19: South Asia and Pacific Market Value (USD Million) Forecast by Country, 2020 to 2035
  • Table 20: South Asia and Pacific Market Value (USD Million) Forecast by Classification , 2020 to 2035
  • Table 21: South Asia and Pacific Market Value (USD Million) Forecast by Application, 2020 to 2035
  • Table 22: Middle East & Africa Market Value (USD Million) Forecast by Country, 2020 to 2035
  • Table 23: Middle East & Africa Market Value (USD Million) Forecast by Classification , 2020 to 2035
  • Table 24: Middle East & Africa Market Value (USD Million) Forecast by Application, 2020 to 2035

List of Figures

  • Figure 1: Global Market Pricing Analysis
  • Figure 2: Global Market Value (USD Million) Forecast 2020-2035
  • Figure 3: Global Market Value Share and BPS Analysis by Classification , 2025 and 2035
  • Figure 4: Global Market Y-o-Y Growth Comparison by Classification , 2025-2035
  • Figure 5: Global Market Attractiveness Analysis by Classification
  • Figure 6: Global Market Value Share and BPS Analysis by Application, 2025 and 2035
  • Figure 7: Global Market Y-o-Y Growth Comparison by Application, 2025-2035
  • Figure 8: Global Market Attractiveness Analysis by Application
  • Figure 9: Global Market Value (USD Million) Share and BPS Analysis by Region, 2025 and 2035
  • Figure 10: Global Market Y-o-Y Growth Comparison by Region, 2025-2035
  • Figure 11: Global Market Attractiveness Analysis by Region
  • Figure 12: North America Market Incremental Dollar Opportunity, 2025-2035
  • Figure 13: Latin America Market Incremental Dollar Opportunity, 2025-2035
  • Figure 14: Western Europe Market Incremental Dollar Opportunity, 2025-2035
  • Figure 15: Eastern Europe Market Incremental Dollar Opportunity, 2025-2035
  • Figure 16: East Asia Market Incremental Dollar Opportunity, 2025-2035
  • Figure 17: South Asia and Pacific Market Incremental Dollar Opportunity, 2025-2035
  • Figure 18: Middle East & Africa Market Incremental Dollar Opportunity, 2025-2035
  • Figure 19: North America Market Value Share and BPS Analysis by Country, 2025 and 2035
  • Figure 20: North America Market Value Share and BPS Analysis by Classification , 2025 and 2035
  • Figure 21: North America Market Y-o-Y Growth Comparison by Classification , 2025-2035
  • Figure 22: North America Market Attractiveness Analysis by Classification
  • Figure 23: North America Market Value Share and BPS Analysis by Application, 2025 and 2035
  • Figure 24: North America Market Y-o-Y Growth Comparison by Application, 2025-2035
  • Figure 25: North America Market Attractiveness Analysis by Application
  • Figure 26: Latin America Market Value Share and BPS Analysis by Country, 2025 and 2035
  • Figure 27: Latin America Market Value Share and BPS Analysis by Classification , 2025 and 2035
  • Figure 28: Latin America Market Y-o-Y Growth Comparison by Classification , 2025-2035
  • Figure 29: Latin America Market Attractiveness Analysis by Classification
  • Figure 30: Latin America Market Value Share and BPS Analysis by Application, 2025 and 2035
  • Figure 31: Latin America Market Y-o-Y Growth Comparison by Application, 2025-2035
  • Figure 32: Latin America Market Attractiveness Analysis by Application
  • Figure 33: Western Europe Market Value Share and BPS Analysis by Country, 2025 and 2035
  • Figure 34: Western Europe Market Value Share and BPS Analysis by Classification , 2025 and 2035
  • Figure 35: Western Europe Market Y-o-Y Growth Comparison by Classification , 2025-2035
  • Figure 36: Western Europe Market Attractiveness Analysis by Classification
  • Figure 37: Western Europe Market Value Share and BPS Analysis by Application, 2025 and 2035
  • Figure 38: Western Europe Market Y-o-Y Growth Comparison by Application, 2025-2035
  • Figure 39: Western Europe Market Attractiveness Analysis by Application
  • Figure 40: Eastern Europe Market Value Share and BPS Analysis by Country, 2025 and 2035
  • Figure 41: Eastern Europe Market Value Share and BPS Analysis by Classification , 2025 and 2035
  • Figure 42: Eastern Europe Market Y-o-Y Growth Comparison by Classification , 2025-2035
  • Figure 43: Eastern Europe Market Attractiveness Analysis by Classification
  • Figure 44: Eastern Europe Market Value Share and BPS Analysis by Application, 2025 and 2035
  • Figure 45: Eastern Europe Market Y-o-Y Growth Comparison by Application, 2025-2035
  • Figure 46: Eastern Europe Market Attractiveness Analysis by Application
  • Figure 47: East Asia Market Value Share and BPS Analysis by Country, 2025 and 2035
  • Figure 48: East Asia Market Value Share and BPS Analysis by Classification , 2025 and 2035
  • Figure 49: East Asia Market Y-o-Y Growth Comparison by Classification , 2025-2035
  • Figure 50: East Asia Market Attractiveness Analysis by Classification
  • Figure 51: East Asia Market Value Share and BPS Analysis by Application, 2025 and 2035
  • Figure 52: East Asia Market Y-o-Y Growth Comparison by Application, 2025-2035
  • Figure 53: East Asia Market Attractiveness Analysis by Application
  • Figure 54: South Asia and Pacific Market Value Share and BPS Analysis by Country, 2025 and 2035
  • Figure 55: South Asia and Pacific Market Value Share and BPS Analysis by Classification , 2025 and 2035
  • Figure 56: South Asia and Pacific Market Y-o-Y Growth Comparison by Classification , 2025-2035
  • Figure 57: South Asia and Pacific Market Attractiveness Analysis by Classification
  • Figure 58: South Asia and Pacific Market Value Share and BPS Analysis by Application, 2025 and 2035
  • Figure 59: South Asia and Pacific Market Y-o-Y Growth Comparison by Application, 2025-2035
  • Figure 60: South Asia and Pacific Market Attractiveness Analysis by Application
  • Figure 61: Middle East & Africa Market Value Share and BPS Analysis by Country, 2025 and 2035
  • Figure 62: Middle East & Africa Market Value Share and BPS Analysis by Classification , 2025 and 2035
  • Figure 63: Middle East & Africa Market Y-o-Y Growth Comparison by Classification , 2025-2035
  • Figure 64: Middle East & Africa Market Attractiveness Analysis by Classification
  • Figure 65: Middle East & Africa Market Value Share and BPS Analysis by Application, 2025 and 2035
  • Figure 66: Middle East & Africa Market Y-o-Y Growth Comparison by Application, 2025-2035
  • Figure 67: Middle East & Africa Market Attractiveness Analysis by Application
  • Figure 68: Global Market - Tier Structure Analysis
  • Figure 69: Global Market - Company Share Analysis
Dashboard
Dashboard
Dashboard
Dashboard
Dashboard
Dashboard

Our Research Products

Full Research Suite

The "Full Research Suite" delivers actionable market intel, deep dives on markets or technologies, so clients act faster, cut risk, and unlock growth.

Competitor Leaderboard Report

The Leaderboard benchmarks and ranks top vendors, classifying them as Established Leaders, Leading Challengers, or Disruptors & Challengers.

Future Leaders Index

Locates where complements amplify value and substitutes erode it, forecasting net impact by horizon

Market Data & Forecasts

We deliver granular, decision-grade intel: market sizing, 5-year forecasts, pricing, adoption, usage, revenue, and operational KPIs—plus competitor tracking, regulation, and value chains—across 60 countries broadly.

Market Focus Report

Spot the shifts before they hit your P&L. We track inflection points, adoption curves, pricing moves, and ecosystem plays to show where demand is heading, why it is changing, and what to do next across high-growth markets and disruptive tech

Survey Report

Real-time reads of user behavior. We track shifting priorities, perceptions of today’s and next-gen services, and provider experience, then pace how fast tech moves from trial to adoption, blending buyer, consumer, and channel inputs with social signals (#WhySwitch, #UX).

Bespoke Reports

Partner with our analyst team to build a custom report designed around your business priorities. From analysing market trends to assessing competitors or crafting bespoke datasets, we tailor insights to your needs.

Supplier Intelligence

Discovery & Profiling

Capacity & Footprint

Performance & Risk

Compliance & Governance

Commercial Readiness

Who Supplies Whom

Scorecards & Shortlists

Playbooks & Docs

Category Intelligence

Definition & Scope

Demand & Use Cases

Cost Drivers

Market Structure

Supply Chain Map

Trade & Policy

Operating Norms

Deliverables

Buyer Intelligence

Account Basics

Spend & Scope

Procurement Model

Vendor Requirements

Terms & Policies

Entry Strategy

Pain Points & Triggers

Outputs

Pricing Analysis

Benchmarks

Trends

Should-Cost

Indexation

Landed Cost

Commercial Terms

Deliverables

Brand Analysis

Positioning & Value Prop

Share & Presence

Customer Evidence

Go-to-Market

Digital & Reputation

Compliance & Trust

KPIs & Gaps

Outputs

Full Research Suite comprises of:

Market outlook & trends analysis

Market outlook & trends analysis

Interviews & case studies

Interviews & case studies

Strategic recommendations

Strategic recommendations

Vendor profiles & capabilities analysis

Vendor profiles & capabilities analysis

5-year forecasts

5-year forecasts

8 regions and 60+ country-level data splits

8 regions and 60+ country-level data splits

Market segment data splits

Market segment data splits

12 months of continuous data updates

12 months of continuous data updates

DELIVERED AS:

PDF EXCEL ONLINE

Full Research Suite


$5000

$7500

$10000

Buy Report Now
Future Market Insights

SocialFi NFTs Market

Chat With MaRIA

Chat With

MaRIA

Hi There, I am MaRIA, Your Market Research Intelligence Assistant. How may I help you?