United States & Canada Pest Control Services Market
Find out with FMI How the Rising Adoption of Biopesticides and Integrated Services has Boosted Revenues for Manufacturers across the United States and Canada!
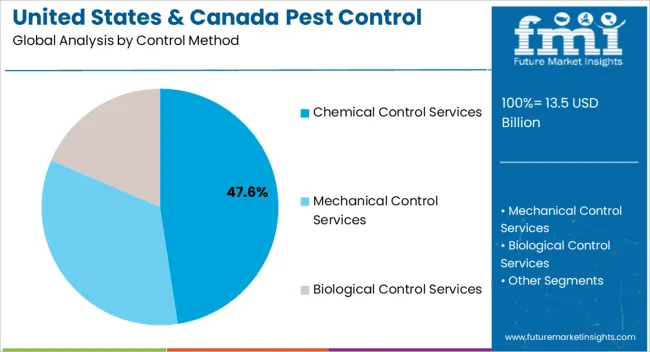
A Detailed Analysis of the United States & Canada Pest Control Services Market on the Basis of Chemical Control Services, Mechanical Control Services, & Biological Control Services
United States & Canada Pest Control Services Market Outlook (2023 to 2033)
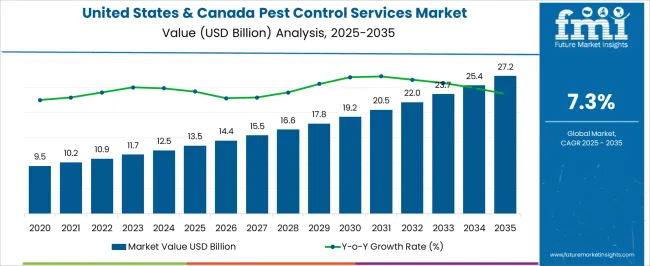
The United States & Canada pest control services market sales revenue is estimated to total ~US$ 11,694.4 million in 2023. From 2023 to 2033, pest control services demand in the United States & Canada market is set to rise at around 7.3% CAGR. Total market value at the end of 2033 is expected to surpass US$ 23,705.3 million by 2033, at a CAGR of from 2023 to 2033.
Share of the United States and Canada market in the global pest control services market is estimated at around 40% to 50%.
Key Trends Shaping the Market Dynamics:
- Rising awareness of the harmful effects of pests on human health, environment and food security will elevate pest control services demand
- Rapid shift towards eco-friendly and sustainable pest control solutions such as biopesticides will support market expansion
- Growing popularity of integrated pest management (IPM) practices across the United States and Canada will foster market development
- Escalating food insecurity concerns is expected to create high demand for pest control products and services
- Increasing incidence of pest-borne diseases is likely to create lucrative opportunities for pest control service providers
- Adoption of advanced technologies such as IoT in pest control will boost the market
- Surging demand for commercial pest control as well as residential pest control will create a plethora of opportunities for market growth
- Introduction of new food regulations and sanitation protocols could open new opportunities for pest control companies
- Rapid increase in the population of pests due to changing climatic conditions will act as a catalyst triggering market development
In recent years, climate change has sharply increased the number of pests across countries such as the United States and Canada. This in turn has put the pest control services industry into spotlight.
Pest control or pest management services are services used to manage or eliminate creatures such as pests. The adoption of these services allows people to effectively control and eliminate pest populations.
Pests are destructive organisms or insects that significantly affect human activities. They can attack and damage crops, livestock, and structures. They can also bring various serious health issues. To tackle this and get rid of pests, people use various pest control services.
The market for pest control services is expanding as a result of several factors. This includes rising economic activity, population growth, adverse effects of insects, and growing intolerance towards pests.
Pest control services offer various benefits to customers. For instance,
- They help in controlling and eliminating pests and make customers worry-free
- They save a lot of time
- They also save money as buying new traps, insecticides, and other pest control products can be costly
The need for pest management services is rising because of climate change. According to a document released by the World Health Organization (WHO), warmer temperatures suggest that fly populations could rise to 244% by 2080 in comparison to current levels. This might lead to an increase in infections spread by flies.
Consumers are anticipated to be more willing to use pest control services and take preventative measures to avoid adverse circumstances. This in turn will fuel pest control services demand across the United States and Canada.
Rise in crop pests and disease is becoming a global threat and is resulting in food insecurity concerns. According to the Food and Agricultural Organization (FAO), around 40% of global crop production is lost annually to pests.
To prevent pests from destroying crops, farmers across countries such as the United States and Canada use pest control services. This is expected to boost the pest control service sales revenues during the forecast period.
Companies that can offer eco-friendly and sustainable pest control solutions are likely to succeed in the market. Similarly, players that use advanced technologies will attract more and more customers.
On the other hand, use of traditional pesticides and development of resistance in some pests against pesticides are key restraints of pest control services market.
Attribute | Key Insights |
---|---|
Estimated United States & Canada Pest Control Services Market Size (2023E) |
US$ 11,694.4 million |
Projected United States & Canada Pest Control Services Market Value (2033F) |
US$ 23,705.3 million |
Value-based CAGR (2023 to 2033) |
7.3% |
Collective Value Share: Top 5 Companies (2022A) |
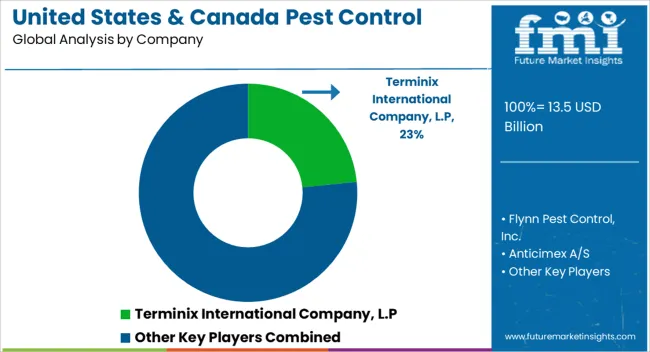
~25 to 30% |
Don't pay for what you don't need
Customize your report by selecting specific countries or regions and save 30%!
2018 to 2022 United States & Canada Pest Control Services Sales Outlook Compared to Demand Forecast from 2023 to 2033
As per Future Market Insights (FMI), pest control services sales revenue in the United States & Canada markets grew at 6.5% CAGR from 2018 to 2022. For the next ten years, the market is projected to thrive at around 7.3% CAGR.
The pest control services market is driven by factors such as the increasing adoption of digital applications and technology.
Pest control is crucial for ensuring food safety in the worldwide food supply chain. Automation and a sustainable approach have become prominent within the supply chain, and the increasing demand for pest control services has resulted in a significant rise in the number of service providers in the market.
With the use of digital technologies such as motion sensors and automated traps, operating companies have expanded their scope of offerings to include monitoring and suppression.
For instance, to effectively monitor food-processing facilities, Rentokil Initial PLC provides digital pest management technologies, like the PestConnect line of IoT-enabled devices.
These few factors are expected to boost development and alter current patterns in pest control services throughout the projection period.
Comparative View of Adjacent Pest Control Services Market
The United States & Canada pest control services market is set to be impacted by the peer, or tangential markets in the pest control industry. These include mosquito repellent candles market and termite bait products market.
On analysis of these related industries Future Market Insights (FMI) has found profound insights that will be helpful for developing unique differentiating strategies to pursue for growth and opportunity.
United States & Canada Pest Control Services Market:
Attribute | United States & Canada Pest Control Services Industry |
---|---|
CAGR (2023 to 2033) |
7.3% |
Market Value (2023) |
US$ 11,694.4m million |
Growth Factor |
Growing awareness of the harmful effects of pests and a spotlight on pest prevention are key factors driving the United States & Canada pest control services industry. |
Key Trend |
Increasing adoption of digital applications and technology will boost the market. |
Mosquito Repellent Candles Market:
Attribute | Mosquito Repellent Candles Market |
---|---|
CAGR (2023 to 2033) |
~8.7% |
Market Value (2023) |
~US$ 35.8 million |
Growth Factor |
Growing demand for new mosquito repellent products containing natural ingredients will swiftly drive the market. |
Key Trend |
Introduction of new scents and designs to appeal to different consumer preferences is likely to foster market expansion. |
Termite Bait Products Market:
Attribute | Termite Bait Products Market |
---|---|
CAGR (2023 to 2033) |
~5.8% |
Market Value (2023) |
US$ 1.56 Billion |
Growth Factor |
Increasing awareness about the damaging effects of termites is expected to spur growth in the termite bait products market. |
Key Trend |
Rising usage of sustainable and eco-friendly solutions for termite control will support market expansion. |
Find your sweet spots for generating winning opportunities in this market.
Talk to AnalystKey Dynamics in the United States & Canada Pest Control Services Market
Growing Awareness of Harmful Effects of Pests Boosting Pest Control Services Demand
One of the key dynamics driving the demand for pest control services is the increasing awareness of the harmful effects of pests on human health and the environment.
Consumers are becoming more aware of the risks associated with pests and are demanding pest control services to ensure the safety and well-being of people and their surroundings. This will continue to expand the United States & Canada pest control services market size.
Adoption of Integrated Pest Management (IPM) Practices to Foster Market Development
Another significant dynamic is the adoption of integrated pest management practices. IPM involves the use of multiple techniques such as biological and mechanical control methods, to manage pest problems in a sustainable and environmentally responsible way.
IPM approach is gaining popularity due to its effectiveness and the growing awareness of environmental sustainability.
Growing Demand for Eco-friendly and Sustainable Solutions to Create Opportunities for Companies
The pest control services industry is also being driven by the growing demand for eco-friendly and sustainable solutions. Consumers are becoming more conscious of the environmental impact of pest control chemicals and are seeking safer and more sustainable alternatives. This is leading to the development of non-toxic and biodegradable pest control products and services.
Rapid shift towards eco-friendly and sustainable solutions will open new growth opportunities for companies.
Increasing Adoption of Digital Applications and Technology to Fuel Market Expansion
The adoption of digital applications and technology is also a key dynamic in the pest control services market.
Pest control service providers are leveraging digital technologies such as loT-enabled pest-control devices, motion sensors, and automated traps to improve the efficiency and effectiveness of their services. This trend is driven by the need for more accurate and precise pest control, especially in commercial and industrial applications.
Category-wise Insights
Which Pest Type is Expected to Create Lucrative Opportunities for the Market?
Insects Category to Create Lucrative Growth Opportunities
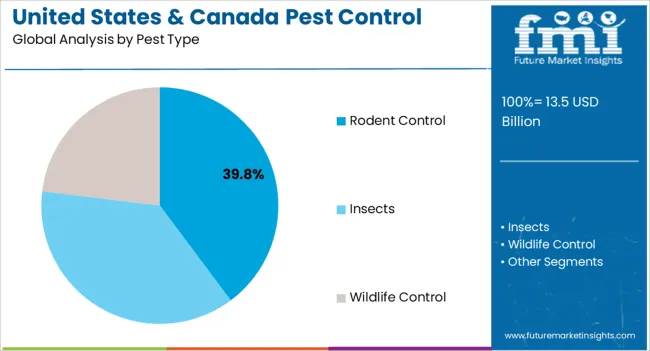
Based on pest type, insects segment will continue to generate lucrative opportunities for the United States & Canada pest control service providers. The target segment held a significant market share of around 62.2% in 2022. This is due to rising need for preventing crop loss triggered by increasing insect activity.
Similarly, rising need for eradicating insects from hospitals, hotels, industries, airports, etc. to minimize risk of diseases will boost growth of the target segment.
According to a 2018 study by the National Pest Management Association (NPMA), over 95% of pest management professionals have dealt with bed bugs, and more than 70% of them believe the bed bug treatment overall was successful.
Similarly, about 65% of experts said that there is a rising demand for pest control & management services. The study also found that 90% of pest control experts had seen bed bugs in apartments or condominiums, over 65% had seen them in hotels or motels, and so on. This in turn is creating high demand for insect control services.
Which Mode of Application has Significant Demand in the Target Market?
Powder Category to Witness Rising Demand
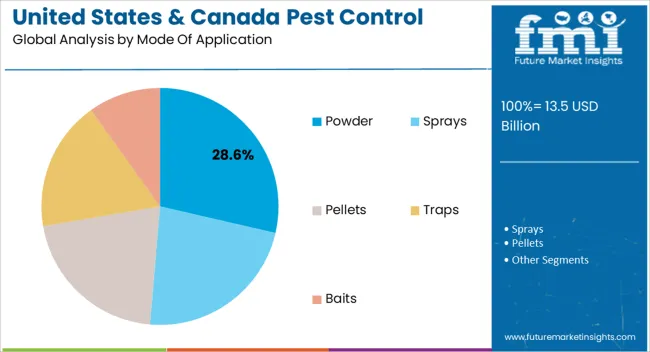
By mode of application, the powder segment holds a significant share in terms of revenue. It is primarily used to get rid of ants and cockroaches.
In powder formulations, common active substances such as cypermethrin and hydramethylnon are utilized. Although it is effective, powder formulations are also highly regulated.
While hydramethylnon poses no risk to people, the United States Environmental Protection Agency (EPA) has identified it as a potential carcinogen. To lessen or get rid of insect infestations, powder formulations can be used in residential, commercial, and transportation facilities.
What is a Highly Remunerative Application for Pest Control Service Providers?
Commercial Sector to Remain a Key Revenue-generation Segment
Application in the commercial category held a significant share of 35.6% in 2022. Further, it is expected to generate lucrative revenue-generation opportunities for pest control service companies through 2033. This is due to rising need for controlling pests in commercial buildings.
Increasing intolerance for pests in commercial spaces, such as offices, healthcare, food and beverage, and hospitality is expected to boost pest control services sales revenue.
The growing infrastructure in the commercial space and strict regulations for hygiene maintenance are also contributing to this growth.
The commercial business sector typically enters into multi-year contracts with pest control service providers, which helps in generating a secure revenue stream. This is a key factor driving demand for pest control services in the commercial segment.
Get the data you need at a Fraction of the cost
Personalize your report by choosing insights you need
and save 40%!
Competitive Landscape
Prominent players in the pest control services market are employing various business strategies. This includes the launch of new pest control services, mergers, acquisitions, and geographical expansions.
To deliver effective products and services, major firms compete to combine cutting-edge technologies. These innovations are intended to meet the growing demand for pest control services in commercial areas and big organizations that must maintain hygienic workplaces.
For instance:
- In 2022, Rentokil Initial PLC announced that it had acquired Vector Disease Acquisition, LLC, a United States-based company that provides mosquito control services. The acquisition expanded Rentokil's capabilities in the area of mosquito control and prevention, which is becoming increasingly important as the incidence of mosquito-borne diseases continues to rise.
- In 2021, to research, co-develop, & commercialize biological enzyme-based crop protection solutions, Novozymes and FMC Corporation collaborated.
Scope of the Report
Attribute | Details |
---|---|
Estimated Market Value (2023) |
US$ 11,694.4 million |
Projected Market Value (2033) |
US$ 23,705.3 million |
Anticipated Growth Rate (2023 to 2033) |
7.3% CAGR |
Forecast Period |
2023 to 2033 |
Historical Data Available for |
2018 to 2022 |
Market Analysis |
US$ million/billion for Value |
Key Segments Covered |
|
Key Companies Profiled |
|
Report Coverage |
Market Forecast, Company Share Analysis, Competition Intelligence, DROT Analysis, Market Dynamics and Challenges, and Strategic Growth Initiatives |
United States & Canada Pest Control Services Market by Category
By Control Method:
- Chemical Control Services
- Insecticides
- Rodenticides
- Others (Pheromones and Repellents)
- Mechanical Control Services
- Trapping
- Light Traps
- Adhesive Traps
- Malaise Traps
- Biological Control Services
- Microbial
- Plant-Extracts
- Predatory Insect
By Pest Type:
- Rodent Control
- Insects
- Cockroaches
- Ants
- Bedbugs
- Termites
- Mosquitoes
- Wasps
- Flies
- Other Insect Controls
- Wildlife Control
- Birds
- Fleas
By Mode of Application:
- Powder
- Sprays
- Pellets
- Traps
- Baits
By Application:
- Residential
- Commercial
- Agricultural
- Industrial
- Other Application
Frequently Asked Questions
What is the current size of the United States & Canada pest control services industry?
The United States & Canada pest services industry is likely to reach ~US$ 11,694.4 in 2023.
What is the projected valuation for the target market at the end of the forecast period?
The target market is projected to reach a valuation of around US$ 23,705.3 million by 2033-end.
How big is the pest control services market in the United States?
The United States pest control services market is estimated to reach a valuation of US$ 10,746.6 million in 2023.
How big is the pest control services industry in Canada?
Canada pest control services market is estimated to reach a valuation of US$ 948.9 million in 2023.
At what rate will demand for pest control services rise in the United States through 2033?
Pest control services demand in the United States is forecast to rise at ~7.2% CAGR between 2023 and 2033.
What is Canada pest control services demand outlook?
Demand for pest control services in Canada is expected to increase at around 8.9% CAGR through 2033.
Table of Content
1. Executive Summary 1.1. Market Outlook 1.2. Summary of Key Findings 1.3. Summary of Key Statistics 1.4. FMI Analysis and Recommendations 2. Market Overview 2.1. Market Taxonomy 2.2. Market Definition 2.3. Market Introduction 3. Key Market Trends 3.1. Key Trends Impacting the Market 3.1.1. Increasing Deployment of Digital Pest Control 3.1.2. Technology Advancement in Pest Control Service 3.1.3. Rise in Restoration and Cleaning in Residential, Commercial, and Agriculture 3.1.4. Pest Infestations May Damage A Home or Business 3.1.5. Increase in Usage of Organic Control Method 3.2. Product Innovation / Development Trends 4. Key Success Factors 4.1. Go To Market strategy 4.2. Strategic Promotional Strategies 4.3. Customer educational programs - Pest issues and basic biology of the pest 5. Market Demand Analysis 2018 to 2022 and Forecast, 2023 to 2033 5.1. Historical Market Value (US$ Million) Analysis, 2018 to 2022 5.2. Current and Future Market Value (US$ Million) Projections, 2023 to 2033 5.3. Y-o-Y Growth Trend Analysis 6. Market Background 6.1. Macro-Economic Factors 6.2. Forecast Factors - Relevance & Impact 6.3. Value Chain Analysis 6.4. Market Dynamics 6.4.1. Drivers 6.4.2. Restraints 6.4.3. Opportunity Analysis 6.5. Social Media Sentiment Analysis 6.5.1. Consumer Perception of target products on social media platforms- Positive and Negative Mentions 6.5.2. Trending Brands 6.5.3. Trending #hashtags 6.5.4. Social Media Platform Mentions (% of total mentions) 6.5.5. Social Media Mentions (% total mentions) 6.5.6. Trending Subject Titles 6.6. PESTLE Analysis 6.7. Porter’s Five Force 7. Market Analysis 2018 to 2022 and Forecast 2023 to 2033, by Control Method 7.1. Introduction / Key Findings 7.2. Historical Market Size (US$ Million) Analysis By Control Method, 2018 to 2022 7.3. Current and Future Market Size (US$ Million) Analysis and Forecast By Control Method, 2023 to 2033 7.3.1. Chemical Control Services 7.3.1.1. Insecticides 7.3.1.2. Rodenticides 7.3.1.3. Others (pheromones and repellents) 7.3.2. Mechanical Control Services 7.3.2.1. Trapping 7.3.2.2. Light traps 7.3.2.3. Adhesive traps 7.3.2.4. Malaise traps 7.3.3. Biological Control Services 7.3.3.1. Microbial 7.3.3.2. Plant-extracts 7.3.3.3. Predatory insect 7.4. Market Attractiveness Analysis By Control Method 8. Market Analysis 2018 to 2022 and Forecast 2023 to 2033, by Pest Type 8.1. Introduction / Key Findings 8.2. Historical Market Size (US$ Million) Analysis By Pest Type, 2018 to 2022 8.3. Current and Future Market Size (US$ Million) Analysis and Forecast By Pest Type, 2023 to 2033 8.3.1. Rodent Control 8.3.2. Insects 8.3.2.1. Cockroaches 8.3.2.2. Ants 8.3.2.3. Bedbugs 8.3.2.4. Termites 8.3.2.5. Mosquitoes 8.3.2.6. Wasps 8.3.2.7. Flies 8.3.2.8. Other Insect Controls 8.3.3. Wildlife Control 8.3.3.1. Birds 8.3.3.2. Fleas 8.4. Market Attractiveness Analysis By Pest Type 9. Market Analysis 2018 to 2022 and Forecast 2023 to 2033, By Mode of Application 9.1. Introduction / Key Findings 9.2. Historical Market Size (US$ Million) Analysis By Mode of Application, 2018 to 2022 9.3. Current and Future Market Size (US$ Million) Analysis and Forecast By Mode of Application, 2023 to 2033 9.3.1. Powder 9.3.2. Sprays 9.3.3. Pellets 9.3.4. Traps 9.3.5. Baits 9.4. Market Attractiveness Analysis By Mode of Application 10. Market Analysis 2018 to 2022 and Forecast 2023 to 2033, by Application 10.1. Introduction / Key Findings 10.2. Historical Market Size (US$ Million) Analysis By Application, 2018 to 2022 10.3. Current and Future Market Size (US$ Million) Analysis and Forecast By Application, 2023 to 2033 10.3.1. Residential 10.3.2. Commercial 10.3.3. Agricultural 10.3.4. Industrial 10.3.5. Other Application 10.4. Market Attractiveness Analysis By Application 11. Market Analysis 2018 to 2022 and Forecast 2023 to 2033, by Country 11.1. Introduction / Key Findings 11.2. Historical Market Size (US$ Million) Analysis By Country, 2018 to 2022 11.3. Current and Future Market Size (US$ Million) Analysis and Forecast By Country, 2023 to 2033 11.3.1. United States 11.3.2. Canada 11.4. Market Attractiveness Analysis By Country 12. Market Analysis 2018 to 2022 and Forecast 2023 to 2033, by Control Method 12.1. Introduction / Key Findings 12.2. Historical Market Size (US$ Million) Analysis By Control Method, 2018 to 2022 12.3. Current and Future Market Size (US$ Million) Analysis and Forecast By Control Method, 2023 to 2033 12.3.1. Chemical Control Services 12.3.1.1. Insecticides 12.3.1.2. Rodenticides 12.3.1.3. Others (pheromones and repellents) 12.3.2. Mechanical Control Services 12.3.2.1. Trapping 12.3.2.2. Light traps 12.3.2.3. Adhesive traps 12.3.2.4. Malaise traps 12.3.3. Biological Control Services 12.3.3.1. Microbial 12.3.3.2. Plant-extracts 12.3.3.3. Predatory insect 12.4. Market Attractiveness Analysis By Control Method 13. Market Analysis 2018 to 2022 and Forecast 2023 to 2033, by Pest Type 13.1. Introduction / Key Findings 13.2. Historical Market Size (US$ Million) Analysis By Pest Type, 2018 to 2022 13.3. Current and Future Market Size (US$ Million) Analysis and Forecast By Pest Type, 2023 to 2033 13.3.1. Rodent Control 13.3.2. Insects 13.3.2.1. Cockroaches 13.3.2.2. Ants 13.3.2.3. Bedbugs 13.3.2.4. Termites 13.3.2.5. Mosquitoes 13.3.2.6. Wasps 13.3.2.7. Flies 13.3.2.8. Other Insect Controls 13.3.3. Wildlife Control 13.3.3.1. Birds 13.3.3.2. Fleas 13.4. Market Attractiveness Analysis By Pest Type 14. Market Analysis 2018 to 2022 and Forecast 2023 to 2033, By Mode of Application 14.1. Introduction / Key Findings 14.2. Historical Market Size (US$ Million) Analysis By Mode of Application, 2018 to 2022 14.3. Current and Future Market Size (US$ Million) Analysis and Forecast By Mode of Application, 2023 to 2033 14.3.1. Powder 14.3.2. Sprays 14.3.3. Pellets 14.3.4. Traps 14.3.5. Baits 14.4. Market Attractiveness Analysis By Mode of Application 15. Market Analysis 2018 to 2022 and Forecast 2023 to 2033, by Application 15.1. Introduction / Key Findings 15.2. Historical Market Size (US$ Million) Analysis By Application, 2018 to 2022 15.3. Current and Future Market Size (US$ Million) Analysis and Forecast By Application, 2023 to 2033 15.3.1. Residential 15.3.2. Commercial 15.3.3. Agricultural 15.3.4. Industrial 15.3.5. Other Application 15.4. Market Attractiveness Analysis By Application 16. Canada Market Analysis 2018 to 2022 and Forecast 2023 to 2033, by Control Method 16.1. Introduction / Key Findings 16.2. Historical Market Size (US$ Million) Analysis By Control Method, 2018 to 2022 16.3. Current and Future Market Size (US$ Million) Analysis and Forecast By Control Method, 2023 to 2033 16.3.1. Chemical Control Services 16.3.1.1. Insecticides 16.3.1.2. Rodenticides 16.3.1.3. Others (pheromones and repellents) 16.3.2. Mechanical Control Services 16.3.2.1. Trapping 16.3.2.2. Light traps 16.3.2.3. Adhesive traps 16.3.2.4. Malaise traps 16.3.3. Biological Control Services 16.3.3.1. Microbial 16.3.3.2. Plant-extracts 16.3.3.3. Predatory insect 16.4. Market Attractiveness Analysis By Control Method 17. Canada Market Analysis 2018 to 2022 and Forecast 2023 to 2033, by Pest Type 17.1. Introduction / Key Findings 17.2. Historical Market Size (US$ Million) Analysis By Pest Type, 2018 to 2022 17.3. Current and Future Market Size (US$ Million) Analysis and Forecast By Pest Type, 2023 to 2033 17.3.1. Rodent Control 17.3.2. Insects 17.3.2.1. Cockroaches 17.3.2.2. Ants 17.3.2.3. Bedbugs 17.3.2.4. Termites 17.3.2.5. Mosquitoes 17.3.2.6. Wasps 17.3.2.7. Flies 17.3.2.8. Other Insect Controls 17.3.3. Wildlife Control 17.3.3.1. Birds 17.3.3.2. Fleas 17.4. Market Attractiveness Analysis By Pest Type 18. Canada Market Analysis 2018 to 2022 and Forecast 2023 to 2033, By Mode of Application 18.1. Introduction / Key Findings 18.2. Historical Market Size (US$ Million) Analysis By Mode of Application, 2018 to 2022 18.3. Current and Future Market Size (US$ Million) Analysis and Forecast By Mode of Application, 2023 to 2033 18.3.1. Powder 18.3.2. Sprays 18.3.3. Pellets 18.3.4. Traps 18.3.5. Baits 18.4. Market Attractiveness Analysis By Mode of Application 19. Canada Market Analysis 2018 to 2022 and Forecast 2023 to 2033, by Application 19.1. Introduction / Key Findings 19.2. Historical Market Size (US$ Million) Analysis By Application, 2018 to 2022 19.3. Current and Future Market Size (US$ Million) Analysis and Forecast By Application, 2023 to 2033 19.3.1. Residential 19.3.2. Commercial 19.3.3. Agricultural 19.3.4. Industrial 19.3.5. Other Application 19.4. Market Attractiveness Analysis By Application 20. Market Structure Analysis 20.1. Market Analysis by Tier of Companies 20.2. Market Share Analysis of Top Players 20.3. Market Presence Analysis 21. Competition Analysis 21.1. Competition Dashboard 21.2. Competition Benchmarking 21.3. Competition Deep Dive 21.3.1. Terminix 21.3.1.1. Overview 21.3.1.2. Product/Service Portfolio 21.3.1.3. Profitability by Market Segments (Control Method/Pest Type/Mode of Application/Application/Region) 21.3.1.4. Sales Footprint 21.3.1.5. Strategy Overview 21.3.2. Flynn Pest Control 21.3.2.1. Overview 21.3.2.2. Product/Service Portfolio 21.3.2.3. Profitability by Market Segments (Control Method/Pest Type/Mode of Application/Application/Region) 21.3.2.4. Sales Footprint 21.3.2.5. Strategy Overview 21.3.3. Orkin Pest Control 21.3.3.1. Overview 21.3.3.2. Product/Service Portfolio 21.3.3.3. Profitability by Market Segments (Control Method/Pest Type/Mode of Application/Application/Region) 21.3.3.4. Sales Footprint 21.3.3.5. Strategy Overview 21.3.4. Rentokill 21.3.4.1. Overview 21.3.4.2. Product/Service Portfolio 21.3.4.3. Profitability by Market Segments (Control Method/Pest Type/Mode of Application/Application/Region) 21.3.4.4. Sales Footprint 21.3.4.5. Strategy Overview 21.3.5. Pest USA 21.3.5.1. Overview 21.3.5.2. Product/Service Portfolio 21.3.5.3. Profitability by Market Segments (Control Method/Pest Type/Mode of Application/Application/Region) 21.3.5.4. Sales Footprint 21.3.5.5. Strategy Overview 21.3.6. Call A Pro Pest Control 21.3.6.1. Overview 21.3.6.2. Product/Service Portfolio 21.3.6.3. Profitability by Market Segments (Control Method/Pest Type/Mode of Application/Application/Region) 21.3.6.4. Sales Footprint 21.3.6.5. Strategy Overview 21.3.7. Local Pest Control Pro 21.3.7.1. Overview 21.3.7.2. Product/Service Portfolio 21.3.7.3. Profitability by Market Segments (Control Method/Pest Type/Mode of Application/Application/Region) 21.3.7.4. Sales Footprint 21.3.7.5. Strategy Overview 21.3.8. Green Pest Solutions 21.3.8.1. Overview 21.3.8.2. Product/Service Portfolio 21.3.8.3. Profitability by Market Segments (Control Method/Pest Type/Mode of Application/Application/Region) 21.3.8.4. Sales Footprint 21.3.8.5. Strategy Overview 21.3.9. Massey Services Inc. 21.3.9.1. Overview 21.3.9.2. Product/Service Portfolio 21.3.9.3. Profitability by Market Segments (Control Method/Pest Type/Mode of Application/Application/Region) 21.3.9.4. Sales Footprint 21.3.9.5. Strategy Overview 21.3.10. Southern Pest Control 21.3.10.1. Overview 21.3.10.2. Product/Service Portfolio 21.3.10.3. Profitability by Market Segments (Control Method/Pest Type/Mode of Application/Application/Region) 21.3.10.4. Sales Footprint 21.3.10.5. Strategy Overview 21.3.11. Bulwark Exterminating 21.3.11.1. Overview 21.3.11.2. Product/Service Portfolio 21.3.11.3. Profitability by Market Segments (Control Method/Pest Type/Mode of Application/Application/Region) 21.3.11.4. Sales Footprint 21.3.11.5. Strategy Overview 21.3.12. Primax pest control services 21.3.12.1. Overview 21.3.12.2. Product/Service Portfolio 21.3.12.3. Profitability by Market Segments (Control Method/Pest Type/Mode of Application/Application/Region) 21.3.12.4. Sales Footprint 21.3.12.5. Strategy Overview 21.3.13. Great Lakes Pest Control 21.3.13.1. Overview 21.3.13.2. Product/Service Portfolio 21.3.13.3. Profitability by Market Segments (Control Method/Pest Type/Mode of Application/Application/Region) 21.3.13.4. Sales Footprint 21.3.13.5. Strategy Overview 21.3.14. ABC Home & Commercial Services 21.3.14.1. Overview 21.3.14.2. Product/Service Portfolio 21.3.14.3. Profitability by Market Segments (Control Method/Pest Type/Mode of Application/Application/Region) 21.3.14.4. Sales Footprint 21.3.14.5. Strategy Overview 21.3.15. Gecko Pest Control 21.3.15.1. Overview 21.3.15.2. Product/Service Portfolio 21.3.15.3. Profitability by Market Segments (Control Method/Pest Type/Mode of Application/Application/Region) 21.3.15.4. Sales Footprint 21.3.15.5. Strategy Overview 21.3.16. Hpests 21.3.16.1. Overview 21.3.16.2. Product/Service Portfolio 21.3.16.3. Profitability by Market Segments (Control Method/Pest Type/Mode of Application/Application/Region) 21.3.16.4. Sales Footprint 21.3.16.5. Strategy Overview 21.3.17. Ehrlich Pest Control 21.3.17.1. Overview 21.3.17.2. Product/Service Portfolio 21.3.17.3. Profitability by Market Segments (Control Method/Pest Type/Mode of Application/Application/Region) 21.3.17.4. Sales Footprint 21.3.17.5. Strategy Overview 21.3.18. Accurate Pest Control 21.3.18.1. Overview 21.3.18.2. Product/Service Portfolio 21.3.18.3. Profitability by Market Segments (Control Method/Pest Type/Mode of Application/Application/Region) 21.3.18.4. Sales Footprint 21.3.18.5. Strategy Overview 21.3.19. Crystal Pest Control, LLC 21.3.19.1. Overview 21.3.19.2. Product/Service Portfolio 21.3.19.3. Profitability by Market Segments (Control Method/Pest Type/Mode of Application/Application/Region) 21.3.19.4. Sales Footprint 21.3.19.5. Strategy Overview 21.3.20. Green Earth Pest Control 21.3.20.1. Overview 21.3.20.2. Product/Service Portfolio 21.3.20.3. Profitability by Market Segments (Control Method/Pest Type/Mode of Application/Application/Region) 21.3.20.4. Sales Footprint 21.3.20.5. Strategy Overview 21.3.21. BHB Pest Elimination 21.3.21.1. Overview 21.3.21.2. Product/Service Portfolio 21.3.21.3. Profitability by Market Segments (Control Method/Pest Type/Mode of Application/Application/Region) 21.3.21.4. Sales Footprint 21.3.21.5. Strategy Overview 21.3.22. Other Key Players (As per Request) 21.3.22.1. Overview 21.3.22.2. Product/Service Portfolio 21.3.22.3. Profitability by Market Segments (Control Method/Pest Type/Mode of Application/Application/Region) 21.3.22.4. Sales Footprint 21.3.22.5. Strategy Overview 22. Assumptions and Acronyms Used 23. Research Methodology
Don't pay for what you don't need
Customize your report by selecting specific countries or regions and save 30%!
List of Tables
Table 1: Market Value (US$ Million) Forecast, By Control Method, 2018 to 2033 Table 2: Market Value (US$ Million) Forecast, By Pest Type, 2018 to 2033 Table 3: Market Value (US$ Million) Forecast, By Mode of Application, 2018 to 2033 Table 4: Market Value (US$ Million) Forecast, By Application, 2018 to 2033 Table 5: Market Value (US$ Million) Forecast, By Control Method, 2018 to 2033 Table 6: Market Value (US$ Million) Forecast, By Pest Type, 2018 to 2033 Table 7: Market Value (US$ Million) Forecast, By Mode of Application, 2018 to 2033 Table 8: Market Value (US$ Million) Forecast, By Application, 2018 to 2033 Table 9: Canada Market Value (US$ Million) Forecast, By Control Method, 2018 to 2033 Table 10: Canada Market Value (US$ Million) Forecast, By Pest Type, 2018 to 2033 Table 11: Canada Market Value (US$ Million) Forecast, By Mode of Application, 2018 to 2033 Table 12: Canada Market Value (US$ Million) Forecast, By Application, 2018 to 2033
Find your sweet spots for generating winning opportunities in this market.
Talk to AnalystList of Charts
Figure 01: Market Value (US$ Million) Analysis, 2018 to 2022 Figure 02: Market Value (US$ Million) Forecast, 2023 to 2033 Figure 03: Market Value (US$ Million) Analysis, 2018 to 2022 Figure 04: Market Value (US$ Million) Forecast, 2023 to 2033 Figure 05: Market Absolute $ Opportunity Value (US$ Million), 2023 to 2033 Figure 06: Market Value (US$ Million) Analysis By Control Method, 2018 to 2033 Figure 07: Market Y-o-Y Growth (%) Projections, By Control Method, 2023 to 2033 Figure 08: Market Attractiveness By Control Method, 2023 to 2033 Figure 09: Market Value (US$ Million) Analysis By Pest Type, 2018 to 2033 Figure 10: Market Y-o-Y Growth (%) Projections, By Pest Type, 2023 to 2033 Figure 11: Market Attractiveness By Pest Type, 2023 to 2033 Figure 12: Market Value (US$ Million) Analysis By Mode of Application, 2018 to 2033 Figure 13: Market Y-o-Y Growth (%) Projections, By Mode of Application, 2023 to 2033 Figure 14: Market Attractiveness By Mode of Application, 2023 to 2033 Figure 15: Market Value (US$ Million) Analysis By Application, 2018 to 2033 Figure 16: Market Y-o-Y Growth (%) Projections, By Application, 2023 to 2033 Figure 17: Market Attractiveness By Application, 2023 to 2033 Figure 18: Market Value (US$ Million) Analysis By Country, 2018 to 2033 Figure 19: Market Y-o-Y Growth (%) Projections, By Country, 2023 to 2033 Figure 20: Market Attractiveness By Country, 2023 to 2033 Figure 21: Market Value (US$ Million) Analysis, 2018 to 2022 Figure 22: Market Value (US$ Million) Forecast, 2023 to 2033 Figure 23: Market Value (US$ Million) Analysis, 2018 to 2022 Figure 24: Market Value (US$ Million) Forecast, 2023 to 2033 Figure 25: Market Absolute $ Opportunity Value (US$ Million), 2023 to 2033 Figure 26: Market Value (US$ Million) Analysis By Control Method, 2018 to 2033 Figure 27: Market Y-o-Y Growth (%) Projections, By Control Method, 2023 to 2033 Figure 28: Market Attractiveness By Control Method, 2023 to 2033 Figure 29: Market Value (US$ Million) Analysis By Pest Type, 2018 to 2033 Figure 30: Market Y-o-Y Growth (%) Projections, By Pest Type, 2023 to 2033 Figure 31: Market Attractiveness By Pest Type, 2023 to 2033 Figure 32: Market Value (US$ Million) Analysis By Mode of Application, 2018 to 2033 Figure 33: Market Y-o-Y Growth (%) Projections, By Mode of Application, 2023 to 2033 Figure 34: Market Attractiveness By Mode of Application, 2023 to 2033 Figure 35: Market Value (US$ Million) Analysis By Application, 2018 to 2033 Figure 36: Market Y-o-Y Growth (%) Projections, By Application, 2023 to 2033 Figure 37: Market Attractiveness By Application, 2023 to 2033 Figure 38: Canada Market Value (US$ Million) Analysis, 2018 to 2022 Figure 39: Canada Market Value (US$ Million) Forecast, 2023 to 2033 Figure 40: Canada Market Value (US$ Million) Analysis, 2018 to 2022 Figure 41: Canada Market Value (US$ Million) Forecast, 2023 to 2033 Figure 42: Canada Market Absolute $ Opportunity Value (US$ Million), 2023 to 2033 Figure 43: Canada Market Value (US$ Million) Analysis By Control Method, 2018 to 2033 Figure 44: Canada Market Y-o-Y Growth (%) Projections, By Control Method, 2023 to 2033 Figure 45: Canada Market Attractiveness By Control Method, 2023 to 2033 Figure 46: Canada Market Value (US$ Million) Analysis By Pest Type, 2018 to 2033 Figure 47: Canada Market Y-o-Y Growth (%) Projections, By Pest Type, 2023 to 2033 Figure 48: Canada Market Attractiveness By Pest Type, 2023 to 2033 Figure 49: Canada Market Value (US$ Million) Analysis By Mode of Application, 2018 to 2033 Figure 50: Canada Market Y-o-Y Growth (%) Projections, By Mode of Application, 2023 to 2033 Figure 51: Canada Market Attractiveness By Mode of Application, 2023 to 2033 Figure 52: Canada Market Value (US$ Million) Analysis By Application, 2018 to 2033 Figure 53: Canada Market Y-o-Y Growth (%) Projections, By Application, 2023 to 2033 Figure 54: Canada Market Attractiveness By Application, 2023 to 2033
Explore Services and Utilities Insights
View Reports