United States Green Tea Supplement Market Size and Share Forecast Outlook 2025 to 2035

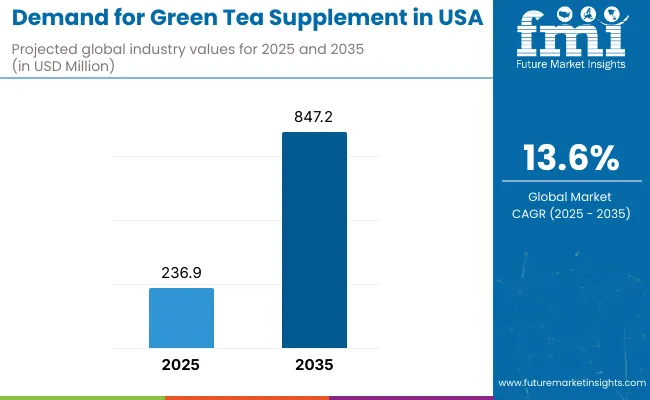
Sales of green tea supplements in the USA are estimated at USD 236.9 million in 2025, with projections indicating a rise to USD 847.2 million by 2035, reflecting a CAGR of 13.6% over the forecast period. This growth is driven by increasing awareness of preventive healthcare, growing consumer preference for plant-based and clean-label supplements, rising obesity rates in the United States, and expanding scientific research around green tea's therapeutic benefits. Per capita consumption is expected to steadily increase as consumers continue to seek natural wellness solutions that offer antioxidant properties and metabolic health support.

Capsule green tea supplements are poised to remain the leading form segment with a 47% share in 2025, owing to superior convenience, precise dosage control, and widespread consumer familiarity with this delivery format. Powder alternatives, while still significant, cater to specific applications where versatility in consumption methods and custom dosing are prioritized.

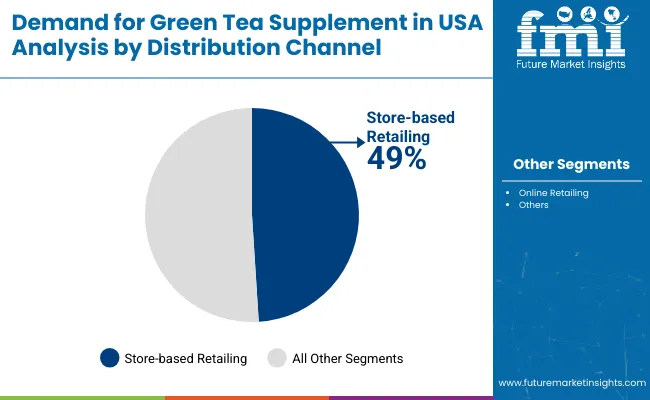
By distribution channel, store-based retail will continue to drive the highest demand, with a 49% share in 2025, supported by established consumer shopping habits, product visibility and accessibility, and the ability for consumers to examine products before purchase physically. Online retail channels are also experiencing robust growth, driven by convenience shopping trends and expanding e-commerce penetration in the supplement category.

Consumer adoption is particularly concentrated among health-conscious individuals, fitness enthusiasts, and those seeking natural weight management solutions, with increased availability of premium and standardized extract formulations further supporting market expansion. Product innovation, format diversification, and strategic partnerships between manufacturers and retail chains are expected to accelerate adoption.
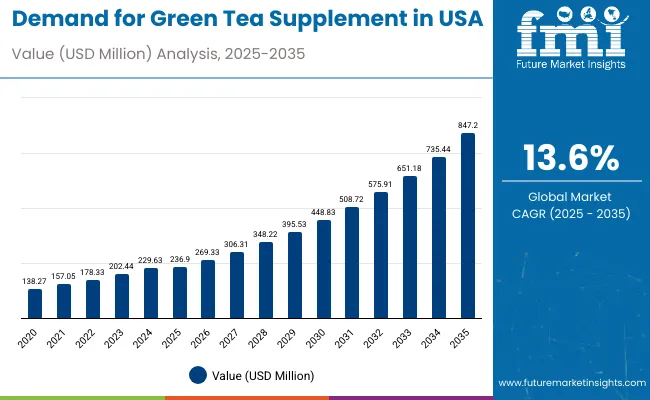
United States Green Tea Supplement Market Value Analysis

Quick Stats

  • Green Tea Supplement Sales in USA Value (2025): USD 236.9 million
  • Green Tea Supplement Sales in USA Forecast Value (2035): USD 847.2 million
  • Green Tea Supplement Sales in USA Forecast CAGR (2025 to 2035): 13.6%
  • Leading Segment in USA Green Tea Supplement Category by Distribution Channel (2025): Store-Based Retail (49% share)
  • Fastest Growing Regions for Green Tea Supplement in USA: California, Texas, New York
  • Key Players in Green Tea Supplement Sales in USA: Klaire Labs, Abbott Laboratories, Nestlé SA (Boost), NOW Health Group Inc., GNC Holdings Inc., InVite Health, Pure Encapsulations LLC, Country Life LLC, Organika Health Products, Nature’s Bounty, Evlution Nutrition, NutraBio Labs Inc., Nutraceutical International Corporation, Life Extension, Threshold® Enterprises Ltd. (Source Naturals), Puritan's Pride, DaVinci Laboratories of Vermont

United States Green Tea Supplement Market

Metric Value
Estimated Size (2025E) USD 236.9 million
Projected Value (2035F) USD 847.2 million
CAGR (2025 to 2035) 13.6%

Segmental Analysis

The green tea supplement in the USA is classified into multiple categories. By form, it includes capsule, liquid, tablet, and powder. Based on distribution channel, it comprises store-based retailing (grocery stores, mass merchandise and supercenters, club stores, convenience stores, health and wellness stores, drug stores and pharmacies, and other retailers (dollar stores, forecourt retailers) and online retailing (company website and gross merchandise value platforms).
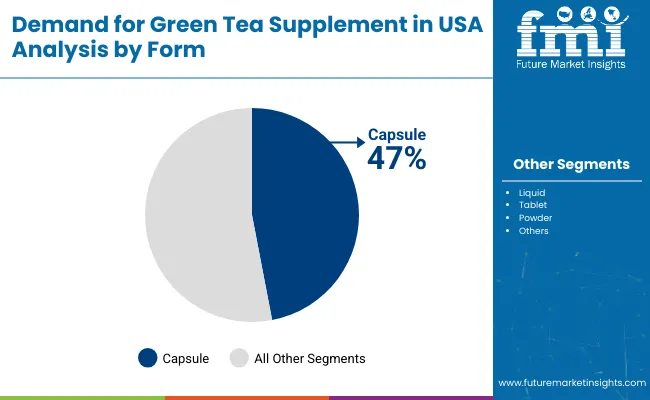
By Form, Capsule Accounts for 47% of the Share

United States Green Tea Supplement Market By Form

Capsule green tea supplements are projected to dominate with a 47% value share in 2025, driven by consumer preference for convenience, precise dosage control, and neutral taste profile. Other forms, including tablets, powders, and liquids, serve specific consumer needs but represent smaller market shares.
  • Capsules are expected to hold a 47% value share in 2025, supported by their convenience factor, measured dosage accuracy, neutral taste that appeals to sensitive consumers, and extended shelf life compared to liquid alternatives.
  • Powder and liquid formats continue to serve niche applications, particularly where versatility in consumption methods, custom dosing flexibility, and integration into beverages or foods are prioritized over convenience.
  • The preference for capsule formats is reinforced by consumer trends favoring portability for busy lifestyles, regulatory clarity in labeling, and suitability for fitness communities and working professionals who value ease of use.

By Distribution Channel, Store-based Retailing Accounts for 49% Share

United States Green Tea Supplement Market By Distribution Channel

Store-based retailing is projected to account for the largest share at 49% in 2025, driven by consumer preference for product authenticity verification, in-person expert consultation, and physical product inspection before purchase. Online retail represents a growing segment, while specialty health stores continue to serve dedicated wellness consumers.

  • Store-based retailing is expected to hold a 49% value share in 2025, supported by consumer trust in product authenticity, availability of expert supplement advice from pharmacists and health store staff, and preference for visual inspection of packaging and labeling.
  • Online retail channels are gaining significant traction as e-commerce adoption increases and consumers appreciate the convenience of home delivery, broader product selection, and competitive pricing.
  • Physical retail locations remain preferred for first-time buyers and occasional users who benefit from in-store promotions, product sampling opportunities, and immediate gratification of purchase decisions.

Consumer Profile Analysis: Wellness-Oriented and Health-Conscious Consumers Drive Market Growth

The green tea supplement category in the USA attracts a diverse range of health-conscious, wellness-focused, and preventive healthcare consumers seeking natural alternatives that support metabolic health, antioxidant protection, and weight management goals. While motivations range from fitness enhancement to disease prevention to natural wellness support, demand is concentrated among several key consumer segments. Each segment demonstrates distinct adoption behaviors, product preferences, and purchasing considerations.

Health-conscious millennials and Gen Z consumers represent the largest consumer base, prioritizing natural ingredients, standardized extracts, and scientifically-backed formulations. These consumers actively seek plant-based supplements to support wellness goals, boost antioxidant intake, and align with perceived health benefits of natural preventive healthcare approaches.

Fitness enthusiasts and weight management seekers show consistent demand for reliable, effective supplements that provide metabolic support and energy enhancement. Their purchasing decisions are influenced by ingredient potency, third-party testing certifications, and proven efficacy in supporting fitness and weight management goals.

Aging adults and preventive healthcare consumers increasingly choose green tea supplements to support cardiovascular health, cognitive function, and antioxidant protection. Their adoption is driven by scientific research awareness, doctor recommendations, and proactive approaches to maintaining long-term health and vitality.

Busy professionals and lifestyle-focused consumers, including those seeking convenient wellness solutions, adopt standardized green tea supplements that fit seamlessly into daily routines without requiring tea preparation time. These consumers often prioritize convenience, consistent dosing, and portable formats that support active lifestyles.

Collectively, these segments drive demand for green tea supplements in the USA, with adoption patterns shaped by health considerations, scientific validation, convenience preferences, and wellness lifestyle integration.
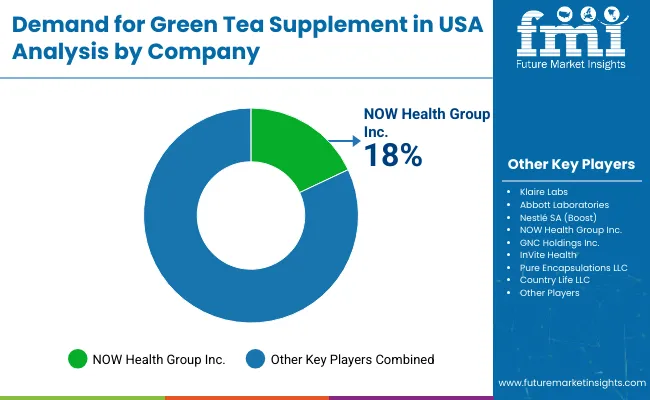
Notable Players and Strategies in USA Green Tea Supplements

United States Green Tea Supplement Market By Company

The competitive environment in the USA green tea supplement sector is characterized by a mix of established nutraceutical companies and specialized wellness brands. Innovation in standardized extracts, bioavailability, and formulation purity, rather than traditional supplement manufacturing alone, remains the decisive success factor: the top suppliers collectively serve millions of health-conscious consumers across retail and online channels nationwide and account for the majority of market distribution.

InVite Health is among the most prominent players, leveraging its clinical-grade formulations and extensive healthcare practitioner network. The company focuses on potency standardization, third-party testing, and strategic positioning to capture both fitness enthusiasts and preventive healthcare consumers seeking high-quality green tea extract supplements.

Pure Encapsulations, LLC and NOW Health Group provide comprehensive supplement portfolios with strong quality positioning and research-backed product offerings. Their strategies emphasize clean-label formulations, hypoallergenic options, and targeted expansion into both retail pharmacy and specialty health channels through standardized EGCG content and functional benefits.

Country Life, LLC leverages its natural supplement expertise alongside targeted marketing to wellness-focused and organic consumers, focusing on certified organic products and strategic partnerships with health food stores and naturopathic practitioners.

The next tier includes Source Naturals, Nature's Way, Jarrow Formulas, Life Extension, Swanson Health, Solgar, Garden of Life, and Nature Made. These companies focus on specialized formulations, competitive positioning, and diverse market segments, often offering standardized extracts, combination formulas, or value-oriented green tea supplement solutions.

Innovation and strategic partnerships are expected to continue, as expertise in extract standardization, bioavailability enhancement, and sustainable sourcing becomes increasingly critical for sustaining consumer trust and expanding presence across pharmacy, health store, and e-commerce sectors in the USA.

Scope of Report in USA’s Green Tea Supplement Space

Items Value
Quantitative Units (2025) USD 236.9 million
Form Capsule, Liquid, Tablet, Powder
Distribution Channel Store-based Retailing (Grocery Store, Supercenters, Club Store, Convenience Store, Health & Wellness Stores, Drug Stores, Other Retailers), Online Retailing (Company Website, Gross Merchandiser)
Count ry Covered United States
Key Companies Profiled Klaire Labs, Abbott Laboratories, Nestlé SA (Boost), NOW Health Group Inc., GNC Holdings Inc., InVite Health, Pure Encapsulations LLC, Country Life LLC, Organika Health Products, Nature’s Bounty, Evlution Nutrition, NutraBio Labs Inc., Nutraceutical International Corporation, Life Extension, Threshold® Enterprises Ltd. (Source Naturals), Puritan's Pride, DaVinci Laboratories of Vermont
Additional Attributes Dollar sales by form and distribution channel; regional demand trends; competitive landscape; consumer preference for natural versus synthetic supplements; sustainable sourcing integration; innovations in extraction and formulation technologies; and regulatory quality standardization

Key Segmentation

By Form:

  • Capsule
  • Liquid
  • Tablet
  • Powder

By Distribution Channel:

  • Store-Based Retailing
    • Grocery Store
    • Mass Merchandise and Supercentres
    • Club Store
    • Convenience Store
    • Health and Wellness Stores
    • Drug Stores and Pharmacies
    • Other Retailers (Dollar Stores, Forecourt retailers)
  • Online Retailing
    • Company Website
    • Gross Merchandiser

Frequently Asked Questions

How big is the United States green tea supplement market in 2025?

The global United States green tea supplement market is estimated to be valued at USD 236.9 billion in 2025.

What will be the size of United States green tea supplement market in 2035?

The market size for the United States green tea supplement market is projected to reach USD 803.9 billion by 2035.

How much will be the United States green tea supplement market growth between 2025 and 2035?

The United States green tea supplement market is expected to grow at a 13.0% CAGR between 2025 and 2035.

What are the key product types in the United States green tea supplement market?

The key product types in United States green tea supplement market are capsule, liquid, tablet and powder.

Which distribution channel segment to contribute significant share in the United States green tea supplement market in 2025?

In terms of distribution channel, store-based retailing segment to command 42.7% share in the United States green tea supplement market in 2025.

Table of Content

  1. Executive Summary
    • Global Market Outlook
    • Demand-side Trends
    • Supply-side Trends
    • Technology Roadmap Analysis
    • Analysis and Recommendations
  2. Market Overview
    • Market Coverage / Taxonomy
    • Market Definition / Scope / Limitations
  3. Market Background
    • Market Dynamics
      • Drivers
      • Restraints
      • Opportunity
      • Trends
    • Scenario Forecast
      • Demand in Optimistic Scenario
      • Demand in Likely Scenario
      • Demand in Conservative Scenario
    • Opportunity Map Analysis
    • Product Life Cycle Analysis
    • Supply Chain Analysis
    • Investment Feasibility Matrix
    • Value Chain Analysis
    • PESTLE and Porter’s Analysis
    • Regulatory Landscape
    • Regional Parent Market Outlook
    • Production and Consumption Statistics
    • Import and Export Statistics
  4. Global Market Analysis 2020 to 2024 and Forecast, 2025 to 2035
    • Historical Market Size Value (USD Million) Analysis, 2020 to 2024
    • Current and Future Market Size Value (USD Million) Projections, 2025 to 2035
      • Y-o-Y Growth Trend Analysis
      • Absolute $ Opportunity Analysis
  5. Global Market Pricing Analysis 2020 to 2024 and Forecast 2025 to 2035
  6. Global Market Analysis 2020 to 2024 and Forecast 2025 to 2035, By Form
    • Introduction / Key Findings
    • Historical Market Size Value (USD Million) Analysis By Form , 2020 to 2024
    • Current and Future Market Size Value (USD Million) Analysis and Forecast By Form , 2025 to 2035
      • Capsule
      • Liquid
      • Tablet
      • Powder
    • Y-o-Y Growth Trend Analysis By Form , 2020 to 2024
    • Absolute $ Opportunity Analysis By Form , 2025 to 2035
  7. Global Market Analysis 2020 to 2024 and Forecast 2025 to 2035, By Distribution Channel
    • Introduction / Key Findings
    • Historical Market Size Value (USD Million) Analysis By Distribution Channel, 2020 to 2024
    • Current and Future Market Size Value (USD Million) Analysis and Forecast By Distribution Channel, 2025 to 2035
      • Store-Based Retailing
        • Grocery Store
        • Mass Merchandise And Supercentres
        • Club Store
        • Convenience Store
        • Health And Wellness Stores
        • Drug Stores And Pharmacies
        • Other Retailers (Dollar Stores, Forecourt Retailers)
      • Online Retailing
        • Company Website
        • Gross Merchandiser
    • Y-o-Y Growth Trend Analysis By Distribution Channel, 2020 to 2024
    • Absolute $ Opportunity Analysis By Distribution Channel, 2025 to 2035
  8. Global Market Analysis 2020 to 2024 and Forecast 2025 to 2035, By Region
    • Introduction
    • Historical Market Size Value (USD Million) Analysis By Region, 2020 to 2024
    • Current Market Size Value (USD Million) Analysis and Forecast By Region, 2025 to 2035
      • North America
      • Latin America
      • Western Europe
      • Eastern Europe
      • East Asia
      • South Asia and Pacific
      • Middle East & Africa
    • Market Attractiveness Analysis By Region
  9. North America Market Analysis 2020 to 2024 and Forecast 2025 to 2035, By Country
    • Historical Market Size Value (USD Million) Trend Analysis By Market Taxonomy, 2020 to 2024
    • Market Size Value (USD Million) Forecast By Market Taxonomy, 2025 to 2035
      • By Country
        • USA
        • Canada
        • Mexico
      • By Form
      • By Distribution Channel
    • Market Attractiveness Analysis
      • By Country
      • By Form
      • By Distribution Channel
    • Key Takeaways
  10. Latin America Market Analysis 2020 to 2024 and Forecast 2025 to 2035, By Country
    • Historical Market Size Value (USD Million) Trend Analysis By Market Taxonomy, 2020 to 2024
    • Market Size Value (USD Million) Forecast By Market Taxonomy, 2025 to 2035
      • By Country
        • Brazil
        • Chile
        • Rest of Latin America
      • By Form
      • By Distribution Channel
    • Market Attractiveness Analysis
      • By Country
      • By Form
      • By Distribution Channel
    • Key Takeaways
  11. Western Europe Market Analysis 2020 to 2024 and Forecast 2025 to 2035, By Country
    • Historical Market Size Value (USD Million) Trend Analysis By Market Taxonomy, 2020 to 2024
    • Market Size Value (USD Million) Forecast By Market Taxonomy, 2025 to 2035
      • By Country
        • Germany
        • UK
        • Italy
        • Spain
        • France
        • Nordic
        • BENELUX
        • Rest of Western Europe
      • By Form
      • By Distribution Channel
    • Market Attractiveness Analysis
      • By Country
      • By Form
      • By Distribution Channel
    • Key Takeaways
  12. Eastern Europe Market Analysis 2020 to 2024 and Forecast 2025 to 2035, By Country
    • Historical Market Size Value (USD Million) Trend Analysis By Market Taxonomy, 2020 to 2024
    • Market Size Value (USD Million) Forecast By Market Taxonomy, 2025 to 2035
      • By Country
        • Russia
        • Poland
        • Hungary
        • Balkan & Baltic
        • Rest of Eastern Europe
      • By Form
      • By Distribution Channel
    • Market Attractiveness Analysis
      • By Country
      • By Form
      • By Distribution Channel
    • Key Takeaways
  13. East Asia Market Analysis 2020 to 2024 and Forecast 2025 to 2035, By Country
    • Historical Market Size Value (USD Million) Trend Analysis By Market Taxonomy, 2020 to 2024
    • Market Size Value (USD Million) Forecast By Market Taxonomy, 2025 to 2035
      • By Country
        • China
        • Japan
        • South Korea
      • By Form
      • By Distribution Channel
    • Market Attractiveness Analysis
      • By Country
      • By Form
      • By Distribution Channel
    • Key Takeaways
  14. South Asia and Pacific Market Analysis 2020 to 2024 and Forecast 2025 to 2035, By Country
    • Historical Market Size Value (USD Million) Trend Analysis By Market Taxonomy, 2020 to 2024
    • Market Size Value (USD Million) Forecast By Market Taxonomy, 2025 to 2035
      • By Country
        • India
        • ASEAN
        • Australia & New Zealand
        • Rest of South Asia and Pacific
      • By Form
      • By Distribution Channel
    • Market Attractiveness Analysis
      • By Country
      • By Form
      • By Distribution Channel
    • Key Takeaways
  15. Middle East & Africa Market Analysis 2020 to 2024 and Forecast 2025 to 2035, By Country
    • Historical Market Size Value (USD Million) Trend Analysis By Market Taxonomy, 2020 to 2024
    • Market Size Value (USD Million) Forecast By Market Taxonomy, 2025 to 2035
      • By Country
        • Kingdom of Saudi Arabia
        • Other GCC Countries
        • Turkiye
        • South Africa
        • Other African Union
        • Rest of Middle East & Africa
      • By Form
      • By Distribution Channel
    • Market Attractiveness Analysis
      • By Country
      • By Form
      • By Distribution Channel
    • Key Takeaways
  16. Key Countries Market Analysis
    • USA
      • Pricing Analysis
      • Market Share Analysis, 2024
        • By Form
        • By Distribution Channel
    • Canada
      • Pricing Analysis
      • Market Share Analysis, 2024
        • By Form
        • By Distribution Channel
    • Mexico
      • Pricing Analysis
      • Market Share Analysis, 2024
        • By Form
        • By Distribution Channel
    • Brazil
      • Pricing Analysis
      • Market Share Analysis, 2024
        • By Form
        • By Distribution Channel
    • Chile
      • Pricing Analysis
      • Market Share Analysis, 2024
        • By Form
        • By Distribution Channel
    • Germany
      • Pricing Analysis
      • Market Share Analysis, 2024
        • By Form
        • By Distribution Channel
    • UK
      • Pricing Analysis
      • Market Share Analysis, 2024
        • By Form
        • By Distribution Channel
    • Italy
      • Pricing Analysis
      • Market Share Analysis, 2024
        • By Form
        • By Distribution Channel
    • Spain
      • Pricing Analysis
      • Market Share Analysis, 2024
        • By Form
        • By Distribution Channel
    • France
      • Pricing Analysis
      • Market Share Analysis, 2024
        • By Form
        • By Distribution Channel
    • India
      • Pricing Analysis
      • Market Share Analysis, 2024
        • By Form
        • By Distribution Channel
    • ASEAN
      • Pricing Analysis
      • Market Share Analysis, 2024
        • By Form
        • By Distribution Channel
    • Australia & New Zealand
      • Pricing Analysis
      • Market Share Analysis, 2024
        • By Form
        • By Distribution Channel
    • China
      • Pricing Analysis
      • Market Share Analysis, 2024
        • By Form
        • By Distribution Channel
    • Japan
      • Pricing Analysis
      • Market Share Analysis, 2024
        • By Form
        • By Distribution Channel
    • South Korea
      • Pricing Analysis
      • Market Share Analysis, 2024
        • By Form
        • By Distribution Channel
    • Russia
      • Pricing Analysis
      • Market Share Analysis, 2024
        • By Form
        • By Distribution Channel
    • Poland
      • Pricing Analysis
      • Market Share Analysis, 2024
        • By Form
        • By Distribution Channel
    • Hungary
      • Pricing Analysis
      • Market Share Analysis, 2024
        • By Form
        • By Distribution Channel
    • Kingdom of Saudi Arabia
      • Pricing Analysis
      • Market Share Analysis, 2024
        • By Form
        • By Distribution Channel
    • Turkiye
      • Pricing Analysis
      • Market Share Analysis, 2024
        • By Form
        • By Distribution Channel
    • South Africa
      • Pricing Analysis
      • Market Share Analysis, 2024
        • By Form
        • By Distribution Channel
  17. Market Structure Analysis
    • Competition Dashboard
    • Competition Benchmarking
    • Market Share Analysis of Top Players
      • By Regional
      • By Form
      • By Distribution Channel
  18. Competition Analysis
    • Competition Deep Dive
      • Klaire Labs
        • Overview
        • Product Portfolio
        • Profitability by Market Segments (Product/Age /Sales Channel/Region)
        • Sales Footprint
        • Strategy Overview
          • Marketing Strategy
          • Product Strategy
          • Channel Strategy
      • Abbott Laboratories
      • Nestlé SA (Boost)
      • NOW Health Group Inc.
      • GNC Holdings Inc.
      • InVite Health
      • Pure Encapsulations LLC
      • Country Life LLC
      • Organika Health Products
      • Nature’s Bounty
      • Evlution Nutrition
      • NutraBio Labs Inc.
      • Nutraceutical International Corporation
      • Life Extension
      • Threshold® Enterprises Ltd. (Source Naturals)
      • Puritan's Pride
      • DaVinci Laboratories of Vermont
  19. Assumptions & Acronyms Used
  20. Research Methodology

List of Tables

  • Table 1: Global Market Value (USD Million) Forecast by Region, 2020-2035
  • Table 2: Global Market Value (USD Million) Forecast by Form , 2020-2035
  • Table 3: Global Market Value (USD Million) Forecast by Distribution Channel, 2020-2035
  • Table 4: North America Market Value (USD Million) Forecast by Country, 2020-2035
  • Table 5: North America Market Value (USD Million) Forecast by Form , 2020-2035
  • Table 6: North America Market Value (USD Million) Forecast by Distribution Channel, 2020-2035
  • Table 7: Latin America Market Value (USD Million) Forecast by Country, 2020-2035
  • Table 8: Latin America Market Value (USD Million) Forecast by Form , 2020-2035
  • Table 9: Latin America Market Value (USD Million) Forecast by Distribution Channel, 2020-2035
  • Table 10: Western Europe Market Value (USD Million) Forecast by Country, 2020-2035
  • Table 11: Western Europe Market Value (USD Million) Forecast by Form , 2020-2035
  • Table 12: Western Europe Market Value (USD Million) Forecast by Distribution Channel, 2020-2035
  • Table 13: Eastern Europe Market Value (USD Million) Forecast by Country, 2020-2035
  • Table 14: Eastern Europe Market Value (USD Million) Forecast by Form , 2020-2035
  • Table 15: Eastern Europe Market Value (USD Million) Forecast by Distribution Channel, 2020-2035
  • Table 16: East Asia Market Value (USD Million) Forecast by Country, 2020-2035
  • Table 17: East Asia Market Value (USD Million) Forecast by Form , 2020-2035
  • Table 18: East Asia Market Value (USD Million) Forecast by Distribution Channel, 2020-2035
  • Table 19: South Asia and Pacific Market Value (USD Million) Forecast by Country, 2020-2035
  • Table 20: South Asia and Pacific Market Value (USD Million) Forecast by Form , 2020-2035
  • Table 21: South Asia and Pacific Market Value (USD Million) Forecast by Distribution Channel, 2020-2035
  • Table 22: Middle East & Africa Market Value (USD Million) Forecast by Country, 2020-2035
  • Table 23: Middle East & Africa Market Value (USD Million) Forecast by Form , 2020-2035
  • Table 24: Middle East & Africa Market Value (USD Million) Forecast by Distribution Channel, 2020-2035

List of Figures

  • Figure 1: Global Market Pricing Analysis
  • Figure 2: Global Market Value (USD Million) Forecast 2020-2035
  • Figure 3: Global Market Value Share and BPS Analysis by Form , 2025 and 2035
  • Figure 4: Global Market Y-o-Y Growth Comparison by Form , 2025-2035
  • Figure 5: Global Market Attractiveness Analysis by Form
  • Figure 6: Global Market Value Share and BPS Analysis by Distribution Channel, 2025 and 2035
  • Figure 7: Global Market Y-o-Y Growth Comparison by Distribution Channel, 2025-2035
  • Figure 8: Global Market Attractiveness Analysis by Distribution Channel
  • Figure 9: Global Market Value (USD Million) Share and BPS Analysis by Region, 2025 and 2035
  • Figure 10: Global Market Y-o-Y Growth Comparison by Region, 2025-2035
  • Figure 11: Global Market Attractiveness Analysis by Region
  • Figure 12: North America Market Incremental Dollar Opportunity, 2025-2035
  • Figure 13: Latin America Market Incremental Dollar Opportunity, 2025-2035
  • Figure 14: Western Europe Market Incremental Dollar Opportunity, 2025-2035
  • Figure 15: Eastern Europe Market Incremental Dollar Opportunity, 2025-2035
  • Figure 16: East Asia Market Incremental Dollar Opportunity, 2025-2035
  • Figure 17: South Asia and Pacific Market Incremental Dollar Opportunity, 2025-2035
  • Figure 18: Middle East & Africa Market Incremental Dollar Opportunity, 2025-2035
  • Figure 19: North America Market Value Share and BPS Analysis by Country, 2025 and 2035
  • Figure 20: North America Market Value Share and BPS Analysis by Form , 2025 and 2035
  • Figure 21: North America Market Y-o-Y Growth Comparison by Form , 2025-2035
  • Figure 22: North America Market Attractiveness Analysis by Form
  • Figure 23: North America Market Value Share and BPS Analysis by Distribution Channel, 2025 and 2035
  • Figure 24: North America Market Y-o-Y Growth Comparison by Distribution Channel, 2025-2035
  • Figure 25: North America Market Attractiveness Analysis by Distribution Channel
  • Figure 26: Latin America Market Value Share and BPS Analysis by Country, 2025 and 2035
  • Figure 27: Latin America Market Value Share and BPS Analysis by Form , 2025 and 2035
  • Figure 28: Latin America Market Y-o-Y Growth Comparison by Form , 2025-2035
  • Figure 29: Latin America Market Attractiveness Analysis by Form
  • Figure 30: Latin America Market Value Share and BPS Analysis by Distribution Channel, 2025 and 2035
  • Figure 31: Latin America Market Y-o-Y Growth Comparison by Distribution Channel, 2025-2035
  • Figure 32: Latin America Market Attractiveness Analysis by Distribution Channel
  • Figure 33: Western Europe Market Value Share and BPS Analysis by Country, 2025 and 2035
  • Figure 34: Western Europe Market Value Share and BPS Analysis by Form , 2025 and 2035
  • Figure 35: Western Europe Market Y-o-Y Growth Comparison by Form , 2025-2035
  • Figure 36: Western Europe Market Attractiveness Analysis by Form
  • Figure 37: Western Europe Market Value Share and BPS Analysis by Distribution Channel, 2025 and 2035
  • Figure 38: Western Europe Market Y-o-Y Growth Comparison by Distribution Channel, 2025-2035
  • Figure 39: Western Europe Market Attractiveness Analysis by Distribution Channel
  • Figure 40: Eastern Europe Market Value Share and BPS Analysis by Country, 2025 and 2035
  • Figure 41: Eastern Europe Market Value Share and BPS Analysis by Form , 2025 and 2035
  • Figure 42: Eastern Europe Market Y-o-Y Growth Comparison by Form , 2025-2035
  • Figure 43: Eastern Europe Market Attractiveness Analysis by Form
  • Figure 44: Eastern Europe Market Value Share and BPS Analysis by Distribution Channel, 2025 and 2035
  • Figure 45: Eastern Europe Market Y-o-Y Growth Comparison by Distribution Channel, 2025-2035
  • Figure 46: Eastern Europe Market Attractiveness Analysis by Distribution Channel
  • Figure 47: East Asia Market Value Share and BPS Analysis by Country, 2025 and 2035
  • Figure 48: East Asia Market Value Share and BPS Analysis by Form , 2025 and 2035
  • Figure 49: East Asia Market Y-o-Y Growth Comparison by Form , 2025-2035
  • Figure 50: East Asia Market Attractiveness Analysis by Form
  • Figure 51: East Asia Market Value Share and BPS Analysis by Distribution Channel, 2025 and 2035
  • Figure 52: East Asia Market Y-o-Y Growth Comparison by Distribution Channel, 2025-2035
  • Figure 53: East Asia Market Attractiveness Analysis by Distribution Channel
  • Figure 54: South Asia and Pacific Market Value Share and BPS Analysis by Country, 2025 and 2035
  • Figure 55: South Asia and Pacific Market Value Share and BPS Analysis by Form , 2025 and 2035
  • Figure 56: South Asia and Pacific Market Y-o-Y Growth Comparison by Form , 2025-2035
  • Figure 57: South Asia and Pacific Market Attractiveness Analysis by Form
  • Figure 58: South Asia and Pacific Market Value Share and BPS Analysis by Distribution Channel, 2025 and 2035
  • Figure 59: South Asia and Pacific Market Y-o-Y Growth Comparison by Distribution Channel, 2025-2035
  • Figure 60: South Asia and Pacific Market Attractiveness Analysis by Distribution Channel
  • Figure 61: Middle East & Africa Market Value Share and BPS Analysis by Country, 2025 and 2035
  • Figure 62: Middle East & Africa Market Value Share and BPS Analysis by Form , 2025 and 2035
  • Figure 63: Middle East & Africa Market Y-o-Y Growth Comparison by Form , 2025-2035
  • Figure 64: Middle East & Africa Market Attractiveness Analysis by Form
  • Figure 65: Middle East & Africa Market Value Share and BPS Analysis by Distribution Channel, 2025 and 2035
  • Figure 66: Middle East & Africa Market Y-o-Y Growth Comparison by Distribution Channel, 2025-2035
  • Figure 67: Middle East & Africa Market Attractiveness Analysis by Distribution Channel
  • Figure 68: Global Market - Tier Structure Analysis
  • Figure 69: Global Market - Company Share Analysis
Dashboard
Dashboard
Dashboard
Dashboard
Dashboard
Dashboard

Full Research Suite comprises of:

Market outlook & trends analysis

Market outlook & trends analysis

Interviews & case studies

Interviews & case studies

Strategic recommendations

Strategic recommendations

Vendor profiles & capabilities analysis

Vendor profiles & capabilities analysis

5-year forecasts

5-year forecasts

8 regions and 60+ country-level data splits

8 regions and 60+ country-level data splits

Market segment data splits

Market segment data splits

12 months of continuous data updates

12 months of continuous data updates

DELIVERED AS:

PDF EXCEL ONLINE

Full Research Suite


$3500

$5000

$6500

Buy Report Now
Similar Industry Reports

Similar Industry Reports

United Kingdom Interesterified Fats Market

United Kingdom Interesterified Fats Market Size and Share Forecast Outlook 2025 to 2035

United Kingdom Car Rental Market

United Kingdom Car Rental Market Analysis – Growth, Applications & Outlook 2025–2035

United Kingdom Veneered Panels Market

United Kingdom (UK) Veneered Panels Market Analysis & Insights for 2025 to 2035

United Kingdom Women's Footwear Market

United Kingdom Women's Footwear Market Trends-Growth & Industry Outlook 2025 to 2035

United Kingdom Automotive Turbocharger Market

United Kingdom Automotive Turbocharger Market Outlook – Share, Growth & Forecast 2025–2035

United Kingdom Yeast Market

United Kingdom Yeast Market Analysis – Size, Share & Forecast 2025–2035

United Kingdom Natural Food Color Market

United Kingdom Natural Food Color Market Outlook – Share, Growth & Forecast 2025–2035

United Kingdom Coated Fabrics Market

United Kingdom Coated Fabrics Market Insights – Demand, Size & Industry Trends 2025–2035

United Kingdom Barite Market

United Kingdom Barite Market Analysis – Size, Share & Forecast 2025–2035

United Kingdom Compact Construction Equipment Market

United Kingdom Compact Construction Equipment Market Growth – Trends, Demand & Innovations 2025–2035

United Kingdom Curtain Walling Market

UK Curtain Walling Market Report - Growth, Demand & Forecast 2025 to 2035

United Kingdom Flare Gas Recovery System Market

United Kingdom Flare Gas Recovery System Market Analysis – Size, Share & Forecast 2025–2035

United Kingdom Electric Golf Cart Market

United Kingdom Electric Golf Cart Market Growth – Demand, Trends & Forecast 2025–2035

United Kingdom Magnetic Separator Market

United Kingdom Magnetic Separator Market Analysis – Size, Share & Forecast 2025-2035

United Kingdom River Cruise Market

UK River Cruise Market Analysis - Growth & Forecast 2025 to 2035

United Kingdom Car Rental Market Share Analysis

Competitive Breakdown of the United Kingdom Car Rental Market

United Kingdom Respiratory Inhaler Devices Market

United Kingdom Respiratory Inhaler Devices Market Growth – Demand, Trends & Forecast 2025 to 2035

United Kingdom Generic Injectable Market

United Kingdom Generic Injectable Market Trends – Size, Share & Growth 2025-2035

United Kingdom Zeolite for Detergent Market

United Kingdom Zeolite for Detergent Market Analysis – Growth, Applications & Outlook 2025-2035

United Kingdom Absorbable Tissue Spacer Market

United Kingdom Absorbable Tissue Spacer Market Outlook – Share, Growth & Forecast 2025-2035

Future Market Insights

United States Green Tea Supplement Market

Chat With MaRIA

Chat With

MaRIA

Hi There, I am MaRIA, Your Market Research Intelligence Assistant. How may I help you?