The United States hand holes market is projected to grow from USD 422.4 million in 2025 to approximately USD 637.3 million by 2035, recording an absolute increase of USD 214.9 million over the forecast period. This translates into total growth of 50.9%, with demand forecast to expand at a compound annual growth rate (CAGR) of 4.2% between 2025 and 2035. Overall sales are expected to grow by nearly 1.51X during the same period, supported by accelerating fiber optic cable deployments for FTTH and 5G networks, increasing utility infrastructure undergrounding initiatives, and growing adoption of advanced materials including polymer concrete and fiberglass reinforced plastic across telecommunications and utility applications. The United States continues to demonstrate strong growth potential driven by broadband expansion mandates, grid modernization programs, and storm-resilient infrastructure investments.
Between 2025 and 2030, United States hand holes demand is projected to expand from USD 422.4 million to USD 520.5 million, resulting in a value increase of USD 98.1 million, which represents 45.6% of the total forecast growth for the decade. This phase of growth will be shaped by accelerating FTTH and FTTx fiber deployments under federal broadband initiatives, expanding 5G small-cell backhaul infrastructure requirements, and increasing utility undergrounding projects driven by wildfire mitigation and storm resilience mandates. Growing adoption of polymer concrete and fiberglass materials offering weight advantages and corrosion resistance continues to drive material substitution. Equipment suppliers are expanding production capabilities to address broadband construction timelines and utility grid modernization requirements, with particular emphasis on traffic-rated enclosures for roadway installations.
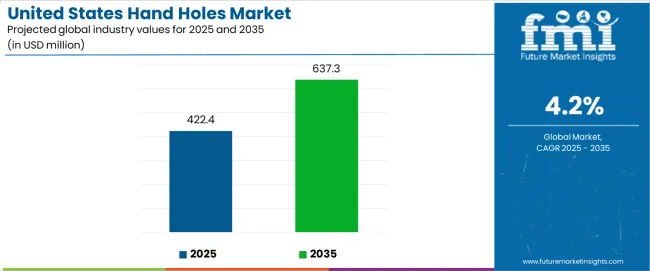
From 2030 to 2035, demand is forecast to grow from USD 520.5 million to USD 637.3 million, adding another USD 116.8 million, which constitutes 54.4% of the overall ten-year expansion. This period is expected to be characterized by maturation of 5G network densification requiring extensive small-cell access points, integration of smart city infrastructure including intelligent street lighting and traffic management systems, and expansion of electric vehicle charging networks requiring underground electrical interconnections. The growing emphasis on IoT-enabled monitoring capabilities, particularly smart lids with GPS tracking and condition sensing, will drive demand for advanced hand hole solutions across telecommunications and utility applications.
Between 2020 and 2025, United States hand holes demand experienced steady expansion, growing from USD 360 million to USD 422.4 million. This growth was driven by accelerating fiber optic deployments supporting remote work infrastructure, continuation of utility grid hardening programs following extreme weather events, and increasing awareness of undergrounding benefits for service reliability. The sector developed as telecommunications operators, electric utilities, and municipalities recognized the need for durable underground access infrastructure supporting increasingly complex cable networks while meeting traffic loading requirements and operational access needs.
| Metric | Value |
|---|---|
| United States Hand Holes Sales Value (2025) | USD 422.4 million |
| United States Hand Holes Forecast Value (2035) | USD 637.3 million |
| United States Hand Holes Forecast CAGR (2025-2035) | 4.2% |
Demand expansion is being supported by the rapid acceleration of fiber optic network deployments nationwide, driven by federal broadband funding initiatives including BEAD (Broadband Equity, Access, and Deployment) program allocations, state-level broadband expansion mandates, and telecommunications operator investments in FTTH infrastructure reaching underserved rural and suburban communities. Modern telecommunications networks rely on extensive underground cable infrastructure requiring regular access points for fiber splicing, network branching, and maintenance operations. Hand holes provide essential access enclosures at intervals along underground cable routes, enabling technicians to perform splicing operations, install network electronics for fiber distribution, and conduct routine maintenance without excavating entire cable runs.
The growing complexity of underground utility infrastructure is creating sustained demand for hand holes across electric utility, telecommunications, transportation, and municipal applications. Electric utilities are investing heavily in grid modernization programs incorporating underground distribution cables, smart grid sensor networks, and distributed energy resource interconnections requiring accessible junction points for equipment installation and maintenance. The convergence of multiple underground systems including fiber optic communications, electric distribution, street lighting controls, traffic signal networks, and emerging smart city applications creates dense underground infrastructure requiring numerous access points within compact geographic areas, particularly in urban and suburban developments.
The United States hand holes sector stands at a transformative period where telecommunications modernization, utility infrastructure hardening, and smart city initiatives converge to drive sustained demand growth. With demand projected to grow from USD 422.4 million in 2025 to USD 637.3 million by 2035—a robust 50.9% increase—the sector is being reshaped by fiber optic network expansion, material innovation, and the pursuit of installation efficiency and lifecycle cost optimization.
The confluence of federal broadband funding, state utility undergrounding mandates (particularly wildfire mitigation programs in California), and 5G network densification requirements creates accelerated deployment timelines and sustained installation volumes. Contractors and utilities managing thousands of underground access points face simultaneous pressures to reduce installation labor costs, improve asset tracking and condition monitoring, and ensure long-term durability in challenging soil conditions and traffic loading environments.
Strategic pathways encompassing advanced material solutions, smart enclosure technologies, application-specific designs, and integrated supply chain services offer substantial margin enhancement opportunities for manufacturers and distributors positioned at the innovation and service frontier.
Pathway A - Lightweight Advanced Material Solutions. Installation labor represents 60-70% of total hand hole deployment costs, creating strong demand for lightweight materials reducing crew size requirements and installation time. Polymer concrete and fiberglass solutions offering 40-60% weight reductions compared to traditional precast concrete while maintaining equivalent strength can command 15-25% price premiums while delivering total installed cost savings. Expected revenue pool: USD 95-145 million.
Pathway B - IoT-Enabled Smart Enclosure Systems. Asset management challenges including locating buried enclosures, monitoring unauthorized access, and tracking environmental conditions drive interest in connected hand hole solutions. Smart lids incorporating GPS tracking, cellular connectivity, tamper detection, and temperature/moisture sensing enable utilities and telecom operators to maintain comprehensive asset inventories and receive real-time security alerts. Premium positioning for integrated monitoring: USD 45-75 million.
Pathway C - Traffic-Rated High-Load Enclosures. Roadway and highway applications require H20 or higher traffic ratings withstanding vehicular loads while providing reliable access for fiber and electrical infrastructure. Specialized designs incorporating reinforced construction, secure locking mechanisms, and anti-skid surfaces address Department of Transportation specifications and safety requirements. Addressable opportunity: USD 80-125 million.
Pathway D - FTTH-Optimized Compact Designs. Residential fiber deployments favor smaller footprint enclosures minimizing excavation requirements, landscape disruption, and material costs while accommodating fiber splicing equipment and slack storage. Right-sized solutions with pre-installed splice trays, cable management features, and simplified installation procedures capture growing FTTH segment. Potential: USD 105-160 million.
Pathway E - Corrosion-Resistant Coastal & Industrial Solutions. Harsh environments including coastal saltwater exposure, industrial chemical exposure, and extreme temperature cycling require non-metallic materials and specialized designs preventing premature degradation. Fiberglass, HDPE, and advanced composite solutions offering superior corrosion resistance command premium pricing in demanding applications. Revenue opportunity: USD 55-90 million.
Pathway F - Integrated Supply & Kitting Services. Contractors value suppliers providing complete installation packages including hand holes, covers, grounding hardware, cable management accessories, and delivery scheduling aligned with construction timelines. Comprehensive supply chain services reducing procurement complexity and job site inventory management create differentiation beyond product specifications. Addressable opportunity: USD 65-105 million.
Pathway G - Renewable Energy Collection Systems. Utility-scale solar and wind installations require extensive underground collection systems with regular access points for cable splicing and equipment interconnection. Deeper enclosures accommodating larger conductor bundles and specialized designs for desert or agricultural environments serve growing renewable energy segment. Expected uplift: USD 50-85 million.
Pathway H - Municipal Smart Infrastructure. Cities implementing intelligent street lighting, adaptive traffic signal systems, environmental sensors, and public WiFi networks require underground infrastructure supporting distributed electronics and network interconnections. Application-specific solutions with power distribution provisions, environmental controls, and security features capture smart city deployments. Potential: USD 70-110 million.
Pathway I - Storm-Resilient Undergrounding Programs. States and utilities implementing overhead-to-underground conversion programs for reliability improvement and wildfire mitigation create concentrated demand for complete underground infrastructure systems. Strategic positioning in program compliance and utility specifications enables participation in multi-year systematic undergrounding initiatives. Revenue opportunity: USD 85-135 million.
Pathway J - Rapid-Deployment Modular Systems. Construction schedule pressures and labor constraints drive interest in pre-assembled hand hole systems with factory-installed accessories, simplified foundation requirements, and reduced field assembly time. Modular solutions enabling installation productivity improvements of 30-50% address contractor pain points while supporting accelerated deployment timelines. Addressable opportunity: USD 60-95 million.
Demand is segmented by material type, hand hole size, application, and end user. By material type, sales are divided into precast concrete, polymer concrete, fiberglass (FRP), HDPE, and advanced composite materials. Based on hand hole size, demand is categorized into rectangular, square, and circular configurations. In terms of application, sales are segmented into fiber optic cables, wire splicing and repair, and other applications including street lighting, traffic signals, and EV/IoT infrastructure. By end user, demand is divided into public utilities and municipalities, telecom operators and ISPs, and EPC contractors/developers.
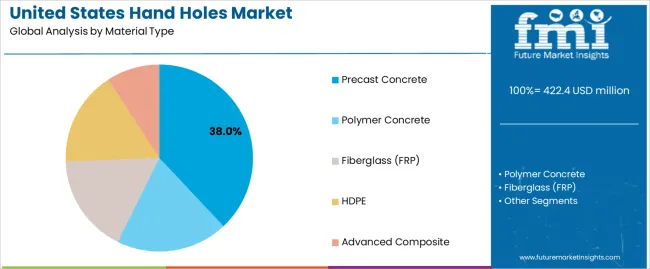
Precast concrete is projected to account for 38% of United States hand holes demand in 2025, making it the leading material type across the sector. This dominance reflects the well-established manufacturing infrastructure, proven long-term durability, and cost-effectiveness of concrete enclosures for standard underground access applications across telecommunications and utility installations.
The segment encompasses H20/traffic-rated enclosures (21% subsegment share) engineered to withstand vehicular loads in roadway and parking area installations where hand holes must support traffic without structural failure, standard duty configurations (10.5%) serving pedestrian areas and landscape installations with lower load requirements, and airport/heavy-duty specifications (6.5%) designed for extreme loading conditions including aircraft ground support areas and industrial facilities with heavy equipment traffic.
Precast concrete hand holes benefit from mature manufacturing processes enabling cost-effective production, extensive distribution networks providing regional availability and reduced freight costs, and contractor familiarity supporting straightforward installation procedures without specialized training requirements. The material's inherent compressive strength makes concrete ideal for traffic-rated applications where enclosures must resist crushing loads while maintaining structural integrity over multi-decade service lives. Manufacturing advances including steel fiber reinforcement, high-performance concrete mixes, and precision molding processes continue improving product consistency and performance characteristics while maintaining competitive pricing compared to alternative materials.
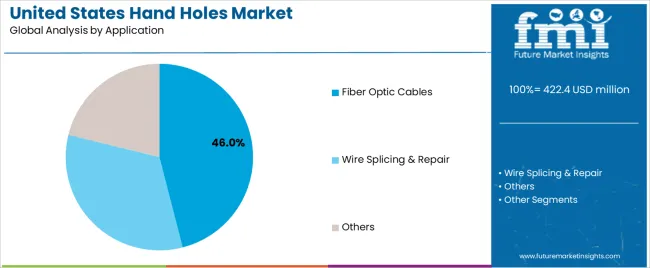
Fiber optic cables represent 46% of United States hand holes demand in 2025, making this application the leading segment driven by accelerating FTTH deployments, 5G network infrastructure expansion, and ongoing fiber backbone capacity upgrades. The segment encompasses FTTH/FTTx installations (28% subsegment share) connecting residential and business premises with fiber infrastructure requiring regular access points for neighborhood distribution and drop cable splicing, 5G small-cell backhaul (10%) providing fiber connectivity to distributed antenna installations supporting wireless network densification, and campus/backbone applications (8%) serving enterprise facilities, institutional networks, and inter-city fiber trunk routes requiring periodic access for network management and maintenance operations.
FTTH deployments represent the highest-growth subsegment as telecommunications providers, municipal fiber networks, and electric utility broadband initiatives extend fiber infrastructure into previously unserved or underserved communities under federal and state funding programs. Each residential fiber installation requires hand holes at intervals typically ranging from 300 to 600 feet depending on terrain and routing, with additional access points at network branch locations where main distribution cables split to serve individual streets or neighborhoods. The density of access point requirements in residential deployments creates substantial hand hole volumes even in moderate-scale FTTH projects covering several hundred homes.
Public utilities and municipalities are projected to account for 41% of United States hand holes demand in 2025, making this end user category the leading segment across the sector. The segment encompasses electric utilities (18% subsegment share) deploying underground distribution infrastructure, grid modernization equipment, and renewable energy interconnections, municipal/DOT entities (13.5%) managing street lighting networks, traffic signal systems, and smart city infrastructure, and transit/rail agencies (9.5%) supporting electrified rail systems, station infrastructure, and transit-oriented development projects.
Electric utilities represent the largest subsegment driver as investor-owned utilities, public power districts, and rural electric cooperatives invest in underground distribution expansion, grid hardening programs converting overhead lines to underground for reliability improvement, and distributed energy resource interconnections supporting solar, storage, and microgrids. Utility specifications favor durability and long-term performance over initial cost optimization, with procurement decisions emphasizing proven materials, traffic ratings appropriate for installation locations, and supplier capability to support multi-year systemwide deployment programs with consistent product availability.
United States hand holes demand is advancing steadily due to accelerating fiber optic network deployments under federal broadband funding, increasing utility infrastructure undergrounding for reliability and wildfire mitigation, and growing adoption of lightweight materials reducing installation costs. However, the sector faces challenges including competitive pricing pressures in standard applications, skilled labor shortages affecting installation productivity, and supply chain complexity for specialized materials and configurations. Smart infrastructure integration and IoT-enabled monitoring capabilities continue to influence product specifications and create differentiation opportunities.
The Infrastructure Investment and Jobs Act allocation of USD 42.5 billion for the Broadband Equity, Access, and Deployment (BEAD) program is fundamentally accelerating fiber optic network expansion into unserved and underserved communities nationwide, with state-level funding allocations driving concentrated deployment activity beginning in 2024-2025 and extending through the decade. BEAD program requirements favoring fiber-to-the-premises solutions over fixed wireless alternatives are directing the majority of funding toward FTTH infrastructure requiring extensive underground cable networks with regular access point intervals for splicing and network distribution equipment. Each state's broadband office is developing deployment plans targeting specific unserved locations, creating visibility into project timelines and geographic concentrations enabling suppliers to position inventory and production capacity aligned with construction schedules.
Electric utilities in wildfire-prone regions, particularly California investor-owned utilities operating under Public Utilities Commission mandates, are implementing systematic overhead-to-underground conversion programs targeting high fire-risk areas where overhead power lines present ignition risks during extreme weather conditions. Pacific Gas & Electric, Southern California Edison, and San Diego Gas & Electric have committed to undergrounding thousands of miles of overhead distribution lines over 10-year programs, with each mile of underground conversion requiring numerous hand holes for cable splicing, equipment interconnection, and network access. California's undergrounding mandates create concentrated regional demand with multi-year visibility as utilities develop detailed implementation plans, secure regulatory cost recovery mechanisms, and establish contractor relationships for systematic deployment. Storm resilience initiatives in Atlantic and Gulf Coast states are driving similar underground conversion programs where hurricanes and severe weather events cause recurring overhead system damage, extended outages, and costly restoration efforts.
| State | CAGR (2025-2035) |
|---|---|
| Texas | 4.5% |
| California | 4.3% |
| Florida | 4.2% |
| New York | 4.1% |
| Illinois | 3.9% |
| Arizona | 3.8% |
| North Carolina | 3.7% |
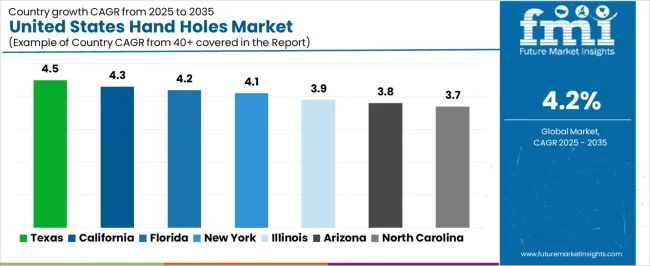
United States hand holes demand demonstrates significant state-level variation in growth patterns, driven by diverse factors including broadband deployment initiatives, utility infrastructure programs, urbanization dynamics, and regulatory requirements. Texas leads growth at 4.5% CAGR through 2035, reflecting massive broadband and grid buildouts serving population expansion, suburban greenfield fiber deployments, and energy corridor infrastructure development. California follows at 4.3% CAGR, driven primarily by utility undergrounding for wildfire mitigation, EV charging infrastructure rollouts, and dense telecom network upgrades. Florida exhibits 4.2% growth supported by storm-resilient undergrounding programs, coastal broadband expansion, and transportation system retrofits.
Demand for hand holes in Texas is projected to grow at 4.5% CAGR through 2035, the highest growth rate nationally, driven by massive broadband expansion serving rapidly growing suburban communities, substantial electric utility grid infrastructure investments supporting population growth and industrial development, and energy corridor infrastructure connecting renewable energy resources to load centers. The state's population expansion, particularly in Dallas-Fort Worth, Houston, Austin, and San Antonio metropolitan areas, creates continuous demand for telecommunications infrastructure buildout in new residential developments and commercial corridors requiring comprehensive fiber optic networks from initial construction phases.
Texas broadband initiatives under state funding programs and federal BEAD allocations target rural communities and suburban areas lacking adequate high-speed connectivity, driving extensive FTTH deployments across geographic areas previously served only by legacy copper infrastructure or lacking wireline connectivity entirely.
Demand for hand holes in California is expanding at a CAGR of 4.3%, driven by utility undergrounding programs mandated for wildfire mitigation in high fire-risk areas, extensive EV charging infrastructure deployments supporting the state's transportation electrification policies, and smart city technology rollouts incorporating intelligent street lighting, traffic management, and environmental monitoring systems. Pacific Gas & Electric, Southern California Edison, and San Diego Gas & Electric are implementing multi-billion dollar undergrounding programs converting overhead power lines to underground infrastructure in elevated fire-risk territories, creating concentrated regional demand for traffic-rated hand holes supporting distribution cable splicing and equipment installation.
California's aggressive EV adoption targets and supporting charging infrastructure requirements create demand for hand holes serving underground electrical distribution to public charging stations, workplace charging facilities, and multi-unit residential charging installations. The state's building codes increasingly mandate EV-ready electrical infrastructure in new construction and major renovations, driving integration of underground distribution networks with regular access points.
Demand for hand holes in Florida is growing at a CAGR of 4.2%, driven by storm-resilient undergrounding initiatives converting vulnerable overhead infrastructure to underground for hurricane protection, coastal broadband expansion serving growing population centers and tourist destinations, and transportation system retrofits incorporating intelligent traffic management and connected vehicle infrastructure. Florida utilities operating in hurricane-prone coastal areas are selectively undergrounding distribution infrastructure in critical service territories where overhead systems experience recurring storm damage and extended outage durations affecting economic activity and public safety.
The state's extensive coastline and high water tables create challenging installation environments requiring corrosion-resistant hand hole materials and designs preventing groundwater infiltration and saltwater exposure damage. Florida's tourism industry and growing retirement population drive continuous telecommunications infrastructure expansion supporting residential broadband, hospitality connectivity requirements, and smart city applications in major metropolitan areas.
Demand for hand holes in New York is projected to grow at 4.1% CAGR through 2035, driven by high-load compact enclosures serving dense urban cores with space constraints and heavy traffic loading, 5G network densification requiring distributed small-cell installations with fiber backhaul infrastructure, and subway/streetscape modernization programs incorporating smart infrastructure and connectivity improvements. New York City's underground infrastructure complexity and limited available space create demand for specialized enclosures with minimal footprints, high traffic ratings, and designs accommodating multiple utility systems in congested subsurface environments.
The state's 5G deployment requirements, particularly in New York City boroughs and upstate urban centers, necessitate fiber backhaul connections to thousands of small-cell antenna installations mounted on street furniture, building facades, and dedicated poles. Each small-cell installation requires fiber connectivity typically delivered through underground cables with hand hole access points enabling fiber routing, splicing, and connection to radio equipment.
Demand for hand holes in Illinois is expanding at a CAGR of 3.9%, driven by freeze-thaw rated installations withstanding extreme temperature cycling and frost heave conditions, campus smart-infrastructure deployments at universities and corporate facilities, and DOT corridor renewals incorporating fiber optic networks and intelligent transportation systems along major highway routes. Illinois's climate with significant seasonal temperature variations and freeze-thaw cycling creates demanding conditions requiring durable materials and designs preventing structural degradation from repeated freezing and expansion stresses.
The state's numerous university campuses and corporate office parks create opportunities for comprehensive underground infrastructure systems supporting distributed fiber networks, smart building systems, and campus-wide connectivity initiatives. Illinois Department of Transportation corridor modernization projects along interstate highways and major state routes incorporate fiber optic networks supporting traffic management, real-time monitoring, and connected vehicle infrastructure, requiring traffic-rated hand holes at regular intervals along controlled-access highway alignments.
Demand for hand holes in Arizona is growing at a CAGR of 3.8%, driven by solar farm collection systems requiring extensive underground cable networks connecting distributed photovoltaic arrays to central inverters and utility interconnection points, desert-rated materials withstanding extreme heat and UV exposure, and fast-growing suburban communities in Phoenix and Tucson metropolitan areas requiring comprehensive telecommunications and utility infrastructure. Arizona's position as a leading solar energy state creates concentrated demand for hand holes serving utility-scale solar installations where underground collection systems require regular access points for cable splicing, equipment interconnection, and maintenance operations.
The state's desert climate with extreme temperature variations, intense UV exposure, and minimal precipitation creates distinct material performance requirements favoring heat-resistant formulations and UV-stable materials preventing degradation from prolonged sun exposure. Arizona's rapid suburban growth, particularly in Phoenix metropolitan area communities, drives continuous infrastructure expansion with telecommunications and utility networks installed concurrently with residential development.
Demand for hand holes in North Carolina is projected to expand at a CAGR of 3.7%, driven by FTTH expansion in Research Triangle region serving growing technology sector and residential development, municipal smart lighting initiatives incorporating networked controls and renewable energy integration, and EV charging grid development supporting transportation electrification in urban and suburban areas. The Research Triangle area encompassing Raleigh, Durham, and Chapel Hill demonstrates strong telecommunications infrastructure investment supporting technology industry growth and residential broadband requirements.
North Carolina municipalities are implementing smart street lighting programs converting traditional fixtures to LED technology with networked controls, occupancy sensing, and renewable energy integration, requiring underground communications infrastructure connecting distributed lighting assets. The state's electric cooperatives and municipal utilities are actively deploying fiber optic networks leveraging utility infrastructure and rights-of-way to provide broadband services in rural communities, creating demand for hand holes supporting fiber distribution networks in areas previously lacking adequate connectivity.
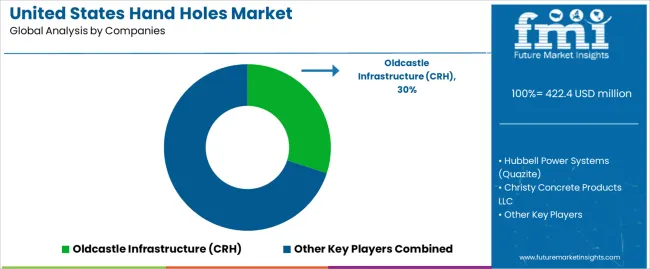
United States hand holes demand is defined by competition among precast concrete manufacturers, polymer composite producers, and specialized underground infrastructure suppliers. Manufacturers are investing in lightweight material development, traffic-rated design certifications, IoT-enabled monitoring capabilities, and comprehensive distribution networks to deliver reliable, cost-effective, and specification-compliant access enclosures across telecommunications and utility applications. Strategic partnerships between hand hole manufacturers and telecommunications contractors, material innovation in polymer formulations and fiber reinforcement systems, and geographic expansion through regional manufacturing facilities are central to strengthening competitive positioning and expanding presence across diverse state and regional specifications.
Oldcastle Infrastructure (CRH), United States-based and the demand leader with approximately 30% share, offers comprehensive underground access solutions including precast concrete hand holes, polymer concrete enclosures, and traffic-rated covers with focus on manufacturing scale, regional distribution capabilities, and utility specification compliance across telecommunications and electric utility applications. Hubbell Power Systems (Quazite brand), operating from the United States with strong telecommunications presence, provides polymer concrete hand holes, lightweight fiber-friendly designs, and ergonomic features with emphasis on FTTH applications and installation efficiency.
Christy Concrete Products operates regional manufacturing facilities producing precast concrete and polymer concrete hand holes with focus on utility specifications and traffic-rated designs serving electric utilities and DOT applications. Armorcast Products Company delivers fiberglass reinforced hand holes and composite enclosures emphasizing corrosion resistance and lightweight performance for coastal and industrial environments. NewBasis offers polymer concrete solutions optimized for telecommunications applications with focus on fiber protection and installation productivity.
| Item | Value |
|---|---|
| Quantitative Units | USD 637.3 million |
| Material Type | Precast concrete (H20/traffic-rated, standard duty, airport/heavy-duty), polymer concrete, fiberglass (FRP), HDPE, advanced composite |
| Hand Hole Size | Rectangular (24×36, 30×48, 36×60), square, circular |
| Application | Fiber optic cables (FTTH/FTTx, 5G small-cell backhaul, campus/backbone), wire splicing and repair, others (street lighting, traffic signals, EV/IoT) |
| End User | Public utilities and municipalities (electric utilities, municipal/DOT, transit/rail agencies), telecom operators and ISPs, EPC/developers (renewables, campuses) |
| States Covered | Texas, California, Florida, New York, Illinois, Arizona, North Carolina |
| Key Companies Profiled | Oldcastle Infrastructure (CRH), Hubbell Power Systems (Quazite), Christy Concrete Products LLC, Armorcast Products Company, NewBasis, Synertech Molded Products, EJ Group Inc., Carson Industries, VALDURA Solutions, Fibrelite (OPW) |
| Additional Attributes | Dollar sales by material type, hand hole size, application segment, and end user category, state-level demand trends across Texas, California, Florida, and other key states, competitive landscape with established precast manufacturers and advanced material innovators, material performance dynamics including weight optimization and corrosion resistance, integration with IoT monitoring and asset tracking systems, innovations in lightweight polymer formulations and traffic-rated composite designs, and adoption of ergonomic installation features, smart lid technologies, and application-specific configurations for enhanced deployment efficiency and lifecycle performance across telecommunications and utility infrastructure |
The global united states hand holes market is estimated to be valued at USD 422.4 million in 2025.
The market size for the united states hand holes market is projected to reach USD 637.3 million by 2035.
The united states hand holes market is expected to grow at a 4.2% CAGR between 2025 and 2035.
The key product types in united states hand holes market are precast concrete, polymer concrete, fiberglass (frp), hdpe and advanced composite.
In terms of application, fiber optic cables segment to command 46.0% share in the united states hand holes market in 2025.


Our Research Products

The "Full Research Suite" delivers actionable market intel, deep dives on markets or technologies, so clients act faster, cut risk, and unlock growth.

The Leaderboard benchmarks and ranks top vendors, classifying them as Established Leaders, Leading Challengers, or Disruptors & Challengers.

Locates where complements amplify value and substitutes erode it, forecasting net impact by horizon

We deliver granular, decision-grade intel: market sizing, 5-year forecasts, pricing, adoption, usage, revenue, and operational KPIs—plus competitor tracking, regulation, and value chains—across 60 countries broadly.

Spot the shifts before they hit your P&L. We track inflection points, adoption curves, pricing moves, and ecosystem plays to show where demand is heading, why it is changing, and what to do next across high-growth markets and disruptive tech

Real-time reads of user behavior. We track shifting priorities, perceptions of today’s and next-gen services, and provider experience, then pace how fast tech moves from trial to adoption, blending buyer, consumer, and channel inputs with social signals (#WhySwitch, #UX).

Partner with our analyst team to build a custom report designed around your business priorities. From analysing market trends to assessing competitors or crafting bespoke datasets, we tailor insights to your needs.
Supplier Intelligence
Discovery & Profiling
Capacity & Footprint
Performance & Risk
Compliance & Governance
Commercial Readiness
Who Supplies Whom
Scorecards & Shortlists
Playbooks & Docs
Category Intelligence
Definition & Scope
Demand & Use Cases
Cost Drivers
Market Structure
Supply Chain Map
Trade & Policy
Operating Norms
Deliverables
Buyer Intelligence
Account Basics
Spend & Scope
Procurement Model
Vendor Requirements
Terms & Policies
Entry Strategy
Pain Points & Triggers
Outputs
Pricing Analysis
Benchmarks
Trends
Should-Cost
Indexation
Landed Cost
Commercial Terms
Deliverables
Brand Analysis
Positioning & Value Prop
Share & Presence
Customer Evidence
Go-to-Market
Digital & Reputation
Compliance & Trust
KPIs & Gaps
Outputs
Full Research Suite comprises of:
Market outlook & trends analysis
Interviews & case studies
Strategic recommendations
Vendor profiles & capabilities analysis
5-year forecasts
8 regions and 60+ country-level data splits
Market segment data splits
12 months of continuous data updates
DELIVERED AS:
PDF EXCEL ONLINE
Merchandising Unit Industry Analysis in United States Size and Share Forecast Outlook 2025 to 2035
United States Walk-in Cooler and Freezer Market Size and Share Forecast Outlook 2025 to 2035
United States Commercial Refrigeration Equipment Market Forecast and Outlook 2025 to 2035
United States Dog Toys Market Size and Share Forecast Outlook 2025 to 2035
United States Biodegradable Cups and Lids Market Size and Share Forecast Outlook 2025 to 2035
United States Green Tea Supplement Market Size and Share Forecast Outlook 2025 to 2035
United States Hispanic Novelties Market Size and Share Forecast Outlook 2025 to 2035
United States Scented Garbage Bags Market Size and Share Forecast Outlook 2025 to 2035
United States and Canada Tray Sealing Machines Market Size and Share Forecast Outlook 2025 to 2035
United States Label Release Liner Market Size and Share Forecast Outlook 2025 to 2035
United States Beetroot Supplement Market Size and Share Forecast Outlook 2025 to 2035
United States Garbage Bags Market Size and Share Forecast Outlook 2025 to 2035
United States Digital Ovulation Test Kits Market Size and Share Forecast Outlook 2025 to 2035
United States Sports Tourism Market Size and Share Forecast Outlook 2025 to 2035
United States of America Digital Pregnancy Test Kits Market Size and Share Forecast Outlook 2025 to 2035
United States and Canada Collision Repair Parts Market Size and Share Forecast Outlook 2025 to 2035
United States & Canada Pest Control Services Market Size and Share Forecast Outlook 2025 to 2035
United States & Canada Collation Shrink Films Market Size and Share Forecast Outlook 2025 to 2035
United States & Canada Aluminum Tubes Market Size and Share Forecast Outlook 2025 to 2035
United States and Canada Child Resistant Bottles Market Size and Share Forecast Outlook 2025 to 2035

Thank you!
You will receive an email from our Business Development Manager. Please be sure to check your SPAM/JUNK folder too.
Chat With
MaRIA