

- Market Size (2026)
- USD 194.86 Bn
- Forecast (2036)
- USD 136.43 Bn
- CAGR (2026 to 2036)
- 12.8%
Tissue Diagnostics Market Size, Market Forecast and Outlook By FMI
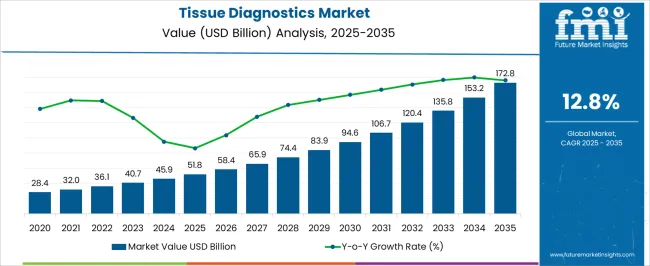
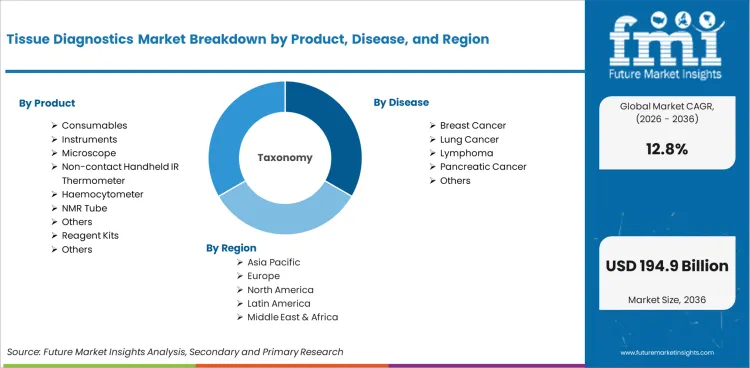
The tissue diagnostics market was valued at USD 51.8 billion in 2025. The market is set to reach USD 58.4 billion by 2026-end and grow at a CAGR of 12.8% between 2026–2036 to reach USD 194.9 billion by 2036. Consumables will dominate with a 21.3% share, while Breast Cancer will lead with a 29.3%% share.
Summary of the Tissue Diagnostics Market
- Demand and Growth Drivers
- Rising global cancer incidence and the shift toward precision oncology are creating sustained demand for tissue diagnostic testing that guides targeted therapy selection and treatment decisions.
- Companion diagnostic requirements for targeted cancer therapies are creating mandatory testing demand that grows proportionally with the approval and adoption of new precision medicine drugs.
- Digital pathology and AI powered image analysis adoption is driving investment in automated tissue diagnostic platforms that improve throughput, consistency, and diagnostic accuracy.
- Product and Segment View
- Consumables are expected to represent a leading share of the product segment in 2026, reflecting the recurring demand for reagents, antibodies, and staining solutions consumed in high volume diagnostic testing.
- Breast cancer is expected to account for 29.3% of the disease segment in 2026, reflecting high screening volumes, multiple companion diagnostic requirements, and established IHC testing protocols.
- Immunohistochemistry (IHC) remains the dominant application technology due to its established role in cancer diagnosis, biomarker detection, and companion diagnostic testing.
- Geography and Competitive Outlook
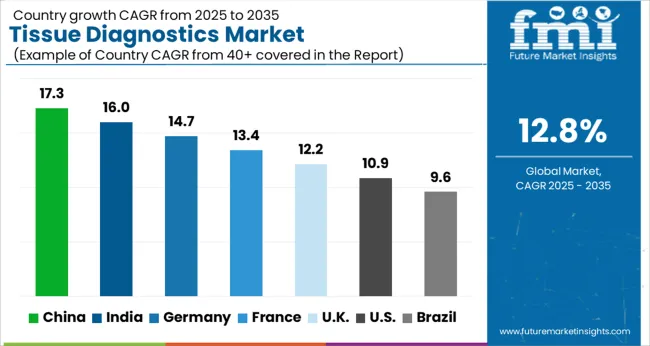
- China is expected to lead growth at 17.3%, reflecting expanding healthcare infrastructure, growing cancer diagnostic capability, and increasing adoption of precision oncology approaches.
- India at 16.0% reflects growing diagnostic laboratory infrastructure, increasing cancer awareness, and expanding access to tissue based diagnostic services.
- Companies combining comprehensive diagnostic portfolios, companion diagnostic partnerships, and digital pathology capability are positioned to capture procurement during the forecast period.
- Analyst Opinion
- The tissue diagnostics market is experiencing accelerated growth driven by the precision oncology revolution, which requires tissue based testing to identify targetable biomarkers for personalized cancer treatment.
- Adoption is shaped by the expanding pipeline of targeted cancer therapies that require companion diagnostic testing as a condition of drug prescription, creating regulatory mandated testing demand.
- Growth at 12.8% CAGR reflects the convergence of rising cancer incidence, precision medicine adoption, companion diagnostic expansion, and healthcare infrastructure investment in emerging markets.
- Companies investing in AI powered digital pathology, expanded companion diagnostic portfolios, and automated staining platforms are positioned to lead market development.
Key Takeaways, Market Size, and Forecast
- The tissue diagnostics market was valued at USD 51 billion in 2025.
- By 2036, the Tissue Diagnostics Market is expected to be worth USD 194.86 billion.
- From 2026 to 2036, the market is projected to expand at a CAGR of 12.8%.
- The market is projected to create an incremental opportunity of USD 136.43 billion between 2026 and 2036.
- In 2026, consumables is expected to account for 21.3% of the product segment, driven by the recurring demand for reagent kits, antibodies, probes, and staining solutions used in high volume tissue testing across hospital pathology laboratories and diagnostic centers.
- China (17.3%) and India (16.0%) are two of the fastest growing markets in the world.
Tissue Diagnostics Market Definition
The tissue diagnostics market covers products, instruments, and consumables used for the examination of tissue samples to diagnose diseases including cancer, infectious diseases, and autoimmune conditions. Key technologies include immunohistochemistry (IHC), in situ hybridization (ISH), and hematoxylin and eosin (H&E) staining used across hospitals, diagnostic laboratories, contract research organizations, and biotechnology companies.
Tissue Diagnostics Market Inclusions
Market scope includes all commercially traded tissue diagnostics products categorized by product (consumables, instruments, microscopes, reagent kits, others), disease (breast cancer, lung cancer, lymphoma, pancreatic cancer, others), application (IHC, ISH, H&E), and end user (hospitals, diagnostic laboratories, CROs, research organizations, biotechnology companies). Revenue coverage spans 2026 to 2036.
Tissue Diagnostics Market Exclusions
The scope does not include liquid biopsy diagnostics, general clinical chemistry analyzers, molecular diagnostics based solely on nucleic acid testing, or radiology imaging equipment.
Tissue Diagnostics Market Research Methodology
- Primary Research: FMI analysts conducted interviews with manufacturers, technology specialists, and procurement professionals across key markets.
- Desk Research: Combined data from industry associations, regulatory bodies, and manufacturer disclosures.
- Market Sizing and Forecasting: Bottom up methodology aggregating segment and regional data with adoption velocity projections.
- Data Validation: Cross checked quarterly against production data, trade statistics, and manufacturer reporting.
Why is the Tissue Diagnostics Market Growing?
- Rising global cancer incidence creates proportional demand for tissue diagnostic testing that supports diagnosis, staging, and treatment selection across oncology care pathways.
- Companion diagnostic mandates for targeted therapies create non-discretionary testing demand that grows with each new precision medicine drug approval.
- Digital pathology and AI integration are transforming tissue diagnostics from manual microscopy to automated, high throughput workflows that improve consistency and diagnostic capacity.
Demand for tissue diagnostics is driven by the global cancer burden and the shift toward precision oncology that requires tissue based biomarker testing for treatment decisions. Every cancer diagnosis involves tissue examination through biopsy or surgical specimens, creating baseline demand that grows with cancer incidence. The expanding role of biomarker testing in guiding targeted therapy selection amplifies testing volumes per patient beyond basic diagnosis.
Companion diagnostics represent the primary structural growth driver. Regulatory agencies require specific tissue diagnostic tests as a condition for prescribing targeted cancer therapies. Each new precision medicine drug approval creates mandatory testing demand for the associated companion diagnostic. The oncology drug pipeline contains hundreds of targeted therapies in clinical development, suggesting sustained growth in companion diagnostic testing requirements.
Digital pathology and AI powered image analysis are reshaping the technology landscape. Traditional tissue diagnostics requires manual microscopy by trained pathologists, creating throughput bottlenecks and inter-observer variability. Digital pathology digitizes tissue slides for computer analysis, while AI algorithms assist pathologists in identifying diagnostic features, quantifying biomarker expression, and detecting patterns. These technologies improve diagnostic consistency, increase throughput, and enable remote consultation.
Market Segmentation Analysis
- Consumables hold a leading product position reflecting recurring demand for reagents and staining solutions in high volume diagnostic testing.
- Breast cancer accounts for 29.3% of the disease segment, driven by established screening programs, multiple companion diagnostic requirements, and high IHC testing volumes.
- IHC remains the dominant application as the primary technology for cancer biomarker detection and companion diagnostic testing.
The tissue diagnostics market segments by product, disease, application, and end user. By product, the market covers consumables, instruments, microscopes, reagent kits, and others. By disease, the market addresses breast, lung, lymphoma, pancreatic cancer, and others.
Insights into the Consumables Product Segment
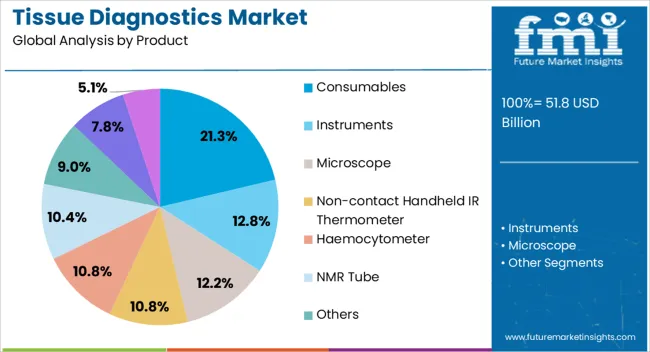
Consumables including reagent kits, antibodies, probes, and staining solutions generate recurring revenue as they are consumed in every tissue diagnostic test performed. This consumption based demand creates predictable revenue streams that grow proportionally with testing volumes. The expansion of companion diagnostic testing and increasing biomarker panel complexity drive per-test consumable consumption higher.
Insights into the Breast Cancer Disease Segment
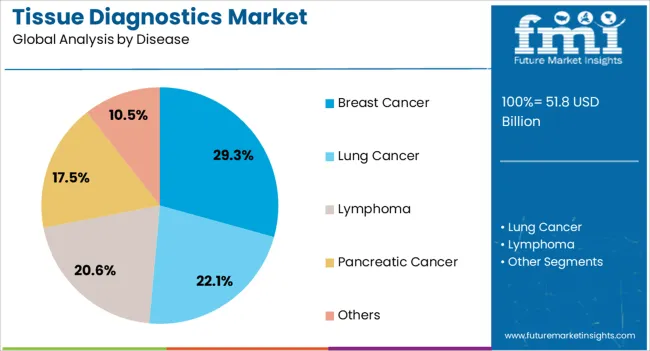
Breast cancer is expected to represent 29.3% of the disease segment in 2026. Established screening programs generate high specimen volumes, while multiple biomarkers (ER, PR, HER2, Ki-67) require IHC testing for every breast cancer diagnosis. Companion diagnostics for targeted therapies including trastuzumab and pertuzumab create mandatory testing that reinforces breast cancer's position as the highest volume tissue diagnostic indication.
Tissue Diagnostics Market Drivers, Restraints, and Opportunities
- Precision oncology expansion and companion diagnostic mandates create structural demand growth that is tied to cancer drug development rather than discretionary healthcare spending.
- Pathologist workforce shortages and laboratory capacity constraints limit testing throughput, creating adoption incentive for automated and AI assisted diagnostic workflows.
- Emerging market healthcare infrastructure expansion creates greenfield demand for tissue diagnostic equipment and consumable supply across new hospital pathology laboratories.
The tissue diagnostics market is expanding at 12.8% CAGR driven by precision oncology, companion diagnostics, and digital pathology adoption. Workforce constraints create automation demand, while emerging market infrastructure provides greenfield growth.
Precision Oncology Expansion
The growing number of targeted cancer therapies requiring biomarker testing creates compounding demand for tissue diagnostics. Each new drug approval with a companion diagnostic requirement adds incremental mandatory testing volume.
Pathologist Workforce Constraints
Global pathologist shortages limit tissue diagnostic throughput using traditional manual microscopy. AI assisted digital pathology addresses this constraint by increasing per-pathologist productivity and enabling remote diagnostic consultation.
Emerging Market Infrastructure
Hospital and diagnostic laboratory construction in China, India, and Southeast Asia creates greenfield demand for tissue diagnostic equipment, automated staining systems, and consumable supply chains.
Digital Pathology Transformation
Transition from manual microscopy to digital slide scanning and AI powered analysis improves diagnostic consistency, enables quantitative biomarker assessment, and creates new data integration capabilities.
Analysis of Tissue Diagnostics Market By Key Countries
.webp "Top Country Growth Comparison Tissue Diagnostics Market Cagr (2026 2036)")
| Country | CAGR |
|---|---|
| China | 17.3% |
| India | 16.0% |
| Germany | 14.7% |
| France | 13.4% |
| UK | 12.2% |
| USA | 10.9% |
| Brazil | 9.6% |
- China leads at 17.3% CAGR through 2036.
- India leads at 16.0% CAGR through 2036.
- Germany leads at 14.7% CAGR through 2036.
- France leads at 13.4% CAGR through 2036.
The global tissue diagnostics market is projected to grow at a CAGR of 12.8% from 2026 to 2036. The analysis covers more than 30 countries, with the leading markets detailed below.
Demand Outlook for Tissue Diagnostics Market in China
China is expected to lead growth at 17.3% through 2036, reflecting healthcare infrastructure expansion, growing cancer diagnostic capability, and precision oncology adoption.
- Healthcare infrastructure expansion creates diagnostic laboratory demand.
- Cancer diagnostic capability growth drives tissue testing volumes.
- Precision oncology adoption creates companion diagnostic requirements.
Future Outlook for Tissue Diagnostics Market in India
India is expected to grow at 16.0% through 2036, supported by diagnostic laboratory growth, cancer awareness programs, and expanding access to tissue based diagnostic services.
- Diagnostic laboratory growth creates tissue testing infrastructure.
- Cancer awareness programs drive earlier diagnosis and testing demand.
- Expanding diagnostic access increases testing volume per capita.
Opportunity Analysis of Tissue Diagnostics Market in Germany
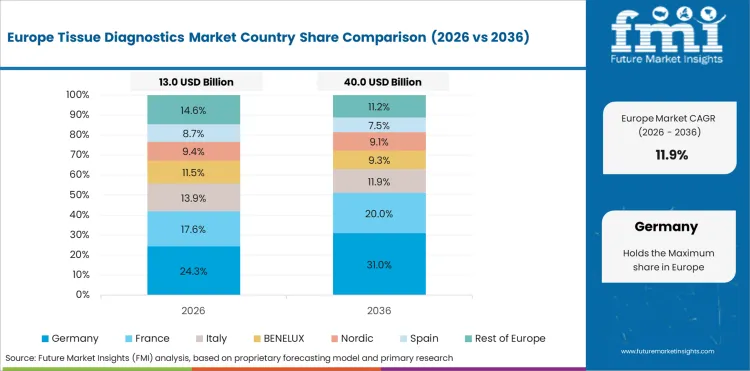
Germany is expected to grow at 14.7% through 2036, driven by its advanced healthcare system, precision medicine leadership, and digital pathology adoption.
- Advanced healthcare system supports comprehensive tissue diagnostic services.
- Precision medicine leadership drives companion diagnostic adoption.
- Digital pathology adoption improves laboratory throughput and capability.
In-depth Analysis of Tissue Diagnostics Market in France
France is expected to grow at 13.4% through 2036, reflecting its healthcare system, oncology research investment, and growing adoption of advanced diagnostic technologies.
- Healthcare system supports comprehensive cancer diagnostic pathways.
- Oncology research investment drives advanced tissue testing capability.
- Technology adoption supports digital pathology and AI integration.
Sales Analysis of Tissue Diagnostics Market in the United States
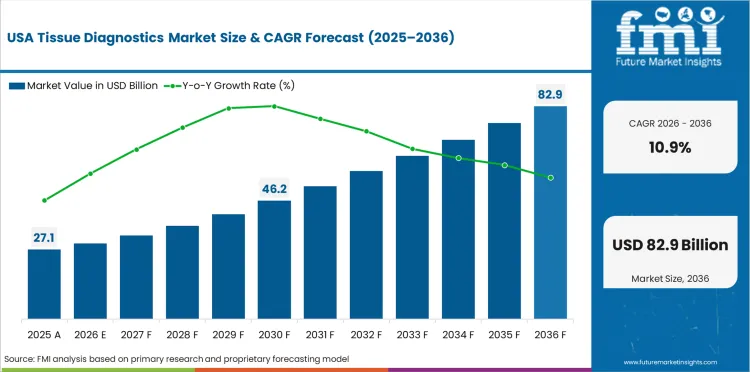
The USA is expected to grow at 10.9% through 2036, reflecting its position as the largest precision oncology market with established tissue diagnostic infrastructure.
- Largest precision oncology market drives companion diagnostic demand.
- Established diagnostic infrastructure supports high testing volumes.
- Digital pathology and AI adoption drive technology investment.
Demand Outlook for Tissue Diagnostics Market in the United Kingdom
The UK is expected to grow at 12.2% through 2036, supported by NHS cancer diagnostic programs, precision medicine investment, and pathology service modernization.
- NHS cancer programs drive tissue diagnostic testing volumes.
- Precision medicine investment supports companion diagnostic adoption.
- Pathology modernization creates demand for automated systems.
Competitive Landscape and Strategic Positioning
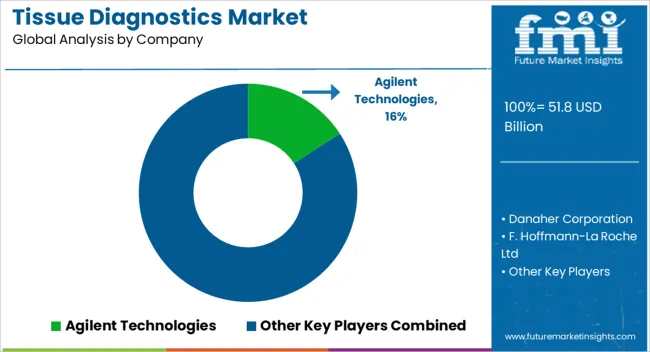
- Agilent Technologies leads the market with comprehensive product and service capabilities and established customer relationships.
- Multiple global and regional players compete on technology capability, certification credentials, and geographic reach.
- Emerging players are targeting specialized applications and next generation technology development.
Agilent Technologies (through its Dako acquisition) and Danaher Corporation (through Leica Biosystems) lead the global tissue diagnostics market with comprehensive staining systems, antibody portfolios, and digital pathology platforms. F. Hoffmann-La Roche holds a strong position through its Ventana tissue diagnostics division.
Abbott Laboratories and BIOMERIEUX provide diagnostic instruments and consumables for hospital and laboratory settings. Merck KGaA and GE Healthcare contribute specialty reagents and imaging solutions.
BioGenex, Cell Signaling Technology, and Koninklijke Philips provide specialized tissue diagnostic products including antibodies, imaging platforms, and digital pathology solutions for research and clinical markets.
Key Companies in the Tissue Diagnostics Market
Key global companies leading the tissue diagnostics market include:
- Agilent Technologies (USA), Danaher Corporation (USA), F. Hoffmann-La Roche Ltd (Switzerland), BIOMERIEUX (France), Abbott Laboratories (USA) hold strong positions through manufacturing scale, certification credentials, and established customer relationships.
- Merck KGaA (Germany), General Electric Company / GE Healthcare (USA), BioGenex (USA), Cell Signaling Technology, Inc. (USA) are expanding presence through regional focus and specialized product development.
- Koninklijke Philips N.V. (Netherlands) represent emerging participants targeting niche applications.
Competitive Benchmarking: Tissue Diagnostics Market
| Company | Diagnostic Portfolio | Automation Level | Companion Diagnostic | Geographic Reach |
|---|---|---|---|---|
| Agilent Technologies | High | High | Strong | Global |
| Danaher Corporation | High | High | Strong | Global |
| F. Hoffmann-La Roche | High | High | Strong | Global |
| BIOMERIEUX | High | High | Strong | Europe, Global |
| Abbott Laboratories | High | High | Strong | Global |
| Merck KGaA | High | High | Moderate | Europe, Global |
| GE Healthcare | High | High | Moderate | Global |
| BioGenex | Medium | High | Moderate | North America, Global |
| Cell Signaling Technology | High | Medium | Moderate | Global |
| Koninklijke Philips | High | High | Moderate | Global |
Source: Future Market Insights competitive analysis, 2026.
Key Players in the Tissue Diagnostics Market
Major Global Players
- Agilent Technologies (USA)
- Danaher Corporation (USA)
- F. Hoffmann-La Roche Ltd (Switzerland)
- BIOMERIEUX (France)
- Abbott Laboratories (USA)
Emerging Players/Startups
- Merck KGaA (Germany)
- General Electric Company / GE Healthcare (USA)
- BioGenex (USA)
- Cell Signaling Technology, Inc. (USA)
- Koninklijke Philips N.V. (Netherlands)
Report Scope and Coverage
| Parameter | Details |
|---|---|
| Quantitative Units | USD Billion 58.43 to USD Billion 194.86, at a CAGR of 12.8% |
| Market Definition | The tissue diagnostics market covers products, instruments, and consumables used for the examination of tissue samples to diagnose diseases including cancer, infectious diseases, and autoimmune conditions. Key technologies include immunohistochemistry (IHC), in situ hybridization (ISH), and hematoxylin and eosin (H&E) staining used across hospitals, diagnostic laboratories, contract research organizations, and biotechnology companies. |
| Regions Covered | North America, Latin America, Europe, East Asia, South Asia and Pacific, Middle East and Africa |
| Countries Covered | China, India, Germany, France, UK, USA, Brazil, and 30 plus countries |
| Key Companies Profiled | Agilent Technologies, Danaher Corporation, F. Hoffmann-La Roche Ltd, BIOMERIEUX, Abbott Laboratories, Merck KGaA, General Electric Company / GE Healthcare, BioGenex |
| Forecast Period | 2026 to 2036 |
| Approach | Hybrid bottom up and top down methodology starting with verified transaction data, projecting adoption velocity across segments and regions. |
Segmentation
Tissue Diagnostics Market Segmented by Product:
- Consumables
- Instruments
- Microscope
- Non-contact Handheld IR Thermometer
- Haemocytometer
- NMR Tube
- Others
- Reagent Kits
- Others
Tissue Diagnostics Market Segmented by Disease:
- Breast Cancer
- Lung Cancer
- Lymphoma
- Pancreatic Cancer
- Others
Tissue Diagnostics Market Segmented by Application:
- Immunohistochemistry (IHC)
- In Situ Hybridization
- Hematoxylin and Eosin (H&E)
Tissue Diagnostics Market Segmented by End User:
- Hospitals
- Diagnostic Laboratories
- Contract Research Organizations
- Research Organizations
- Biotechnology Companies
Tissue Diagnostics Market by Region:
- North America
- USA
- Canada
- Mexico
- Latin America
- Brazil
- Chile
- Rest of Latin America
- Western Europe
- Germany
- UK
- Italy
- Spain
- France
- Nordic
- BENELUX
- Rest of Western Europe
- Eastern Europe
- Russia
- Poland
- Hungary
- Balkan & Baltic
- Rest of Eastern Europe
- East Asia
- China
- Japan
- South Korea
- South Asia and Pacific
- India
- ASEAN
- Australia & New Zealand
- Rest of South Asia and Pacific
- Middle East & Africa
- Kingdom of Saudi Arabia
- Other GCC Countries
- Turkiye
- South Africa
- Other African Union
- Rest of Middle East & Africa
Research Sources and Bibliography
- 1. World Health Organization. (2025). WHO Global Cancer Observatory: Cancer Incidence and Diagnostic Trends. WHO.
- 2. USA Food and Drug Administration. (2024). FDA Guidance on Companion Diagnostics for Targeted Cancer Therapies. FDA.
- 3. College of American Pathologists. (2025). CAP Guidelines for Tissue Based Biomarker Testing. CAP.
- 4. European Medicines Agency. (2024). EMA Guideline on Companion Diagnostics and Tissue Based Testing. EMA.
- 5. Digital Pathology Association. (2025). DPA White Paper: AI in Tissue Diagnostics, Clinical Validation and Implementation. DPA.
This bibliography is provided for reader reference. The full Future Market Insights report contains the complete reference list.
This Report Answers
- Estimating the size of the market and projected revenue from 2026 to 2036.
- Segmentation by product, disease, application, end user, and region.
- Insights across more than 30 country markets.
- Analysis of digital pathology, AI integration, and companion diagnostic trends.
- Assessment of the competitive landscape and diagnostic company positioning.
- Identification of investment opportunities in precision oncology and emerging market diagnostic infrastructure.
- Tracking regulatory developments in companion diagnostic requirements.
- Delivery of data in PDF and Excel formats.
Frequently Asked Questions
What is the global market demand for Tissue Diagnostics in 2026?
In 2026, the global tissue diagnostics market is expected to be worth USD Billion 58.43 billion.
How big will the Tissue Diagnostics Market be in 2036?
By 2036, the tissue diagnostics market is expected to be worth USD Billion 194.86 billion.
How much is demand for Tissue Diagnostics expected to grow between 2026 and 2036?
Between 2026 and 2036, demand is expected to grow at a CAGR of 12.8%.
Which product segment is expected to lead in 2026?
Consumables is expected to account for 21.3% of the product segment in 2026, driven by the recurring demand for reagent kits, antibodies, probes, and staining solutions used in high volume tissue testing across hospital pathology laboratories and diagnostic centers.
What is causing demand to rise in China?
China is expected to grow at 17.3% CAGR through 2036. Healthcare infrastructure expansion creates diagnostic laboratory demand.
What is causing demand to rise in India?
India is expected to grow at 16.0% CAGR through 2036. Diagnostic laboratory growth creates tissue testing infrastructure.
What does this report mean by 'Tissue Diagnostics Market definition'?
The tissue diagnostics market covers products, instruments, and consumables used for the examination of tissue samples to diagnose diseases including cancer, infectious diseases, and autoimmune conditions. Key technologies include immunohistochemistry (IHC), in situ hybridization (ISH), and hematoxylin and eosin (H&E) staining used across hospitals, diagnostic laboratories, contract research organizations, and biotechnology companies.
How does FMI make the Tissue Diagnostics forecast and validate it?
Forecasting models use a hybrid bottom up and top down approach, starting with verified transaction data and validating against industry production statistics and manufacturer disclosures.
Preview the report firsthand - request a free sample
Get SampleGet the brochure for pricing and purchase details.
Get PDFTable of Content
- Executive Summary
- Global Market Outlook
- Demand-side Trends
- Supply-side Trends
- Technology Roadmap Analysis
- Analysis and Recommendations
- Market Overview
- Market Coverage / Taxonomy
- Market Definition / Scope / Limitations
- Research Methodology
- Chapter Orientation
- Analytical Lens and Working Hypotheses
- Market Structure, Signals, and Trend Drivers
- Benchmarking and Cross-market Comparability
- Market Sizing, Forecasting, and Opportunity Mapping
- Research Design and Evidence Framework
- Desk Research Programme (Secondary Evidence)
- Company Annual and Sustainability Reports
- Peer-reviewed Journals and Academic Literature
- Corporate Websites, Product Literature, and Technical Notes
- Earnings Decks and Investor Briefings
- Statutory Filings and Regulatory Disclosures
- Technical White Papers and Standards Notes
- Trade Journals, Industry Magazines, and Analyst Briefs
- Conference Proceedings, Webinars, and Seminar Materials
- Government Statistics Portals and Public Data Releases
- Press Releases and Reputable Media Coverage
- Specialist Newsletters and Curated Briefings
- Sector Databases and Reference Repositories
- FMI Internal Proprietary Databases and Historical Market Datasets
- Subscription Datasets and Paid Sources
- Social Channels, Communities, and Digital Listening Inputs
- Additional Desk Sources
- Expert Input and Fieldwork (Primary Evidence)
- Primary Modes
- Qualitative Interviews and Expert Elicitation
- Quantitative Surveys and Structured Data Capture
- Blended Approach
- Why Primary Evidence is Used
- Field Techniques
- Interviews
- Surveys
- Focus Groups
- Observational and In-context Research
- Social and Community Interactions
- Stakeholder Universe Engaged
- C-suite Leaders
- Board Members
- Presidents and Vice Presidents
- R&D and Innovation Heads
- Technical Specialists
- Domain Subject-matter Experts
- Scientists
- Physicians and Other Healthcare Professionals
- Governance, Ethics, and Data Stewardship
- Research Ethics
- Data Integrity and Handling
- Primary Modes
- Tooling, Models, and Reference Databases
- Desk Research Programme (Secondary Evidence)
- Data Engineering and Model Build
- Data Acquisition and Ingestion
- Cleaning, Normalisation, and Verification
- Synthesis, Triangulation, and Analysis
- Quality Assurance and Audit Trail
- Market Background
- Market Dynamics
- Drivers
- Restraints
- Opportunity
- Trends
- Scenario Forecast
- Demand in Optimistic Scenario
- Demand in Likely Scenario
- Demand in Conservative Scenario
- Opportunity Map Analysis
- Product Life Cycle Analysis
- Supply Chain Analysis
- Investment Feasibility Matrix
- Value Chain Analysis
- PESTLE and Porter’s Analysis
- Regulatory Landscape
- Regional Parent Market Outlook
- Production and Consumption Statistics
- Import and Export Statistics
- Market Dynamics
- Global Market Analysis 2021 to 2025 and Forecast, 2026 to 2036
- Historical Market Size Value (USD Million) Analysis, 2021 to 2025
- Current and Future Market Size Value (USD Million) Projections, 2026 to 2036
- Y-o-Y Growth Trend Analysis
- Absolute $ Opportunity Analysis
- Global Market Pricing Analysis 2021 to 2025 and Forecast 2026 to 2036
- Global Market Analysis 2021 to 2025 and Forecast 2026 to 2036, By Product
- Introduction / Key Findings
- Historical Market Size Value (USD Million) Analysis By Product , 2021 to 2025
- Current and Future Market Size Value (USD Million) Analysis and Forecast By Product , 2026 to 2036
- Consumables
- Instruments
- Microscope
- Non-contact Handheld IR Thermometer
- Haemocytometer
- NMR Tube
- Others
- Reagent Kits
- Others
- Consumables
- Y-o-Y Growth Trend Analysis By Product , 2021 to 2025
- Absolute $ Opportunity Analysis By Product , 2026 to 2036
- Global Market Analysis 2021 to 2025 and Forecast 2026 to 2036, By Disease
- Introduction / Key Findings
- Historical Market Size Value (USD Million) Analysis By Disease, 2021 to 2025
- Current and Future Market Size Value (USD Million) Analysis and Forecast By Disease, 2026 to 2036
- Breast Cancer
- Lung Cancer
- Lymphoma
- Pancreatic Cancer
- Others
- Breast Cancer
- Y-o-Y Growth Trend Analysis By Disease, 2021 to 2025
- Absolute $ Opportunity Analysis By Disease, 2026 to 2036
- Global Market Analysis 2021 to 2025 and Forecast 2026 to 2036, By Application
- Introduction / Key Findings
- Historical Market Size Value (USD Million) Analysis By Application, 2021 to 2025
- Current and Future Market Size Value (USD Million) Analysis and Forecast By Application, 2026 to 2036
- Immunohistochemistry (IHC)
- In Situ Hybridization
- Hematoxylin and Eosin (H&E)
- Immunohistochemistry (IHC)
- Y-o-Y Growth Trend Analysis By Application, 2021 to 2025
- Absolute $ Opportunity Analysis By Application, 2026 to 2036
- Global Market Analysis 2021 to 2025 and Forecast 2026 to 2036, By End User
- Introduction / Key Findings
- Historical Market Size Value (USD Million) Analysis By End User, 2021 to 2025
- Current and Future Market Size Value (USD Million) Analysis and Forecast By End User, 2026 to 2036
- Hospitals
- Diagnostic Laboratories
- Contract Research Organizations
- Research Organizations
- Biotechnology Companies
- Hospitals
- Y-o-Y Growth Trend Analysis By End User, 2021 to 2025
- Absolute $ Opportunity Analysis By End User, 2026 to 2036
- Global Market Analysis 2021 to 2025 and Forecast 2026 to 2036, By Region
- Introduction
- Historical Market Size Value (USD Million) Analysis By Region, 2021 to 2025
- Current Market Size Value (USD Million) Analysis and Forecast By Region, 2026 to 2036
- North America
- Latin America
- Western Europe
- Eastern Europe
- East Asia
- South Asia and Pacific
- Middle East & Africa
- Market Attractiveness Analysis By Region
- North America Market Analysis 2021 to 2025 and Forecast 2026 to 2036, By Country
- Historical Market Size Value (USD Million) Trend Analysis By Market Taxonomy, 2021 to 2025
- Market Size Value (USD Million) Forecast By Market Taxonomy, 2026 to 2036
- By Country
- USA
- Canada
- Mexico
- By Product
- By Disease
- By Application
- By End User
- By Country
- Market Attractiveness Analysis
- By Country
- By Product
- By Disease
- By Application
- By End User
- Key Takeaways
- Latin America Market Analysis 2021 to 2025 and Forecast 2026 to 2036, By Country
- Historical Market Size Value (USD Million) Trend Analysis By Market Taxonomy, 2021 to 2025
- Market Size Value (USD Million) Forecast By Market Taxonomy, 2026 to 2036
- By Country
- Brazil
- Chile
- Rest of Latin America
- By Product
- By Disease
- By Application
- By End User
- By Country
- Market Attractiveness Analysis
- By Country
- By Product
- By Disease
- By Application
- By End User
- Key Takeaways
- Western Europe Market Analysis 2021 to 2025 and Forecast 2026 to 2036, By Country
- Historical Market Size Value (USD Million) Trend Analysis By Market Taxonomy, 2021 to 2025
- Market Size Value (USD Million) Forecast By Market Taxonomy, 2026 to 2036
- By Country
- Germany
- UK
- Italy
- Spain
- France
- Nordic
- BENELUX
- Rest of Western Europe
- By Product
- By Disease
- By Application
- By End User
- By Country
- Market Attractiveness Analysis
- By Country
- By Product
- By Disease
- By Application
- By End User
- Key Takeaways
- Eastern Europe Market Analysis 2021 to 2025 and Forecast 2026 to 2036, By Country
- Historical Market Size Value (USD Million) Trend Analysis By Market Taxonomy, 2021 to 2025
- Market Size Value (USD Million) Forecast By Market Taxonomy, 2026 to 2036
- By Country
- Russia
- Poland
- Hungary
- Balkan & Baltic
- Rest of Eastern Europe
- By Product
- By Disease
- By Application
- By End User
- By Country
- Market Attractiveness Analysis
- By Country
- By Product
- By Disease
- By Application
- By End User
- Key Takeaways
- East Asia Market Analysis 2021 to 2025 and Forecast 2026 to 2036, By Country
- Historical Market Size Value (USD Million) Trend Analysis By Market Taxonomy, 2021 to 2025
- Market Size Value (USD Million) Forecast By Market Taxonomy, 2026 to 2036
- By Country
- China
- Japan
- South Korea
- By Product
- By Disease
- By Application
- By End User
- By Country
- Market Attractiveness Analysis
- By Country
- By Product
- By Disease
- By Application
- By End User
- Key Takeaways
- South Asia and Pacific Market Analysis 2021 to 2025 and Forecast 2026 to 2036, By Country
- Historical Market Size Value (USD Million) Trend Analysis By Market Taxonomy, 2021 to 2025
- Market Size Value (USD Million) Forecast By Market Taxonomy, 2026 to 2036
- By Country
- India
- ASEAN
- Australia & New Zealand
- Rest of South Asia and Pacific
- By Product
- By Disease
- By Application
- By End User
- By Country
- Market Attractiveness Analysis
- By Country
- By Product
- By Disease
- By Application
- By End User
- Key Takeaways
- Middle East & Africa Market Analysis 2021 to 2025 and Forecast 2026 to 2036, By Country
- Historical Market Size Value (USD Million) Trend Analysis By Market Taxonomy, 2021 to 2025
- Market Size Value (USD Million) Forecast By Market Taxonomy, 2026 to 2036
- By Country
- Kingdom of Saudi Arabia
- Other GCC Countries
- Turkiye
- South Africa
- Other African Union
- Rest of Middle East & Africa
- By Product
- By Disease
- By Application
- By End User
- By Country
- Market Attractiveness Analysis
- By Country
- By Product
- By Disease
- By Application
- By End User
- Key Takeaways
- Key Countries Market Analysis
- USA
- Pricing Analysis
- Market Share Analysis, 2025
- By Product
- By Disease
- By Application
- By End User
- Canada
- Pricing Analysis
- Market Share Analysis, 2025
- By Product
- By Disease
- By Application
- By End User
- Mexico
- Pricing Analysis
- Market Share Analysis, 2025
- By Product
- By Disease
- By Application
- By End User
- Brazil
- Pricing Analysis
- Market Share Analysis, 2025
- By Product
- By Disease
- By Application
- By End User
- Chile
- Pricing Analysis
- Market Share Analysis, 2025
- By Product
- By Disease
- By Application
- By End User
- Germany
- Pricing Analysis
- Market Share Analysis, 2025
- By Product
- By Disease
- By Application
- By End User
- UK
- Pricing Analysis
- Market Share Analysis, 2025
- By Product
- By Disease
- By Application
- By End User
- Italy
- Pricing Analysis
- Market Share Analysis, 2025
- By Product
- By Disease
- By Application
- By End User
- Spain
- Pricing Analysis
- Market Share Analysis, 2025
- By Product
- By Disease
- By Application
- By End User
- France
- Pricing Analysis
- Market Share Analysis, 2025
- By Product
- By Disease
- By Application
- By End User
- India
- Pricing Analysis
- Market Share Analysis, 2025
- By Product
- By Disease
- By Application
- By End User
- ASEAN
- Pricing Analysis
- Market Share Analysis, 2025
- By Product
- By Disease
- By Application
- By End User
- Australia & New Zealand
- Pricing Analysis
- Market Share Analysis, 2025
- By Product
- By Disease
- By Application
- By End User
- China
- Pricing Analysis
- Market Share Analysis, 2025
- By Product
- By Disease
- By Application
- By End User
- Japan
- Pricing Analysis
- Market Share Analysis, 2025
- By Product
- By Disease
- By Application
- By End User
- South Korea
- Pricing Analysis
- Market Share Analysis, 2025
- By Product
- By Disease
- By Application
- By End User
- Russia
- Pricing Analysis
- Market Share Analysis, 2025
- By Product
- By Disease
- By Application
- By End User
- Poland
- Pricing Analysis
- Market Share Analysis, 2025
- By Product
- By Disease
- By Application
- By End User
- Hungary
- Pricing Analysis
- Market Share Analysis, 2025
- By Product
- By Disease
- By Application
- By End User
- Kingdom of Saudi Arabia
- Pricing Analysis
- Market Share Analysis, 2025
- By Product
- By Disease
- By Application
- By End User
- Turkiye
- Pricing Analysis
- Market Share Analysis, 2025
- By Product
- By Disease
- By Application
- By End User
- South Africa
- Pricing Analysis
- Market Share Analysis, 2025
- By Product
- By Disease
- By Application
- By End User
- USA
- Market Structure Analysis
- Competition Dashboard
- Competition Benchmarking
- Market Share Analysis of Top Players
- By Regional
- By Product
- By Disease
- By Application
- By End User
- Competition Analysis
- Competition Deep Dive
- Agilent Technologies
- Overview
- Product Portfolio
- Profitability by Market Segments (Product/Age /Sales Channel/Region)
- Sales Footprint
- Strategy Overview
- Marketing Strategy
- Product Strategy
- Channel Strategy
- Danaher Corporation
- F. Hoffmann-La Roche Ltd
- BIOMÉRIEUX
- Abbott Laboratories
- Merck KGaA
- General Electric Company (GE Healthcare)
- BioGenex
- Cell Signaling Technology, Inc.
- Koninklijke Philips N.V.
- Agilent Technologies
- Competition Deep Dive
- Assumptions & Acronyms Used


