Aluminium Ammonium Sulphate Market Size, Share, and Forecast Outlook 2025 to 2035

The aluminium ammonium sulphate market is projected to grow from USD 605.5 million in 2025 to USD 879.2 million by 2035, registering a CAGR of 3.8% during the forecast period.
Quick Stats in Aluminium Ammonium Sulphate Market

  • Market Value (2025): USD 605.5 million
  • Forecast Value (2035): USD 879.2 million
  • Forecast CAGR: 3.8%
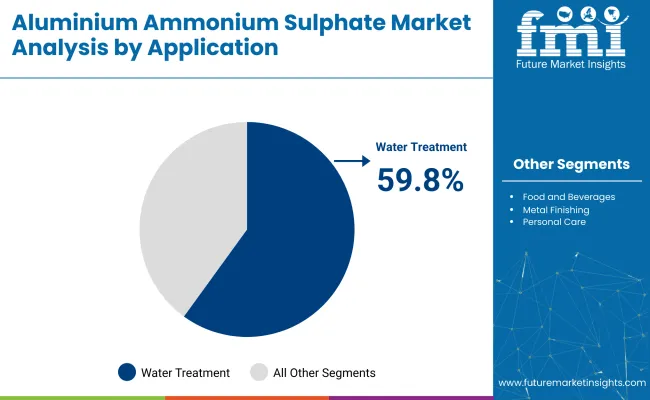
  • Top Application Segment: Water Treatment (59.8% market share in 2025)
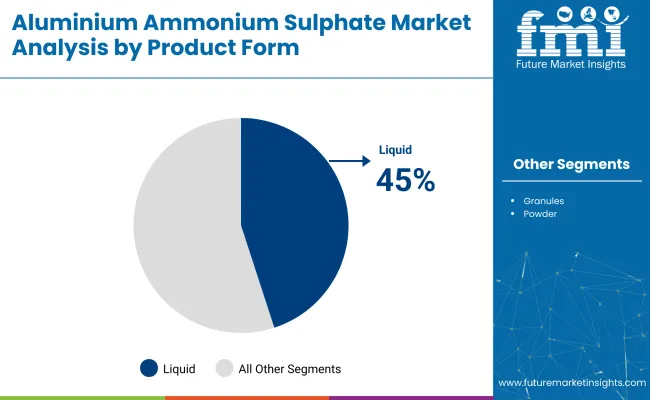
  • Leading Product Form: Liquid (45% market share in 2025)
  • Primary Distribution Channel: Offline (80% market share in 2025)
  • Key Growth Country: India (6.2% CAGR)

Aluminium Ammonium Sulfate Market

Metric Value
Market Size (2025E) USD 605.5 million
Market Value (2035F) USD 879.2 million
CAGR (2025 to 2035) 3.8%

Demand remains concentrated in water treatment, paper manufacturing, and textile dyeing applications, with steady use in pharmaceutical and food additive sectors. The liquid form is emerging as the fastest-growing segment due to its ease of application and safety in dosing systems.

Powder and granular formats continue to support legacy industrial processes across Asia Pacific. Offline distribution channels dominate, with limited penetration of online sales owing to regulatory restrictions on bulk chemical transactions.

Industrial consumption of aluminium ammonium sulphate remains concentrated in Asia Pacific and Europe, where strong chemical manufacturing infrastructure supports steady demand. In India and China, consumption is supported by regional water treatment initiatives, leather processing, and dyeing industries. China is among the leading producers, supplying both domestic and export markets with technical and food-grade variants.

Pricing remains regionally influenced, with FOB values for technical-grade material generally stable between USD 280 and 340 per ton, depending on purity and form. Within the European Union, regulatory oversight under REACH continues to influence production standards, particularly for pharmaceutical and food-grade applications. German and Dutch suppliers prioritize batch consistency and low impurity thresholds to meet industrial and laboratory reagent specifications.

In the water treatment chemicals category, aluminium ammonium sulphate functions as a coagulant, contributing approximately 1-2% of the total segment due to its selective use in municipal systems. In the specialty chemicals segment, it holds around 0.3-0.5% share, given its niche role in dyeing, tanning, and analytical chemistry.

Its use as a firming agent or acidity regulator in the food additives market accounts for about 0.2-0.4% of total volume. The compound also comprises 0.5-0.7% of the industrial chemicals segment and approximately 2-3% of the laboratory reagents market due to its continued relevance in qualitative analysis procedures.

Product stability, moderate pricing, and well-defined industrial use cases ensure aluminium ammonium sulphate maintains a consistent presence across global markets, with growth anchored in Asia Pacific and select regions in Europe where chemical manufacturing infrastructure supports continuous demand.

Analyzing Aluminium Ammonium Sulphate Market by Top Investment Segments

The aluminium ammonium sulphate market is segmented by product form into powder, granules, and liquid. By application, it is categorized into food and beverages, metal finishing, detergents, personal care, fertilizers, and water treatment. The market is distributed through both online and offline channels. Geographically, the market covers North America, Latin America, Asia Pacific, Eastern Europe, Western Europe, and Japan.

Water Treatment to Lead the Application Segment with 59.8% Market Share

Water treatment remains the central application driving demand for aluminium ammonium sulphate, accounting for 59.8% of market share by 2025. Its function as a coagulant in municipal and industrial water systems makes it indispensable.

Whether in city utilities across Asia or wastewater treatment plants in Europe, usage is embedded in long-term operations. Infrastructure upgrades and compliance with environmental standards continue to reinforce its role across both developing and developed economies.
  • Usage remains fixed in municipal and industrial contracts across key regions
  • Infrastructure expansion in smaller urban centers is widening demand base
  • Regulatory enforcement maintains its relevance in public health operations

Aluminium Ammonium Sulfate Market By Application

Liquid Form to Dominate the Product Form Segment with 45% Market Share

Liquid aluminium ammonium sulphate is projected to lead the product form segment, capturing 45% of share by 2025. This shift reflects a preference for formats that integrate easily into automated dosing systems while reducing manual handling. Operators value the lower storage complexity and improved dosing precision that liquid formulations offer. Plants managing high-throughput water volumes see efficiency gains from process reliability and faster reactivity.
  • Lower waste and simplified dosing make liquid format more efficient for treatment systems
  • Compatibility with automated infrastructure enhances adoption in modern facilities
  • Bulk transport and centralized storage benefit from liquid handling economics

Aluminium Ammonium Sulfate Market By Product Form

Offline Channel to Dominate the Distribution Segment with 80% Market Share

Despite increased interest in digital procurement, 80% of aluminium ammonium sulphate sales are still expected to occur through offline channels in 2025. Bulk industrial buyers continue to prefer established relationships with distributors, where procurement cycles, quality assurance, and contract fulfillment remain tightly integrated. Offline purchasing aligns with safety, documentation, and volume handling standards across industries such as chemicals, water utilities, and pharmaceuticals.

  • Offline channels ensure delivery reliability, regulatory compliance, and technical support
  • Industrial buyers prioritize traceability and post-sale service for sensitive applications
  • Digital channels remain secondary where bulk handling and certifications are critical

Top Aluminium Ammonium Sulphate Market Dynamics

Manufacturers are focusing on product purity, supply chain efficiency, and meeting regulatory standards across key sectors such as municipal utilities, agriculture, and analytical chemistry.

Consistent Demand from Water Treatment and Purification Applications

Aluminium ammonium sulphate is widely used as a flocculating agent in municipal water treatment facilities. It aids in coagulation processes by removing suspended solids and impurities. The compound’s effectiveness in clarifying drinking water and treating wastewater makes it a staple in urban infrastructure projects. Agricultural irrigation systems and industrial effluents also rely on it for water quality management.

  • Used as a flocculant to remove impurities in municipal water systems.
  • Essential in treating agricultural runoff and industrial wastewater.
  • Favored for its efficiency in clarifying drinking water and large-scale filtration.

Usage in Laboratory, Textile, and Dye Industries Supports Market Stability

Aluminium ammonium sulphate serves as a mordant in textile dyeing, helping fix dyes to fabrics. It is also utilized in analytical chemistry as a reagent, particularly in crystallography and chemical analysis. Specialty applications in photography and leather tanning further contribute to its industrial relevance. The stable demand across these sectors supports year-round procurement by manufacturing and research facilities.
  • Functions as a mordant to enhance dye adherence in textile processing.
  • Used as a reagent in analytical chemistry and crystal formation studies.
  • Applied in photography and leather processing for niche industrial uses.

Analysis of Top Countries Manufacturing, Utilizing, and Regulating Aluminium Ammonium Sulphate Globally

Country Wise Analysis Of Aluminium Ammonium Sulfate Market

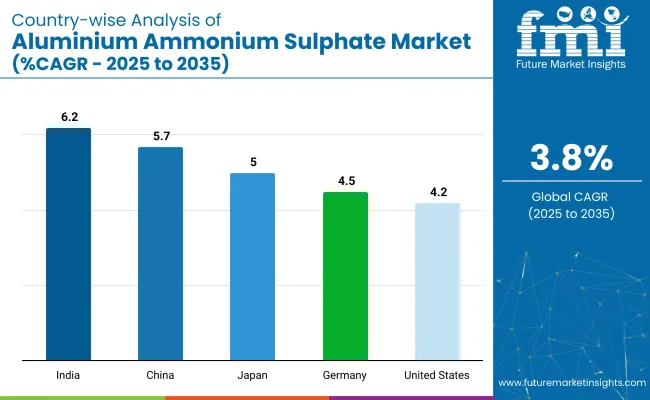
Countries CAGR (2025 to 2035)
India 6.2%
China 5.7%
Japan 5.0%
Germany 4.5%
United States 4.2%

Sales of aluminium ammonium sulphate are expected to advance at a 4.9%CAGR between 2025 and 2035. All five focus markets among forty analysed reveal varied trajectories. India leads at 6.2%, while China follows at 5.7%. Japan records 5.0%, Germany posts 4.5%, and the United States delivers 4.2%.

These rates translate into a growth premium ranging from +26% (India) to -14% (United States) versus the global baseline. Divergence stems from local factors: capacity expansion and municipal demand in the two BRICS economies; purity regulation and food-grade compliance in OECD nations; and niche, high-grade requirements in the United States.

  • India exceeds global CAGR by +1.3 percentage points.
  • China outpaces baseline by +0.8 points.
  • Japan edges ahead by +0.1 points, while Germany and the United States lag by -0.4 and -0.7 points respectively.

The report provides insights across 40+ countries. The five below are highlighted for their strategic influence and growth trajectory.

India Aluminium Ammonium Sulphate Market Outlook

Indian market is projected to grow at a CAGR of 6.2% through 2035, the fastest among the leading countries. This is fueled by growing demand from municipal water treatment plants, expanding food processing sectors, and textile finishing industries. As a BRICS and Emerging Market, India is scaling production through regional chemical hubs and low-cost sourcing of raw materials.

Domestic firms are capitalizing on government infrastructure investments and rising exports of inorganic chemicals. Growth is further supported by India's expanding role as a regional supplier across South Asia and the Middle East.

  • Water treatment sector is expanding its use of alum-based compounds.
  • Low-cost production supports growth in food-grade and textile use.
  • Chemical exports are rising, especially within neighboring economies.

China Aluminium Ammonium Sulphate Market Trends

China is expected to grow at a CAGR of 5.7%, driven by the large-scale use of aluminium ammonium sulphate in textile dyeing, wastewater treatment, and agriculture. As a BRICS and Global Factory Hub, China maintains significant production capacity for alum compounds, including food-grade and industrial variants.

Government standards around water quality and stricter textile effluent controls are accelerating compound usage. China’s packaging and food preservation sectors are incorporating alum as a firming and stabilizing agent. With strong domestic demand and export-oriented manufacturing, China remains a central player in global alum supply chains.

  • Textile and dye industries remain core application segments.
  • Government oversight on wastewater is increasing alum use.
  • Local production meets both domestic demand and export needs.

Japan Aluminium Ammonium Sulphate Market Performance

Japan’s market is growing at a CAGR of 5.0%, underpinned by advanced use cases in precision food processing, specialty chemicals, and high-purity water treatment. As an OECD and High-Standards Compliance Market, Japan focuses on ultra-refined aluminium ammonium sulphate with consistent purity for pharmaceutical, beverage, and dye-set industries.

Domestic manufacturers emphasize minimal environmental impact and regulatory compliance under Japan’s stringent chemical safety laws. The food preservation segment, especially in pickling and baking, remains a key growth area as clean-label additives gain attention.

  • High-purity applications are prioritized in industrial use cases.
  • Food safety regulations favor tightly controlled additive use.
  • Domestic producers emphasize environmental responsibility.

Germany Aluminium Ammonium Sulphate Market Insights

Germany is projected to grow at 4.5% CAGR through 2035, supported by steady demand across food preservation, environmental treatment, and industrial formulations. As a member of the EU27, OECD, and Sustainability-Focused Nations, Germany maintains strict REACH compliance, favoring eco-compatible chemical compounds like aluminium ammonium sulphate.

Its use in bakery preservatives and low-emission industrial dye processes aligns with national goals for chemical safety and reduced exposure. Innovation in automated dosing systems and smart purification processes is driving incremental growth in municipal utilities and food-grade applications.

  • Regulatory compliance under REACH supports controlled use.
  • Clean-label food processing fuels demand for alum derivatives.
  • Water treatment utilities adopt automated alum-dosing systems.

USA Aluminium Ammonium Sulphate Market Overview

The USA market is forecast to grow at a CAGR of 4.2%, driven by demand in high-value industrial, food additive, and laboratory reagent segments. As an OECD and Agri-food Tech Pioneer, the USA focuses on safe, food-grade usage of aluminium ammonium sulphate in baking powder, pickling, and meat preservation.

Environmental concerns and EPA guidelines are steering the market toward more controlled application in wastewater treatment. Specialty chemical suppliers are investing in refining and micronizing techniques for enhanced stability and storage. Domestic demand is further influenced by food safety trends and innovation in clean-label processing.

  • Food-grade alum is widely used in baking and pickling applications.
  • Wastewater treatment plants use alum under strict EPA guidelines.
  • Processing innovation improves consistency and storage life.

Leading Aluminium Ammonium Sulphate Brands

The market is relatively consolidated, with a few key players maintaining strong control over global production and distribution. Prominent manufacturers such as Martin Midstream and GEO Specialty Chemicals Inc.

lead the market with well-established supply chains and a broad industrial customer base. Companies like Amresco Inc., Domo Chemicals, and GFS Chemicals contribute significantly by offering high-purity formulations for applications in water treatment, laboratory reagents, and textile processing.

Sigma-Aldrich Corporation (now part of Merck) and Evonik Industries AG strengthen the market with robust R&D capabilities and specialty chemical portfolios. General Chemicals also plays a vital role by catering to regional demand across diverse end-user industries. Emerging players are increasingly entering niche segments, aiming to provide cost-effective alternatives and customized chemical solutions to a growing industrial client base.

Leading Players in Aluminium Ammonium Sulphate Industry

  • Martin Midstream
  • AmrescoInc
  • GEO Specialty Chemicals Inc.
  • Domo Chemicals
  • GFS Chemicals
  • Sigma-Aldrich Corporation
  • Evonik Industries AG
  • General Chemicals

Report Coverage and Scope Summary

Report Attributes Details
Market Size (2025) USD 605.5 million
Projected Market Size (2035) USD 879.2 million
CAGR (2025 to 2035) 3.8%
Base Year for Estimation 2024
Historical Period 2020 to 2024
Projections Period 2025 to 2035
Quantitative Units USD million for market value
Product Forms Analyzed (Segment 1) Powder, Granules, Liquid
Applications Analyzed (Segment 2) Food & Beverages, Metal Finishing, Detergents, Personal Care, Fertilizers, Water Treatment
Distribution Channels Analyzed Online, Offline
Regions Covered North America, Latin America, Asia Pacific, Eastern Europe, Western Europe, Japan
Key Players Martin Midstream, Amresco Inc, GEO Specialty Chemicals Inc., Domo Chemicals, GFS Chemicals, Sigma-Aldrich Corporation, Evonik Industries AG, General Chemicals, and other emerging players
Additional Attributes Dollar sales across forms and applications, consistent use in water treatment and industrial processing, rising demand in food-grade compounds, and regional expansion of production capacities.

Key Segments

By Product Form:

The industry is segmented by product form into powder, granules, and liquid.

By Application:

Key application areas include food and beverages, metal finishing, detergents, personal care, fertilizers, and water treatment.

By Distribution Channel:

The market is distributed through both online and offline channels.

By Region:

Geographically, the market covers North America, Latin America, Asia Pacific, Eastern Europe, Western Europe, and Japan.

Table of Content

  1. Executive Summary
    • Global Market Outlook
    • Demand-side Trends
    • Supply-side Trends
    • Technology Roadmap Analysis
    • Analysis and Recommendations
  2. Market Overview
    • Market Coverage / Taxonomy
    • Market Definition / Scope / Limitations
  3. Market Background
    • Market Dynamics
      • Drivers
      • Restraints
      • Opportunity
      • Trends
    • Scenario Forecast
      • Demand in Optimistic Scenario
      • Demand in Likely Scenario
      • Demand in Conservative Scenario
    • Opportunity Map Analysis
    • Product Life Cycle Analysis
    • Supply Chain Analysis
      • Supply Side Participants and their Roles
        • Producers
        • Mid-Level Participants (Traders/ Agents/ Brokers)
        • Wholesalers and Distributors
      • Value Added and Value Created at Node in the Supply Chain
      • List of Raw Material Suppliers
      • List of Existing and Potential Buyer’s
    • Investment Feasibility Matrix
    • Value Chain Analysis
      • Profit Margin Analysis
      • Wholesalers and Distributors
      • Retailers
    • PESTLE and Porter’s Analysis
    • Regulatory Landscape
      • By Key Regions
      • By Key Countries
    • Regional Parent Market Outlook
    • Production and Consumption Statistics
    • Import and Export Statistics
  4. Global Market Analysis 2020-2024 and Forecast, 2025-2035
    • Historical Market Size Value (USD Million) & Volume (Metric tons) Analysis, 2020-2024
    • Current and Future Market Size Value (USD Million) & Volume (Metric tons) Projections, 2025-2035
      • Y-o-Y Growth Trend Analysis
      • Absolute $ Opportunity Analysis
  5. Global Market Pricing Analysis 2020-2024 and Forecast 2025-2035
  6. Global Market Analysis 2020-2024 and Forecast 2025-2035, By Product form
    • Introduction / Key Findings
    • Historical Market Size Value (USD Million) & Volume (Metric tons) Analysis By Product form, 2020-2024
    • Current and Future Market Size Value (USD Million) & Volume (Metric tons) Analysis and Forecast By Product form, 2025-2035
      • Powder
      • Granules
      • Liquid
    • Y-o-Y Growth Trend Analysis By Product form, 2020-2024
    • Absolute $ Opportunity Analysis By Product form, 2025-2035
  7. Global Market Analysis 2020-2024 and Forecast 2025-2035, By Application
    • Introduction / Key Findings
    • Historical Market Size Value (USD Million) & Volume (Metric tons) Analysis By Application, 2020-2024
    • Current and Future Market Size Value (USD Million) & Volume (Metric tons) Analysis and Forecast By Application, 2025-2035
      • Food & Beverages
      • Metal finishing
      • Detergents
      • Personal Care
      • Fertilizers
      • Water Treatment
    • Y-o-Y Growth Trend Analysis By Application, 2020-2024
    • Absolute $ Opportunity Analysis By Application, 2025-2035
  8. Global Market Analysis 2020-2024 and Forecast 2025-2035, By Distribution channel
    • Introduction / Key Findings
    • Historical Market Size Value (USD Million) & Volume (Metric tons) Analysis By Distribution channel, 2020-2024
    • Current and Future Market Size Value (USD Million) & Volume (Metric tons) Analysis and Forecast By Distribution channel, 2025-2035
      • Online
      • Offline
    • Y-o-Y Growth Trend Analysis By Distribution channel, 2020-2024
    • Absolute $ Opportunity Analysis By Distribution channel, 2025-2035
  9. Global Market Analysis 2020-2024 and Forecast 2025-2035, By Region
    • Introduction
    • Historical Market Size Value (USD Million) & Volume (Metric tons) Analysis By Region, 2020-2024
    • Current Market Size Value (USD Million) & Volume (Metric tons) Analysis and Forecast By Region, 2025-2035
      • North America
      • Latin America
      • Western Europe
      • Eastern Europe
      • East Asia
      • South Asia & Pacific
      • Middle East and Africa
    • Market Attractiveness Analysis By Region
  10. North America Market Analysis 2020-2024 and Forecast 2025-2035, By Country
    • Historical Market Size Value (USD Million) & Volume (Metric tons) Trend Analysis By Market Taxonomy, 2020-2024
    • Market Size Value (USD Million) & Volume (Metric tons) Forecast By Market Taxonomy, 2025-2035
      • By Country
        • USA
        • Canada
        • Mexico
      • By Product form
      • By Application
      • By Distribution channel
    • Market Attractiveness Analysis
      • By Country
      • By Product form
      • By Application
      • By Distribution channel
    • Key Takeaways
  11. Latin America Market Analysis 2020-2024 and Forecast 2025-2035, By Country
    • Historical Market Size Value (USD Million) & Volume (Metric tons) Trend Analysis By Market Taxonomy, 2020-2024
    • Market Size Value (USD Million) & Volume (Metric tons) Forecast By Market Taxonomy, 2025-2035
      • By Country
        • Brazil
        • Argentina
        • Rest of LATAM
      • By Product form
      • By Application
      • By Distribution channel
    • Market Attractiveness Analysis
      • By Country
      • By Product form
      • By Application
      • By Distribution channel
    • Key Takeaways
  12. Western Europe Market Analysis 2020-2024 and Forecast 2025-2035, By Country
    • Historical Market Size Value (USD Million) & Volume (Metric tons) Trend Analysis By Market Taxonomy, 2020-2024
    • Market Size Value (USD Million) & Volume (Metric tons) Forecast By Market Taxonomy, 2025-2035
      • By Country
        • Germany
        • Italy
        • France
        • UK
        • Spain
        • BENELUX
        • Nordic
        • Rest of W.Europe
      • By Product form
      • By Application
      • By Distribution channel
    • Market Attractiveness Analysis
      • By Country
      • By Product form
      • By Application
      • By Distribution channel
    • Key Takeaways
  13. Eastern Europe Market Analysis 2020-2024 and Forecast 2025-2035, By Country
    • Historical Market Size Value (USD Million) & Volume (Metric tons) Trend Analysis By Market Taxonomy, 2020-2024
    • Market Size Value (USD Million) & Volume (Metric tons) Forecast By Market Taxonomy, 2025-2035
      • By Country
        • Russia
        • Hungary
        • Poland
        • Balkan & Baltics
        • Rest of E. Europe
      • By Product form
      • By Application
      • By Distribution channel
    • Market Attractiveness Analysis
      • By Country
      • By Product form
      • By Application
      • By Distribution channel
    • Key Takeaways
  14. East Asia Market Analysis 2020-2024 and Forecast 2025-2035, By Country
    • Historical Market Size Value (USD Million) & Volume (Metric tons) Trend Analysis By Market Taxonomy, 2020-2024
    • Market Size Value (USD Million) & Volume (Metric tons) Forecast By Market Taxonomy, 2025-2035
      • By Country
        • China
        • Japan
        • South Korea
      • By Product form
      • By Application
      • By Distribution channel
    • Market Attractiveness Analysis
      • By Country
      • By Product form
      • By Application
      • By Distribution channel
    • Key Takeaways
  15. South Asia & Pacific Market Analysis 2020-2024 and Forecast 2025-2035, By Country
    • Historical Market Size Value (USD Million) & Volume (Metric tons) Trend Analysis By Market Taxonomy, 2020-2024
    • Market Size Value (USD Million) & Volume (Metric tons) Forecast By Market Taxonomy, 2025-2035
      • By Country
        • India
        • Australia & New Zealand
        • ASEAN
        • Rest of SAP
      • By Product form
      • By Application
      • By Distribution channel
    • Market Attractiveness Analysis
      • By Country
      • By Product form
      • By Application
      • By Distribution channel
    • Key Takeaways
  16. Middle East and Africa Market Analysis 2020-2024 and Forecast 2025-2035, By Country
    • Historical Market Size Value (USD Million) & Volume (Metric tons) Trend Analysis By Market Taxonomy, 2020-2024
    • Market Size Value (USD Million) & Volume (Metric tons) Forecast By Market Taxonomy, 2025-2035
      • By Country
        • GCC Countries
        • Northern Africa
        • South Africa
        • Turkiye
        • Rest of MEA
      • By Product form
      • By Application
      • By Distribution channel
    • Market Attractiveness Analysis
      • By Country
      • By Product form
      • By Application
      • By Distribution channel
    • Key Takeaways
  17. Key Countries Market Analysis
    • USA
      • Pricing Analysis
      • Market Share Analysis, 2024
        • By Product form
        • By Application
        • By Distribution channel
    • Canada
      • Pricing Analysis
      • Market Share Analysis, 2024
        • By Product form
        • By Application
        • By Distribution channel
    • Brazil
      • Pricing Analysis
      • Market Share Analysis, 2024
        • By Product form
        • By Application
        • By Distribution channel
    • Mexico
      • Pricing Analysis
      • Market Share Analysis, 2024
        • By Product form
        • By Application
        • By Distribution channel
    • Argentina
      • Pricing Analysis
      • Market Share Analysis, 2024
        • By Product form
        • By Application
        • By Distribution channel
  18. Market Structure Analysis
    • Competition Dashboard
    • Competition Benchmarking
    • Market Share Analysis of Top Players
      • By Regional
      • By Product form
      • By Application
      • By Distribution channel
  19. Competition Analysis
    • Competition Deep Dive
      • Martin Midstream
        • Overview
        • Product Portfolio
        • Profitability by Market Segments (Product/Age /Sales Channel/Region)
        • Sales Footprint
        • Strategy Overview
          • Marketing Strategy
          • Product Strategy
          • Channel Strategy
      • Amresco Inc
        • Overview
        • Product Portfolio
        • Profitability by Market Segments (Product/Age /Sales Channel/Region)
        • Sales Footprint
        • Strategy Overview
          • Marketing Strategy
          • Product Strategy
          • Channel Strategy
      • GEO Specialty Chemicals Inc.
        • Overview
        • Product Portfolio
        • Profitability by Market Segments (Product/Age /Sales Channel/Region)
        • Sales Footprint
        • Strategy Overview
          • Marketing Strategy
          • Product Strategy
          • Channel Strategy
      • Domo Chemicals
        • Overview
        • Product Portfolio
        • Profitability by Market Segments (Product/Age /Sales Channel/Region)
        • Sales Footprint
        • Strategy Overview
          • Marketing Strategy
          • Product Strategy
          • Channel Strategy
      • GFS Chemicals
        • Overview
        • Product Portfolio
        • Profitability by Market Segments (Product/Age /Sales Channel/Region)
        • Sales Footprint
        • Strategy Overview
          • Marketing Strategy
          • Product Strategy
          • Channel Strategy
      • Sigma-Aldrich Corporation
        • Overview
        • Product Portfolio
        • Profitability by Market Segments (Product/Age /Sales Channel/Region)
        • Sales Footprint
        • Strategy Overview
          • Marketing Strategy
          • Product Strategy
          • Channel Strategy
      • Evonik Industries AG
        • Overview
        • Product Portfolio
        • Profitability by Market Segments (Product/Age /Sales Channel/Region)
        • Sales Footprint
        • Strategy Overview
          • Marketing Strategy
          • Product Strategy
          • Channel Strategy
      • General Chemicals
        • Overview
        • Product Portfolio
        • Profitability by Market Segments (Product/Age /Sales Channel/Region)
        • Sales Footprint
        • Strategy Overview
          • Marketing Strategy
          • Product Strategy
          • Channel Strategy
  20. Assumptions & Acronyms Used
  21. Research Methodology

List of Tables

  • Table 1: Global Market Value (USD Million) Forecast by Region, 2020-2035
  • Table 2: Global Market Volume (Metric tons) Forecast by Region, 2020-2035
  • Table 3: Global Market Value (USD Million) Forecast by Product form, 2020-2035
  • Table 4: Global Market Volume (Metric tons) Forecast by Product form, 2020-2035
  • Table 5: Global Market Value (USD Million) Forecast by Application, 2020-2035
  • Table 6: Global Market Volume (Metric tons) Forecast by Application, 2020-2035
  • Table 7: Global Market Value (USD Million) Forecast by Distribution channel, 2020-2035
  • Table 8: Global Market Volume (Metric tons) Forecast by Distribution channel, 2020-2035
  • Table 9: North America Market Value (USD Million) Forecast by Country, 2020-2035
  • Table 10: North America Market Volume (Metric tons) Forecast by Country, 2020-2035
  • Table 11: North America Market Value (USD Million) Forecast by Product form, 2020-2035
  • Table 12: North America Market Volume (Metric tons) Forecast by Product form, 2020-2035
  • Table 13: North America Market Value (USD Million) Forecast by Application, 2020-2035
  • Table 14: North America Market Volume (Metric tons) Forecast by Application, 2020-2035
  • Table 15: North America Market Value (USD Million) Forecast by Distribution channel, 2020-2035
  • Table 16: North America Market Volume (Metric tons) Forecast by Distribution channel, 2020-2035
  • Table 17: Latin America Market Value (USD Million) Forecast by Country, 2020-2035
  • Table 18: Latin America Market Volume (Metric tons) Forecast by Country, 2020-2035
  • Table 19: Latin America Market Value (USD Million) Forecast by Product form, 2020-2035
  • Table 20: Latin America Market Volume (Metric tons) Forecast by Product form, 2020-2035
  • Table 21: Latin America Market Value (USD Million) Forecast by Application, 2020-2035
  • Table 22: Latin America Market Volume (Metric tons) Forecast by Application, 2020-2035
  • Table 23: Latin America Market Value (USD Million) Forecast by Distribution channel, 2020-2035
  • Table 24: Latin America Market Volume (Metric tons) Forecast by Distribution channel, 2020-2035
  • Table 25: Western Europe Market Value (USD Million) Forecast by Country, 2020-2035
  • Table 26: Western Europe Market Volume (Metric tons) Forecast by Country, 2020-2035
  • Table 27: Western Europe Market Value (USD Million) Forecast by Product form, 2020-2035
  • Table 28: Western Europe Market Volume (Metric tons) Forecast by Product form, 2020-2035
  • Table 29: Western Europe Market Value (USD Million) Forecast by Application, 2020-2035
  • Table 30: Western Europe Market Volume (Metric tons) Forecast by Application, 2020-2035
  • Table 31: Western Europe Market Value (USD Million) Forecast by Distribution channel, 2020-2035
  • Table 32: Western Europe Market Volume (Metric tons) Forecast by Distribution channel, 2020-2035
  • Table 33: Eastern Europe Market Value (USD Million) Forecast by Country, 2020-2035
  • Table 34: Eastern Europe Market Volume (Metric tons) Forecast by Country, 2020-2035
  • Table 35: Eastern Europe Market Value (USD Million) Forecast by Product form, 2020-2035
  • Table 36: Eastern Europe Market Volume (Metric tons) Forecast by Product form, 2020-2035
  • Table 37: Eastern Europe Market Value (USD Million) Forecast by Application, 2020-2035
  • Table 38: Eastern Europe Market Volume (Metric tons) Forecast by Application, 2020-2035
  • Table 39: Eastern Europe Market Value (USD Million) Forecast by Distribution channel, 2020-2035
  • Table 40: Eastern Europe Market Volume (Metric tons) Forecast by Distribution channel, 2020-2035
  • Table 41: East Asia Market Value (USD Million) Forecast by Country, 2020-2035
  • Table 42: East Asia Market Volume (Metric tons) Forecast by Country, 2020-2035
  • Table 43: East Asia Market Value (USD Million) Forecast by Product form, 2020-2035
  • Table 44: East Asia Market Volume (Metric tons) Forecast by Product form, 2020-2035
  • Table 45: East Asia Market Value (USD Million) Forecast by Application, 2020-2035
  • Table 46: East Asia Market Volume (Metric tons) Forecast by Application, 2020-2035
  • Table 47: East Asia Market Value (USD Million) Forecast by Distribution channel, 2020-2035
  • Table 48: East Asia Market Volume (Metric tons) Forecast by Distribution channel, 2020-2035
  • Table 49: South Asia & Pacific Market Value (USD Million) Forecast by Country, 2020-2035
  • Table 50: South Asia & Pacific Market Volume (Metric tons) Forecast by Country, 2020-2035
  • Table 51: South Asia & Pacific Market Value (USD Million) Forecast by Product form, 2020-2035
  • Table 52: South Asia & Pacific Market Volume (Metric tons) Forecast by Product form, 2020-2035
  • Table 53: South Asia & Pacific Market Value (USD Million) Forecast by Application, 2020-2035
  • Table 54: South Asia & Pacific Market Volume (Metric tons) Forecast by Application, 2020-2035
  • Table 55: South Asia & Pacific Market Value (USD Million) Forecast by Distribution channel, 2020-2035
  • Table 56: South Asia & Pacific Market Volume (Metric tons) Forecast by Distribution channel, 2020-2035
  • Table 57: Middle East and Africa Market Value (USD Million) Forecast by Country, 2020-2035
  • Table 58: Middle East and Africa Market Volume (Metric tons) Forecast by Country, 2020-2035
  • Table 59: Middle East and Africa Market Value (USD Million) Forecast by Product form, 2020-2035
  • Table 60: Middle East and Africa Market Volume (Metric tons) Forecast by Product form, 2020-2035
  • Table 61: Middle East and Africa Market Value (USD Million) Forecast by Application, 2020-2035
  • Table 62: Middle East and Africa Market Volume (Metric tons) Forecast by Application, 2020-2035
  • Table 63: Middle East and Africa Market Value (USD Million) Forecast by Distribution channel, 2020-2035
  • Table 64: Middle East and Africa Market Volume (Metric tons) Forecast by Distribution channel, 2020-2035

List of Figures

  • Figure 1: Global Market Volume (Metric tons) Forecast 2020-2035
  • Figure 2: Global Market Pricing Analysis
  • Figure 3: Global Market Value (USD Million) Forecast 2020-2035
  • Figure 4: Global Market Value Share and BPS Analysis by Product form, 2025 and 2035
  • Figure 5: Global Market Y-o-Y Growth Comparison by Product form, 2025-2035
  • Figure 6: Global Market Attractiveness Analysis by Product form
  • Figure 7: Global Market Value Share and BPS Analysis by Application, 2025 and 2035
  • Figure 8: Global Market Y-o-Y Growth Comparison by Application, 2025-2035
  • Figure 9: Global Market Attractiveness Analysis by Application
  • Figure 10: Global Market Value Share and BPS Analysis by Distribution channel, 2025 and 2035
  • Figure 11: Global Market Y-o-Y Growth Comparison by Distribution channel, 2025-2035
  • Figure 12: Global Market Attractiveness Analysis by Distribution channel
  • Figure 13: Global Market Value (USD Million) Share and BPS Analysis by Region, 2025 and 2035
  • Figure 14: Global Market Y-o-Y Growth Comparison by Region, 2025-2035
  • Figure 15: Global Market Attractiveness Analysis by Region
  • Figure 16: North America Market Incremental $ Opportunity, 2025-2035
  • Figure 17: Latin America Market Incremental $ Opportunity, 2025-2035
  • Figure 18: Western Europe Market Incremental $ Opportunity, 2025-2035
  • Figure 19: Eastern Europe Market Incremental $ Opportunity, 2025-2035
  • Figure 20: East Asia Market Incremental $ Opportunity, 2025-2035
  • Figure 21: South Asia & Pacific Market Incremental $ Opportunity, 2025-2035
  • Figure 22: Middle East and Africa Market Incremental $ Opportunity, 2025-2035
  • Figure 23: North America Market Value Share and BPS Analysis by Country, 2025 and 2035
  • Figure 24: North America Market Value Share and BPS Analysis by Product form, 2025 and 2035
  • Figure 25: North America Market Y-o-Y Growth Comparison by Product form, 2025-2035
  • Figure 26: North America Market Attractiveness Analysis by Product form
  • Figure 27: North America Market Value Share and BPS Analysis by Application, 2025 and 2035
  • Figure 28: North America Market Y-o-Y Growth Comparison by Application, 2025-2035
  • Figure 29: North America Market Attractiveness Analysis by Application
  • Figure 30: North America Market Value Share and BPS Analysis by Distribution channel, 2025 and 2035
  • Figure 31: North America Market Y-o-Y Growth Comparison by Distribution channel, 2025-2035
  • Figure 32: North America Market Attractiveness Analysis by Distribution channel
  • Figure 33: Latin America Market Value Share and BPS Analysis by Country, 2025 and 2035
  • Figure 34: Latin America Market Value Share and BPS Analysis by Product form, 2025 and 2035
  • Figure 35: Latin America Market Y-o-Y Growth Comparison by Product form, 2025-2035
  • Figure 36: Latin America Market Attractiveness Analysis by Product form
  • Figure 37: Latin America Market Value Share and BPS Analysis by Application, 2025 and 2035
  • Figure 38: Latin America Market Y-o-Y Growth Comparison by Application, 2025-2035
  • Figure 39: Latin America Market Attractiveness Analysis by Application
  • Figure 40: Latin America Market Value Share and BPS Analysis by Distribution channel, 2025 and 2035
  • Figure 41: Latin America Market Y-o-Y Growth Comparison by Distribution channel, 2025-2035
  • Figure 42: Latin America Market Attractiveness Analysis by Distribution channel
  • Figure 43: Western Europe Market Value Share and BPS Analysis by Country, 2025 and 2035
  • Figure 44: Western Europe Market Value Share and BPS Analysis by Product form, 2025 and 2035
  • Figure 45: Western Europe Market Y-o-Y Growth Comparison by Product form, 2025-2035
  • Figure 46: Western Europe Market Attractiveness Analysis by Product form
  • Figure 47: Western Europe Market Value Share and BPS Analysis by Application, 2025 and 2035
  • Figure 48: Western Europe Market Y-o-Y Growth Comparison by Application, 2025-2035
  • Figure 49: Western Europe Market Attractiveness Analysis by Application
  • Figure 50: Western Europe Market Value Share and BPS Analysis by Distribution channel, 2025 and 2035
  • Figure 51: Western Europe Market Y-o-Y Growth Comparison by Distribution channel, 2025-2035
  • Figure 52: Western Europe Market Attractiveness Analysis by Distribution channel
  • Figure 53: Eastern Europe Market Value Share and BPS Analysis by Country, 2025 and 2035
  • Figure 54: Eastern Europe Market Value Share and BPS Analysis by Product form, 2025 and 2035
  • Figure 55: Eastern Europe Market Y-o-Y Growth Comparison by Product form, 2025-2035
  • Figure 56: Eastern Europe Market Attractiveness Analysis by Product form
  • Figure 57: Eastern Europe Market Value Share and BPS Analysis by Application, 2025 and 2035
  • Figure 58: Eastern Europe Market Y-o-Y Growth Comparison by Application, 2025-2035
  • Figure 59: Eastern Europe Market Attractiveness Analysis by Application
  • Figure 60: Eastern Europe Market Value Share and BPS Analysis by Distribution channel, 2025 and 2035
  • Figure 61: Eastern Europe Market Y-o-Y Growth Comparison by Distribution channel, 2025-2035
  • Figure 62: Eastern Europe Market Attractiveness Analysis by Distribution channel
  • Figure 63: East Asia Market Value Share and BPS Analysis by Country, 2025 and 2035
  • Figure 64: East Asia Market Value Share and BPS Analysis by Product form, 2025 and 2035
  • Figure 65: East Asia Market Y-o-Y Growth Comparison by Product form, 2025-2035
  • Figure 66: East Asia Market Attractiveness Analysis by Product form
  • Figure 67: East Asia Market Value Share and BPS Analysis by Application, 2025 and 2035
  • Figure 68: East Asia Market Y-o-Y Growth Comparison by Application, 2025-2035
  • Figure 69: East Asia Market Attractiveness Analysis by Application
  • Figure 70: East Asia Market Value Share and BPS Analysis by Distribution channel, 2025 and 2035
  • Figure 71: East Asia Market Y-o-Y Growth Comparison by Distribution channel, 2025-2035
  • Figure 72: East Asia Market Attractiveness Analysis by Distribution channel
  • Figure 73: South Asia & Pacific Market Value Share and BPS Analysis by Country, 2025 and 2035
  • Figure 74: South Asia & Pacific Market Value Share and BPS Analysis by Product form, 2025 and 2035
  • Figure 75: South Asia & Pacific Market Y-o-Y Growth Comparison by Product form, 2025-2035
  • Figure 76: South Asia & Pacific Market Attractiveness Analysis by Product form
  • Figure 77: South Asia & Pacific Market Value Share and BPS Analysis by Application, 2025 and 2035
  • Figure 78: South Asia & Pacific Market Y-o-Y Growth Comparison by Application, 2025-2035
  • Figure 79: South Asia & Pacific Market Attractiveness Analysis by Application
  • Figure 80: South Asia & Pacific Market Value Share and BPS Analysis by Distribution channel, 2025 and 2035
  • Figure 81: South Asia & Pacific Market Y-o-Y Growth Comparison by Distribution channel, 2025-2035
  • Figure 82: South Asia & Pacific Market Attractiveness Analysis by Distribution channel
  • Figure 83: Middle East and Africa Market Value Share and BPS Analysis by Country, 2025 and 2035
  • Figure 84: Middle East and Africa Market Value Share and BPS Analysis by Product form, 2025 and 2035
  • Figure 85: Middle East and Africa Market Y-o-Y Growth Comparison by Product form, 2025-2035
  • Figure 86: Middle East and Africa Market Attractiveness Analysis by Product form
  • Figure 87: Middle East and Africa Market Value Share and BPS Analysis by Application, 2025 and 2035
  • Figure 88: Middle East and Africa Market Y-o-Y Growth Comparison by Application, 2025-2035
  • Figure 89: Middle East and Africa Market Attractiveness Analysis by Application
  • Figure 90: Middle East and Africa Market Value Share and BPS Analysis by Distribution channel, 2025 and 2035
  • Figure 91: Middle East and Africa Market Y-o-Y Growth Comparison by Distribution channel, 2025-2035
  • Figure 92: Middle East and Africa Market Attractiveness Analysis by Distribution channel
  • Figure 93: Global Market - Tier Structure Analysis
  • Figure 94: Global Market - Company Share Analysis

Frequently Asked Questions

What is the projected size of the global aluminium ammonium sulphate market by 2035?

The market is expected to reach USD 879.2 million by 2035.

What is the estimated market size of the global aluminium ammonium sulphate market in 2025?

The market size is projected to be USD 605.5 million in 2025.

What is the CAGR of the aluminium ammonium sulphate market from 2025 to 2035?

The market is expected to grow at a CAGR of 3.8% from 2025 to 2035.

Which application segment leads the aluminium ammonium sulphate market in 2025?

Water treatment is expected to lead the application segment with a 59.8% market share in 2025.

Which country is expected to record the highest growth in the aluminium ammonium sulphate market?

India is projected to lead with a CAGR of 6.2% from 2025 to 2035.

Explore Similar Insights

Future Market Insights

Aluminium Ammonium Sulphate Market