Arabinogalactan Market Size, Share, and Forecast Outlook 2025 to 2035 

The global arabinogalactan market is forecasted to reach a value of USD 200.7 million by 2025 and is expected to grow at a CAGR of 3.7% to attain a valuation of USD 288.6 million by 2035. This steady growth trajectory is driven by expanding awareness and demand for functional dietary fibers, particularly those offering immune-modulating and gut health benefits.
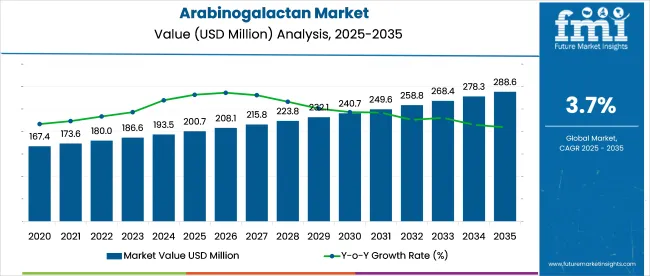
Quick Stats of Arabinogalactan Market

  • Market Value (2025): USD 200.7 million
  • Forecast Value (2035): USD 288.6 million
  • Forecast CAGR (2025 to 2035): 3.7%
  • Leading Segment in 2025: Capsule (55% share)
  • Key Growth Region: Asia Pacific (India is the fastest growing market with 4.0% CAGR)
  • Key Players: BASF SE, DuPont de Nemours Inc., Archer Daniels Midland Company, Cargill Incorporated, Lonza, Pure Encapsulations, Ametis JSC, VetriScience Laboratories, FoodScience of Vermont, Thorne Research Inc., and other prominent market players.

Arabinogalactan Market

Attribute Values
Estimated Industry Size (2025E) USD 200.7 million
Projected Industry Value (2035F) USD 288.6 million
CAGR (2025 to 2035) 3.7%

Arabinogalactan, a plant-derived polysaccharide predominantly sourced from larch trees, is emerging as a critical component in several health-focused industries. Its low toxicity, high solubility, and GRAS (Generally Recognized as Safe) status have made it a sought-after ingredient in nutraceuticals, pharmaceuticals, food and beverage, and personal care sectors. The global inclination toward plant-based and clean-label ingredients further reinforces the position of products as a preferred choice in various formulations.

As of 2025, arabinogalactan registers a relatively niche but growing share across its parent markets. In the functional food ingredients market, it accounts for 2.5%, driven by its use as a dietary fiber and prebiotic. Within the dietary supplements market, it represents around 1.8%, primarily due to its role in immune-support capsules and gut health formulations.

In the pharmaceutical excipients market, its share is estimated at 1.2%, used in controlled-release systems and anti-inflammatory formulations. In the animal feed additives market, it contributes about 2%, particularly in pet food and livestock gut enhancers. In the cosmetic ingredients market, its share remains low at around 0.5%, used as a moisturizer and stabilizer. Its share is small but expanding across these sectors.

The market operates through a vertically integrated structure involving raw material sourcing, processing, formulation, and distribution. The supply chain begins with the harvesting of softwood trees, primarily larch species, from North America and parts of Europe and Asia. These trees undergo extraction processes to be isolated in powder or capsule form.

Manufacturers invest in purification and standardization technologies to ensure product consistency across batches. The processedingredient is then supplied to formulation companies operating in the dietary supplement, food and beverage, cosmetic, and pharmaceutical sectors.

Distributors and retailers, including online health platforms, specialty stores, and pharmacies, further channel the final products to consumers globally. Market growth is contingent on raw material sourcing, efficient extraction technologies, and regulatory approvals, making collaboration between forestry operators, ingredient processors, and formulation brands essential for long-term industry scalability.

Analyzing of Arabinogalactan Market by Top Investment Segments

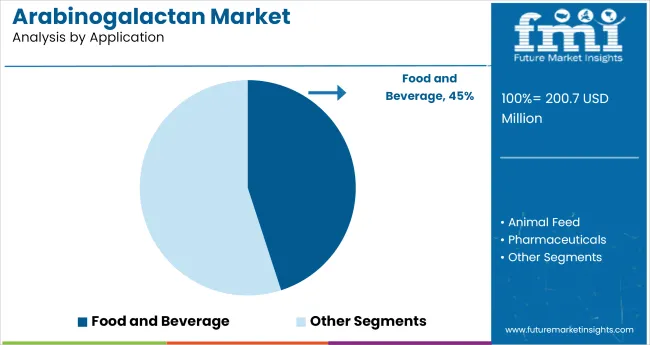
Capsules dominate the arabinogalactan market with a 55% share in 2025 due to their precise dosing, convenience, and growing demand for plant-based supplements. The food and beverage segment holds a 45% share, driven by rising use of arabinogalactan as a prebiotic and dietary fiber in functional, health-focused products across dairy, snacks, and beverages.
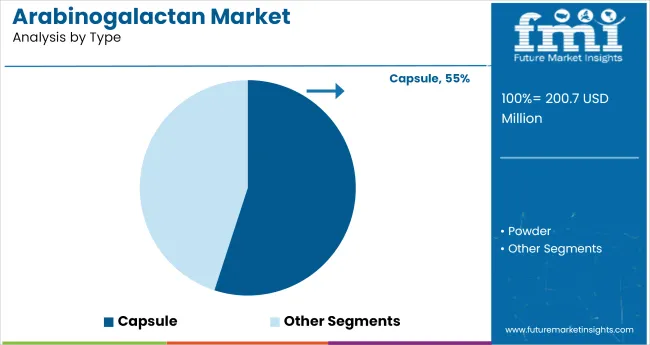
Capsules Lead the Arabinogalactan Market Due to Precision and Convenience

Arabinogalactan Market Analysis By Type

Capsules are the leading segment in the arabinogalactan market, accounting for 55% of the market share in 2025. Their dominance is primarily driven by the increasing demand for easy-to-consume, plant-based health supplements.
  • Capsules offer precise dosage control, which is crucial in pharmaceutical and nutraceutical formulations where consistency and efficacy are key.
  • The rise in vegan and vegetarian consumers has also fueled demand for gelatin-free capsules made from plant-based materials.
  • Attributes make capsules the preferred form in delivering immune-support, gut health, and prebiotic products, especially in developed health and wellness markets.

Food and Beverage Segment Dominates Applications with 45% Share

Arabinogalactan Market Analysis By Application

The food and beverage segment leads the arabinogalactan market with a 45% share in 2025, driven by the global shift toward functional and health-oriented food consumption.

  • They are widely used as a dietary fiber and prebiotic in various products such as dairy, snacks, baked goods, and functional beverages.
  • Manufacturers are increasingly incorporating into food formulations to meet the rising demand for natural, plant-based additives that deliver tangible health benefits.
  • The versatility of powder allows easy integration into both dry and liquid products, further accelerating its use in health-driven foodworldwide.

Top Arabinogalactan Market Dynamics

The arabinogalactan market is driven by rising demand for plant-based, clean-label ingredients in functional foods, supplements, and pharmaceuticals. Its expanding use in animal nutrition and advanced drug delivery systems is broadening its global application scope.

Rising Demand for Functional and Plant-Based Ingredients

The market is significantly influenced by the growing preference for functional and plant-based ingredients. Consumers are increasingly seeking natural solutions for gut health, immunity, and metabolic wellness, positioningit as a high-value prebiotic fiber. Its GRAS status and plant-derived origin make it a preferred choice for clean-label formulations.

The market is also witnessing a surge in demand for vegan and gelatin-free options, especially in North America and Europe. Manufacturers are actively incorporating into health foods, supplements, and beverages to meet evolving dietary trends. This momentum is further supported by emerging clinical research confirming its anti-inflammatory, antioxidant, and immune-enhancing benefits, fueling its use in pharmaceuticals and advanced nutraceuticals.

  • Increasing consumer focus on digestive and immune health
  • Shift toward clean-label, vegan, and ingredients
  • Growing applications in functional foods, nutraceuticals, and pharma

Expansion in Animal Nutrition and Pharmaceutical Applications

The expanding use of arabinogalactan in animal feed and pharmaceuticals represents a key market dynamic. In animal nutrition, it is used as a natural prebiotic and immunity enhancer for pets and livestock, improving digestion and nutrient absorption. With rising awareness around probiotic and gut-friendly pet diets, this is gaining traction in premium feed segments.

Pharmaceutical potential is being tapped in immune-supportive supplements, liver detoxification formulas, and drug delivery systems. Its biocompatibility and ability to enhance active compound absorption make it an attractive excipient in advanced drug formulations. This dual demand from the veterinary and human healthcare sectors is widening application base globally.

  • Rising use of arabinogalactan in pet food and livestock feed
  • Increasing interest in the product for drug delivery and liver health
  • Growth in pharmaceutical formulations for immune support and gut repair

Analysis of Top Countries Manufacturing, Exporting, and Supplying Arabinogalactan Globally

India leads the market with a CAGR of 4.0%, driven by growing demand for nutraceuticals, plant-based supplements, and expanding export opportunities from 2025 to 2035. Germany follows at 3.9%, reflecting strong adoption in functional foods, pharmaceuticals, and vegan capsules. China, with a 3.6% CAGR, is witnessing increased use in traditional medicine, animal feed, and localized production.

The USA, a mature market growing at 3.5%, benefits from high supplement usage and precise formulation demand. Japan, at 3.4%, sees steady growth led by cosmetic and food applications, supported by an aging, health-conscious population. India and China belong to BRICS, while the USA, Germany, and Japan are part of the OECD and G7, highlighting a divide between high-growth emerging markets and innovation-driven developed economies.

The report covers a detailed analysis of 40+ countries, and the top five countries have been shared as a reference.

Countries CAGR (2025 to 2035)
United States 3.5%
Germany 3.9%
Japan 3.4%
China 3.6%
India 4.0%

Sales Analysis of Arabinogalactan in the USA

The USA arabinogalactan market is estimated to grow at a 3.5% CAGR during the study period. The market expansion in the United States is supported by the country’s mature nutraceutical sector and a strong inclination toward evidence-based dietary supplements.

Arabinogalactan is extensively incorporated in immune-support formulas and prebiotic blends, responding to increasing consumer interest in digestive health and natural alternatives to synthetic ingredients. Its application in the pharmaceutical industry is also growing due to its GRAS status and compatibility with various drug delivery systems.

Health-conscious aging populations and rising plant-based preferences are fueling demand for gelatin-free capsule forms, where arabinogalactan serves as a functional additive. Leading supplement manufacturers are integrating arabinogalactan into blends targeting immunity, liver health, and gut balance.

  • High adoption in immune and gut health-focused supplements
  • Shift toward plant-based, gelatin-free formulations in capsules
  • Strong presence of clinical research supporting functional ingredients

In-depth Analysis of Arabinogalactan Market in Germany

Germany is projected to record a 3.9% CAGR in its arabinogalactan market through 2035.Germany represents one of the most progressive markets in Europe for clean-label and plant-based dietary ingredients, making it a prime growth hub for products. The ingredient is increasingly used in functional food formulations such as fortified beverages, energy bars, and dairy alternatives.

German consumers prioritize transparent sourcing and scientifically backed health claims, making arabinogalactan an ideal fit due to its role in immunity enhancement and gut microbiota regulation. Pharmaceutical and nutraceutical firms are developing arabinogalactan-based formulations targeting inflammation and digestion, often marketed through pharmacies and wellness chains.

Germany’s strong export-driven food and supplement industry enables wider adoption of arabinogalactan-enriched products across European Union markets. The regulatory environment is also supportive of novel dietary fibers with proven safety and efficacy.

  • Strong demand for scientifically backed clean-label ingredients
  • Wide use in functional food and pharmacy-grade nutraceuticals
  • Export potential across the EU through German manufacturing hubs

Demand Outlook for Arabinogalactan in Japan

Japan anticipates a steady arabinogalactan market expansion at a CAGR of 3.4% over the next decade.Japan’s arabinogalactan market is shaped by its unique demographic structure and consumer behavior, especially the focus on longevity, digestive wellness, and anti-aging. Arabinogalactan is used in functional beverages, fermented foods, and skin-nourishing supplements, reflecting Japan’s integration of wellness in daily routines.

Demand is increasing from cosmetic companies seeking naturally derived ingredients with hydrating and emulsifying properties, which support arabinogalactan’s use in creams and serums. Japanese companies are exploring arabinogalactan’s application in liver health and metabolic support, aligning with the health needs of the aging population.

The Japanese market also values ingredients with mild flavor profiles and high solubility, which favor the product’s inclusion in food and drink without altering taste. Partnerships between local research institutions and supplement producers are also paving the way for product and premium-positioned offerings.

  • Demand driven by an aging population and wellness culture
  • Growth in beauty-from-within supplements and cosmeceuticals
  • Preference for soluble, neutral-tasting ingredients in daily-use products

Opportunity Analysis of Arabinogalactan in China

China’s arabinogalactan market is forecast to grow at 3.6% CAGR between 2025 and 2035.China is witnessing steady growth in arabinogalactan consumption, fueled by increased awareness around digestive health, immune function, and the benefits of natural polysaccharides. The market is being propelled by traditional medicine manufacturers and nutraceutical firms integrating arabinogalactan into herbal and botanical blends.

Functional food and beverage companies are also adopting the ingredient in fiber-rich snacks and wellness drinks, targeting urban health-conscious consumers. It is gaining acceptance as a prebiotic alternative in pediatric and adult nutrition formulas, especially amid rising concerns over gut microbiome imbalances due to dietary changes in urban areas.

Domestic production is expanding, particularly in northern China, where raw material sourcing and processing investments are underway. Cross-border e-commerce platforms are also enabling wider access to arabinogalactan-containing products from global and local brands.

  • Growth in botanical and traditional medicine-based supplements
  • Expansion in functional beverage and pediatric nutrition applications
  • Investment in domestic processing and distribution

Demand Analysis for Arabinogalactan in India

India’s arabinogalactan market is set to register the highest CAGR of 4.0% during the 2025 to 2035 period. India stands out as the fastest-growing market for arabinogalactan, supported by rising demand for herbal, plant-based, and immunity-focused formulations.

The growth is further accelerated by increasing investments in dietary supplements, Ayurveda-based health products, and fortified food categories. Indian consumers are showing greater awareness of gut health and preventive nutrition, prompting manufacturers to includeit in powders, tablets, and functional snacks.

The adoption is particularly strong in urban centers where the middle-class population is actively seeking natural alternatives to synthetic fibers. In veterinary and animal feed segments, this is gaining traction as a performance enhancer and gut stabilizer for poultry and livestock. The country’s low-cost manufacturing environment and raw material sourcing capabilities make it a competitive export hub for formulations aimed at Southeast Asian and African markets.
  • Surge in herbal and immunity-boosting supplement formulations
  • Application in animal feed for livestock and poultry health
  • Cost-effective production and export potential for regional markets

Leading Arabinogalactan Suppliers

Arabinogalactan Market Analysis By Company

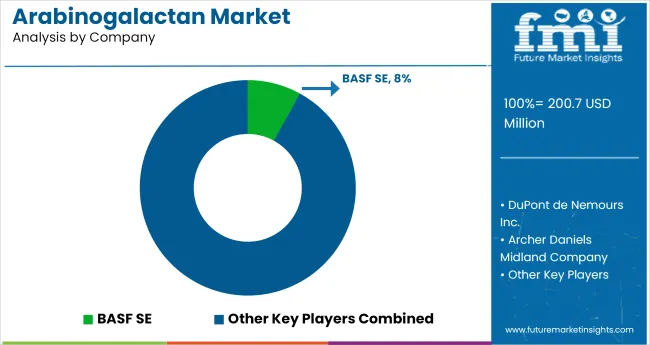
Leading players such as BASF SE, DuPont de Nemours Inc., and Archer Daniels Midland Company are strengthening their portfolios through targeted R&D and ingredients. Cargill Incorporated and Lonza are integrating products into functional nutrition lines, while Pure Encapsulations and Thorne Research Inc. focus on clean-label supplement delivery.

Eastern Europe’s Ametis JSC continues to scale extraction capacities, supporting global bulk supply. Niche wellness brands like Vetri Science Laboratories and Food Science of Vermont are advancing pet nutrition products with immune-boosting formulations.

The competitive landscape also includes other prominent players enhancing product traceability and plant-based sourcing strategies. Collectively, these firms are shaping a robust, innovation-driven supply ecosystem in the global market.

Leading Players

  • BASF SE
  • DuPont de Nemours Inc.
  • Archer Daniels Midland Company
  • Cargill Incorporated; Lonza
  • Pure Encapsulations
  • Ametis JSC
  • VetriScience Laboratories
  • FoodScience of Vermont
  • Thorne Research Inc

Report Coverage and Scope Summary

Report Attributes Details
Market Size (2025) USD 200.7 million
Projected Market Size (2035) USD 288.6 million
CAGR (2025 to 2035) 3.7%
Base Year for Estimation 2024
Historical Period 2020 to 2024
Projections Period 2025 to 2035
Quantitative Units USD million for value and volume in metric tons
Type Analyzed (Segment 1) Capsule and Powder.
Application Analyzed (Segment 2) Food a nd Beverage, Animal Feed, Pharmaceuticals, Cosmetics, and Others.
Regions Covered North America, Europe, Asia Pacific, Middle East & Africa, Latin America
Countries Covered United States, Canada, Germany, United Kingdom, France, Italy, Spain, China, Japan, South Korea, India, Australia, Brazil, Mexico, Argentina, Saudi Arabia, UAE, South Africa
Key Players BASF SE, DuPont de Nemours Inc., Archer Daniels Midland Company, Cargill Incorporated, Lonza, Pure Encapsulations, Ametis JSC, VetriScience Laboratories, Food Science of Vermont, Thorne Research Inc., and other prominent market players.
Additional Attributes Dollar sales, growth rate, regional demand trends, leading applications, competitor share, pricing trends, raw material sourcing, regulatory landscape, and future opportunity hotspots.

Key Segmentation

By Type:

The industry is segmented into capsule and powder.

By Application:

The industry finds applications in food and beverage, animal feed, pharmaceuticals, cosmetics, and other industries.

By Region:

The industry covers regions including North America, Europe, Asia Pacific, Latin America, and the Middle East & Africa.

Table of Content

  1. Executive Summary
    • Global Market Outlook
    • Demand-side Trends
    • Supply-side Trends
    • Technology Roadmap Analysis
    • Analysis and Recommendations
  2. Market Overview
    • Market Coverage/Taxonomy
    • Market Definition/Scope/Limitations
  3. Market Background
    • Market Dynamics
      • Drivers
      • Restraints
      • Opportunity
      • Trends
    • Scenario Forecast
      • Demand in Optimistic Scenario
      • Demand in Likely Scenario
      • Demand in Conservative Scenario
    • Opportunity Map Analysis
    • Product Life Cycle Analysis
    • Supply Chain Analysis
      • Supply Side Participants and their Roles
        • Producers
        • Mid-Level Participants (Traders/ Agents/ Brokers)
        • Wholesalers and Distributors
      • Value Added and Value Created at Node in the Supply Chain
      • List of Raw Material Suppliers
      • List of Existing and Potential Buyer’s
    • Investment Feasibility Matrix
    • Value Chain Analysis
      • Profit Margin Analysis
      • Wholesalers and Distributors
      • Retailers
    • PESTLE and Porter’s Analysis
    • Regulatory Landscape
      • By Key Regions
      • By Key Countries
    • Regional Parent Market Outlook
    • Production and Consumption Statistics
    • Import and Export Statistics
  4. Global Market Analysis 2020 to 2024 and Forecast, 2025 to 2035
    • Historical Market Size Value (USD Million) & Volume (Metric tons) Analysis, 2020 to 2024
    • Current and Future Market Size Value (USD Million) & Volume (Metric tons) Projections, 2025 to 2035
      • Y-o-Y Growth Trend Analysis
      • Absolute $ Opportunity Analysis
  5. Global Market Pricing Analysis 2020 to 2024 and Forecast 2025 to 2035
  6. Global Market Analysis 2020 to 2024 and Forecast 2025 to 2035, By Type
    • Introduction/Key Findings
    • Historical Market Size Value (USD Million) & Volume (Metric tons) Analysis By Type, 2020 to 2024
    • Current and Future Market Size Value (USD Million) & Volume (Metric tons) Analysis and Forecast By Type, 2025 to 2035
      • Capsule
      • Powder
    • Y-o-Y Growth Trend Analysis By Type, 2020 to 2024
    • Absolute $ Opportunity Analysis By Type, 2025 to 2035
  7. Global Market Analysis 2020 to 2024 and Forecast 2025 to 2035, By Application
    • Introduction/Key Findings
    • Historical Market Size Value (USD Million) & Volume (Metric tons) Analysis By Application, 2020 to 2024
    • Current and Future Market Size Value (USD Million) & Volume (Metric tons) Analysis and Forecast By Application, 2025 to 2035
      • Food and Beverage
      • Animal Feed
      • Pharmaceuticals
      • Cosmetic
      • Others
    • Y-o-Y Growth Trend Analysis By Application, 2020 to 2024
    • Absolute $ Opportunity Analysis By Application, 2025 to 2035
  8. Global Market Analysis 2020 to 2024 and Forecast 2025 to 2035, By Region
    • Introduction
    • Historical Market Size Value (USD Million) & Volume (Metric tons) Analysis By Region, 2020 to 2024
    • Current Market Size Value (USD Million) & Volume (Metric tons) Analysis and Forecast By Region, 2025 to 2035
      • North America
      • Latin America
      • Western Europe
      • Eastern Europe
      • East Asia
      • South Asia & Pacific
      • Middle East and Africa
    • Market Attractiveness Analysis By Region
  9. North America Market Analysis 2020 to 2024 and Forecast 2025 to 2035, By Country
    • Historical Market Size Value (USD Million) & Volume (Metric tons) Trend Analysis By Market Taxonomy, 2020 to 2024
    • Market Size Value (USD Million) & Volume (Metric tons) Forecast By Market Taxonomy, 2025 to 2035
      • By Country
        • USA
        • Canada
        • Mexico
      • By Type
      • By Application
    • Market Attractiveness Analysis
      • By Country
      • By Type
      • By Application
    • Key Takeaways
  10. Latin America Market Analysis 2020 to 2024 and Forecast 2025 to 2035, By Country
    • Historical Market Size Value (USD Million) & Volume (Metric tons) Trend Analysis By Market Taxonomy, 2020 to 2024
    • Market Size Value (USD Million) & Volume (Metric tons) Forecast By Market Taxonomy, 2025 to 2035
      • By Country
        • Brazil
        • Argentina
        • Rest of LATAM
      • By Type
      • By Application
    • Market Attractiveness Analysis
      • By Country
      • By Type
      • By Application
    • Key Takeaways
  11. Western Europe Market Analysis 2020 to 2024 and Forecast 2025 to 2035, By Country
    • Historical Market Size Value (USD Million) & Volume (Metric tons) Trend Analysis By Market Taxonomy, 2020 to 2024
    • Market Size Value (USD Million) & Volume (Metric tons) Forecast By Market Taxonomy, 2025 to 2035
      • By Country
        • Germany
        • Italy
        • France
        • UK
        • Spain
        • BENELUX
        • Nordic
        • Rest of W.Europe
      • By Type
      • By Application
    • Market Attractiveness Analysis
      • By Country
      • By Type
      • By Application
    • Key Takeaways
  12. Eastern Europe Market Analysis 2020 to 2024 and Forecast 2025 to 2035, By Country
    • Historical Market Size Value (USD Million) & Volume (Metric tons) Trend Analysis By Market Taxonomy, 2020 to 2024
    • Market Size Value (USD Million) & Volume (Metric tons) Forecast By Market Taxonomy, 2025 to 2035
      • By Country
        • Russia
        • Hungary
        • Poland
        • Balkan & Baltics
        • Rest of E. Europe
      • By Type
      • By Application
    • Market Attractiveness Analysis
      • By Country
      • By Type
      • By Application
    • Key Takeaways
  13. East Asia Market Analysis 2020 to 2024 and Forecast 2025 to 2035, By Country
    • Historical Market Size Value (USD Million) & Volume (Metric tons) Trend Analysis By Market Taxonomy, 2020 to 2024
    • Market Size Value (USD Million) & Volume (Metric tons) Forecast By Market Taxonomy, 2025 to 2035
      • By Country
        • China
        • Japan
        • South Korea
      • By Type
      • By Application
    • Market Attractiveness Analysis
      • By Country
      • By Type
      • By Application
    • Key Takeaways
  14. South Asia & Pacific Market Analysis 2020 to 2024 and Forecast 2025 to 2035, By Country
    • Historical Market Size Value (USD Million) & Volume (Metric tons) Trend Analysis By Market Taxonomy, 2020 to 2024
    • Market Size Value (USD Million) & Volume (Metric tons) Forecast By Market Taxonomy, 2025 to 2035
      • By Country
        • India
        • Australia & New Zealand
        • ASEAN
        • Rest of SAP
      • By Type
      • By Application
    • Market Attractiveness Analysis
      • By Country
      • By Type
      • By Application
    • Key Takeaways
  15. Middle East and Africa Market Analysis 2020 to 2024 and Forecast 2025 to 2035, By Country
    • Historical Market Size Value (USD Million) & Volume (Metric tons) Trend Analysis By Market Taxonomy, 2020 to 2024
    • Market Size Value (USD Million) & Volume (Metric tons) Forecast By Market Taxonomy, 2025 to 2035
      • By Country
        • GCC Countries
        • Northern Africa
        • South Africa
        • Turkiye
        • Rest of MEA
      • By Type
      • By Application
    • Market Attractiveness Analysis
      • By Country
      • By Type
      • By Application
    • Key Takeaways
  16. Key Countries Market Analysis
    • USA
      • Pricing Analysis
      • Market Share Analysis, 2024
        • By Type
        • By Application
    • Canada
      • Pricing Analysis
      • Market Share Analysis, 2024
        • By Type
        • By Application
    • Brazil
      • Pricing Analysis
      • Market Share Analysis, 2024
        • By Type
        • By Application
    • Mexico
      • Pricing Analysis
      • Market Share Analysis, 2024
        • By Type
        • By Application
    • Argentina
      • Pricing Analysis
      • Market Share Analysis, 2024
        • By Type
        • By Application
  17. Market Structure Analysis
    • Competition Dashboard
    • Competition Benchmarking
    • Market Share Analysis of Top Players
      • By Regional
      • By Type
      • By Application
  18. Competition Analysis
    • Competition Deep Dive
      • BASF SE
        • Overview
        • Product Portfolio
        • Profitability by Market Segments (Product/Age /Sales Channel/Region)
        • Sales Footprint
        • Strategy Overview
          • Marketing Strategy
          • Product Strategy
          • Channel Strategy
      • DuPont de Nemours Inc.
        • Overview
        • Product Portfolio
        • Profitability by Market Segments (Product/Age /Sales Channel/Region)
        • Sales Footprint
        • Strategy Overview
          • Marketing Strategy
          • Product Strategy
          • Channel Strategy
      • Archer Daniels Midland Company
        • Overview
        • Product Portfolio
        • Profitability by Market Segments (Product/Age /Sales Channel/Region)
        • Sales Footprint
        • Strategy Overview
          • Marketing Strategy
          • Product Strategy
          • Channel Strategy
      • Cargill Incorporated; Lonza
        • Overview
        • Product Portfolio
        • Profitability by Market Segments (Product/Age /Sales Channel/Region)
        • Sales Footprint
        • Strategy Overview
          • Marketing Strategy
          • Product Strategy
          • Channel Strategy
      • Pure Encapsulations
        • Overview
        • Product Portfolio
        • Profitability by Market Segments (Product/Age /Sales Channel/Region)
        • Sales Footprint
        • Strategy Overview
          • Marketing Strategy
          • Product Strategy
          • Channel Strategy
      • Ametis JSC
        • Overview
        • Product Portfolio
        • Profitability by Market Segments (Product/Age /Sales Channel/Region)
        • Sales Footprint
        • Strategy Overview
          • Marketing Strategy
          • Product Strategy
          • Channel Strategy
      • VetriScience Laboratories
        • Overview
        • Product Portfolio
        • Profitability by Market Segments (Product/Age /Sales Channel/Region)
        • Sales Footprint
        • Strategy Overview
          • Marketing Strategy
          • Product Strategy
          • Channel Strategy
      • FoodScience of Vermont
        • Overview
        • Product Portfolio
        • Profitability by Market Segments (Product/Age /Sales Channel/Region)
        • Sales Footprint
        • Strategy Overview
          • Marketing Strategy
          • Product Strategy
          • Channel Strategy
      • Thorne Research Inc
        • Overview
        • Product Portfolio
        • Profitability by Market Segments (Product/Age /Sales Channel/Region)
        • Sales Footprint
        • Strategy Overview
          • Marketing Strategy
          • Product Strategy
          • Channel Strategy
      • Other Prominent Market Player
        • Overview
        • Product Portfolio
        • Profitability by Market Segments (Product/Age /Sales Channel/Region)
        • Sales Footprint
        • Strategy Overview
          • Marketing Strategy
          • Product Strategy
          • Channel Strategy
  19. Assumptions & Acronyms Used
  20. Research Methodology

List of Tables

  • Table 1: Global Market Value (USD Million) Forecast by Region, 2020-2035
  • Table 2: Global Market Volume (Metric tons) Forecast by Region, 2020-2035
  • Table 3: Global Market Value (USD Million) Forecast by Type, 2020-2035
  • Table 4: Global Market Volume (Metric tons) Forecast by Type, 2020-2035
  • Table 5: Global Market Value (USD Million) Forecast by Application, 2020-2035
  • Table 6: Global Market Volume (Metric tons) Forecast by Application, 2020-2035
  • Table 7: North America Market Value (USD Million) Forecast by Country, 2020-2035
  • Table 8: North America Market Volume (Metric tons) Forecast by Country, 2020-2035
  • Table 9: North America Market Value (USD Million) Forecast by Type, 2020-2035
  • Table 10: North America Market Volume (Metric tons) Forecast by Type, 2020-2035
  • Table 11: North America Market Value (USD Million) Forecast by Application, 2020-2035
  • Table 12: North America Market Volume (Metric tons) Forecast by Application, 2020-2035
  • Table 13: Latin America Market Value (USD Million) Forecast by Country, 2020-2035
  • Table 14: Latin America Market Volume (Metric tons) Forecast by Country, 2020-2035
  • Table 15: Latin America Market Value (USD Million) Forecast by Type, 2020-2035
  • Table 16: Latin America Market Volume (Metric tons) Forecast by Type, 2020-2035
  • Table 17: Latin America Market Value (USD Million) Forecast by Application, 2020-2035
  • Table 18: Latin America Market Volume (Metric tons) Forecast by Application, 2020-2035
  • Table 19: Western Europe Market Value (USD Million) Forecast by Country, 2020-2035
  • Table 20: Western Europe Market Volume (Metric tons) Forecast by Country, 2020-2035
  • Table 21: Western Europe Market Value (USD Million) Forecast by Type, 2020-2035
  • Table 22: Western Europe Market Volume (Metric tons) Forecast by Type, 2020-2035
  • Table 23: Western Europe Market Value (USD Million) Forecast by Application, 2020-2035
  • Table 24: Western Europe Market Volume (Metric tons) Forecast by Application, 2020-2035
  • Table 25: Eastern Europe Market Value (USD Million) Forecast by Country, 2020-2035
  • Table 26: Eastern Europe Market Volume (Metric tons) Forecast by Country, 2020-2035
  • Table 27: Eastern Europe Market Value (USD Million) Forecast by Type, 2020-2035
  • Table 28: Eastern Europe Market Volume (Metric tons) Forecast by Type, 2020-2035
  • Table 29: Eastern Europe Market Value (USD Million) Forecast by Application, 2020-2035
  • Table 30: Eastern Europe Market Volume (Metric tons) Forecast by Application, 2020-2035
  • Table 31: East Asia Market Value (USD Million) Forecast by Country, 2020-2035
  • Table 32: East Asia Market Volume (Metric tons) Forecast by Country, 2020-2035
  • Table 33: East Asia Market Value (USD Million) Forecast by Type, 2020-2035
  • Table 34: East Asia Market Volume (Metric tons) Forecast by Type, 2020-2035
  • Table 35: East Asia Market Value (USD Million) Forecast by Application, 2020-2035
  • Table 36: East Asia Market Volume (Metric tons) Forecast by Application, 2020-2035
  • Table 37: South Asia & Pacific Market Value (USD Million) Forecast by Country, 2020-2035
  • Table 38: South Asia & Pacific Market Volume (Metric tons) Forecast by Country, 2020-2035
  • Table 39: South Asia & Pacific Market Value (USD Million) Forecast by Type, 2020-2035
  • Table 40: South Asia & Pacific Market Volume (Metric tons) Forecast by Type, 2020-2035
  • Table 41: South Asia & Pacific Market Value (USD Million) Forecast by Application, 2020-2035
  • Table 42: South Asia & Pacific Market Volume (Metric tons) Forecast by Application, 2020-2035
  • Table 43: Middle East and Africa Market Value (USD Million) Forecast by Country, 2020-2035
  • Table 44: Middle East and Africa Market Volume (Metric tons) Forecast by Country, 2020-2035
  • Table 45: Middle East and Africa Market Value (USD Million) Forecast by Type, 2020-2035
  • Table 46: Middle East and Africa Market Volume (Metric tons) Forecast by Type, 2020-2035
  • Table 47: Middle East and Africa Market Value (USD Million) Forecast by Application, 2020-2035
  • Table 48: Middle East and Africa Market Volume (Metric tons) Forecast by Application, 2020-2035

List of Figures

  • Figure 1: Global Market Volume (Metric tons) Forecast 2020-2035
  • Figure 2: Global Market Pricing Analysis
  • Figure 3: Global Market Value (USD Million) Forecast 2020-2035
  • Figure 4: Global Market Value Share and BPS Analysis by Type, 2025 and 2035
  • Figure 5: Global Market Y-o-Y Growth Comparison by Type, 2025-2035
  • Figure 6: Global Market Attractiveness Analysis by Type
  • Figure 7: Global Market Value Share and BPS Analysis by Application, 2025 and 2035
  • Figure 8: Global Market Y-o-Y Growth Comparison by Application, 2025-2035
  • Figure 9: Global Market Attractiveness Analysis by Application
  • Figure 10: Global Market Value (USD Million) Share and BPS Analysis by Region, 2025 and 2035
  • Figure 11: Global Market Y-o-Y Growth Comparison by Region, 2025-2035
  • Figure 12: Global Market Attractiveness Analysis by Region
  • Figure 13: North America Market Incremental $ Opportunity, 2025-2035
  • Figure 14: Latin America Market Incremental $ Opportunity, 2025-2035
  • Figure 15: Western Europe Market Incremental $ Opportunity, 2025-2035
  • Figure 16: Eastern Europe Market Incremental $ Opportunity, 2025-2035
  • Figure 17: East Asia Market Incremental $ Opportunity, 2025-2035
  • Figure 18: South Asia & Pacific Market Incremental $ Opportunity, 2025-2035
  • Figure 19: Middle East and Africa Market Incremental $ Opportunity, 2025-2035
  • Figure 20: North America Market Value Share and BPS Analysis by Country, 2025 and 2035
  • Figure 21: North America Market Value Share and BPS Analysis by Type, 2025 and 2035
  • Figure 22: North America Market Y-o-Y Growth Comparison by Type, 2025-2035
  • Figure 23: North America Market Attractiveness Analysis by Type
  • Figure 24: North America Market Value Share and BPS Analysis by Application, 2025 and 2035
  • Figure 25: North America Market Y-o-Y Growth Comparison by Application, 2025-2035
  • Figure 26: North America Market Attractiveness Analysis by Application
  • Figure 27: Latin America Market Value Share and BPS Analysis by Country, 2025 and 2035
  • Figure 28: Latin America Market Value Share and BPS Analysis by Type, 2025 and 2035
  • Figure 29: Latin America Market Y-o-Y Growth Comparison by Type, 2025-2035
  • Figure 30: Latin America Market Attractiveness Analysis by Type
  • Figure 31: Latin America Market Value Share and BPS Analysis by Application, 2025 and 2035
  • Figure 32: Latin America Market Y-o-Y Growth Comparison by Application, 2025-2035
  • Figure 33: Latin America Market Attractiveness Analysis by Application
  • Figure 34: Western Europe Market Value Share and BPS Analysis by Country, 2025 and 2035
  • Figure 35: Western Europe Market Value Share and BPS Analysis by Type, 2025 and 2035
  • Figure 36: Western Europe Market Y-o-Y Growth Comparison by Type, 2025-2035
  • Figure 37: Western Europe Market Attractiveness Analysis by Type
  • Figure 38: Western Europe Market Value Share and BPS Analysis by Application, 2025 and 2035
  • Figure 39: Western Europe Market Y-o-Y Growth Comparison by Application, 2025-2035
  • Figure 40: Western Europe Market Attractiveness Analysis by Application
  • Figure 41: Eastern Europe Market Value Share and BPS Analysis by Country, 2025 and 2035
  • Figure 42: Eastern Europe Market Value Share and BPS Analysis by Type, 2025 and 2035
  • Figure 43: Eastern Europe Market Y-o-Y Growth Comparison by Type, 2025-2035
  • Figure 44: Eastern Europe Market Attractiveness Analysis by Type
  • Figure 45: Eastern Europe Market Value Share and BPS Analysis by Application, 2025 and 2035
  • Figure 46: Eastern Europe Market Y-o-Y Growth Comparison by Application, 2025-2035
  • Figure 47: Eastern Europe Market Attractiveness Analysis by Application
  • Figure 48: East Asia Market Value Share and BPS Analysis by Country, 2025 and 2035
  • Figure 49: East Asia Market Value Share and BPS Analysis by Type, 2025 and 2035
  • Figure 50: East Asia Market Y-o-Y Growth Comparison by Type, 2025-2035
  • Figure 51: East Asia Market Attractiveness Analysis by Type
  • Figure 52: East Asia Market Value Share and BPS Analysis by Application, 2025 and 2035
  • Figure 53: East Asia Market Y-o-Y Growth Comparison by Application, 2025-2035
  • Figure 54: East Asia Market Attractiveness Analysis by Application
  • Figure 55: South Asia & Pacific Market Value Share and BPS Analysis by Country, 2025 and 2035
  • Figure 56: South Asia & Pacific Market Value Share and BPS Analysis by Type, 2025 and 2035
  • Figure 57: South Asia & Pacific Market Y-o-Y Growth Comparison by Type, 2025-2035
  • Figure 58: South Asia & Pacific Market Attractiveness Analysis by Type
  • Figure 59: South Asia & Pacific Market Value Share and BPS Analysis by Application, 2025 and 2035
  • Figure 60: South Asia & Pacific Market Y-o-Y Growth Comparison by Application, 2025-2035
  • Figure 61: South Asia & Pacific Market Attractiveness Analysis by Application
  • Figure 62: Middle East and Africa Market Value Share and BPS Analysis by Country, 2025 and 2035
  • Figure 63: Middle East and Africa Market Value Share and BPS Analysis by Type, 2025 and 2035
  • Figure 64: Middle East and Africa Market Y-o-Y Growth Comparison by Type, 2025-2035
  • Figure 65: Middle East and Africa Market Attractiveness Analysis by Type
  • Figure 66: Middle East and Africa Market Value Share and BPS Analysis by Application, 2025 and 2035
  • Figure 67: Middle East and Africa Market Y-o-Y Growth Comparison by Application, 2025-2035
  • Figure 68: Middle East and Africa Market Attractiveness Analysis by Application
  • Figure 69: Global Market - Tier Structure Analysis
  • Figure 70: Global Market - Company Share Analysis

Frequently Asked Questions

What is the estimated market size of the arabinogalactan industry in 2025?

The industry is valued at USD 200.7 million in 2025.

What is the projected industry size of the arabinogalactan industry by 2035?

It is forecasted to reach USD 288.6 million by 2035.

What is the expected CAGR for the arabinogalactan industry between 2025 and 2035?

The industry is anticipated to grow at a CAGR of 3.7% during this period.

Which segment is expected to lead the arabinogalactan market in 2025?

Capsules are projected to lead the market with a 55% share in 2025.

Which region is expected to witness the highest growth in the arabinogalactan market?

Asia Pacific, particularly India, is expected to be the key growth region with a projected growth rate of 4.0%.

Future Market Insights

Arabinogalactan Market