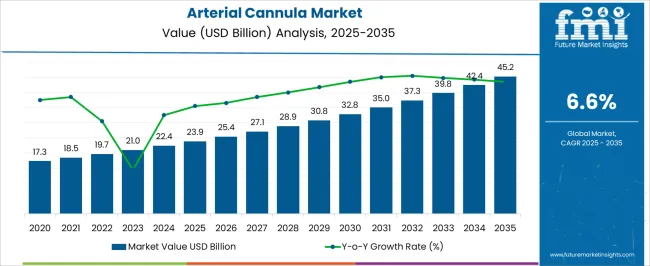
The Arterial Cannula Market is estimated to be valued at USD 23.9 billion in 2025 and is projected to reach USD 45.2 billion by 2035, registering a compound annual growth rate (CAGR) of 6.6% over the forecast period.
| Metric | Value |
|---|---|
| Arterial Cannula Market Estimated Value in (2025 E) | USD 23.9 billion |
| Arterial Cannula Market Forecast Value in (2035 F) | USD 45.2 billion |
| Forecast CAGR (2025 to 2035) | 6.6% |
The arterial cannula market is experiencing consistent growth driven by rising adoption of advanced cardiac and respiratory support interventions and increasing prevalence of critical care procedures across global healthcare systems. Demand for efficient extracorporeal circulation and improved patient survival in high acuity settings has amplified the use of arterial cannulas in both adult and pediatric patient groups.
Technological advancements in material composition, hemodynamic flow optimization, and trauma minimization have further elevated product performance and clinical outcomes. The market is also supported by an increasing number of open heart surgeries and complex interventions in intensive care units.
With a strong focus on minimizing complications and enhancing patient management during extracorporeal procedures, the outlook remains promising as hospitals and specialty clinics continue to invest in high precision vascular access solutions.
The market is segmented by Application, Size, and End Use and region. By Application, the market is divided into Extracorporeal Membrane Oxygenation (ECMO), Cardiopulmonary Bypass Surgery, and Others. In terms of Size, the market is classified into 14-16 Fr, 17-19 Fr, 20-22 Fr, 23-25 Fr, 26-28 Fr, 29-31 Fr, 32-34 Fr, and 35-36 Fr. Based on End Use, the market is segmented into Hospitals, Ambulatory Surgical Centers, and Others. Regionally, the market is classified into North America, Latin America, Western Europe, Eastern Europe, Balkan & Baltic Countries, Russia & Belarus, Central Asia, East Asia, South Asia & Pacific, and the Middle East & Africa.
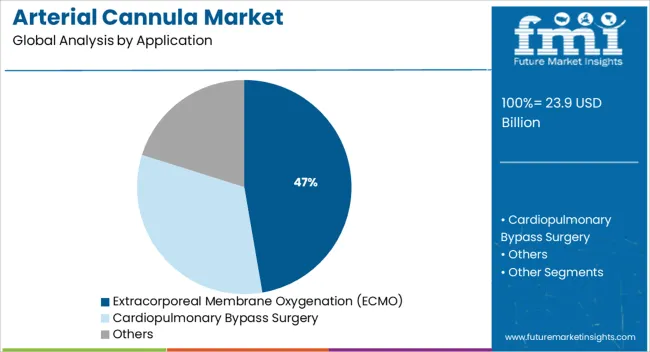
The extracorporeal membrane oxygenation application segment is projected to contribute 47.30% of the total revenue by 2025, establishing it as the most prominent segment. This dominance is attributed to the rising number of patients requiring prolonged cardiac and respiratory support, particularly in cases of severe heart failure, acute respiratory distress, and cardiac surgery.
ECMO procedures rely heavily on durable and efficient arterial cannulas that ensure stable perfusion and reduced risk of complications. Innovations in cannula design to support better flow dynamics and ease of insertion have further contributed to their extensive use.
As ECMO is increasingly adopted in both emergency and elective clinical scenarios, this segment continues to lead the market in terms of both clinical relevance and revenue contribution.
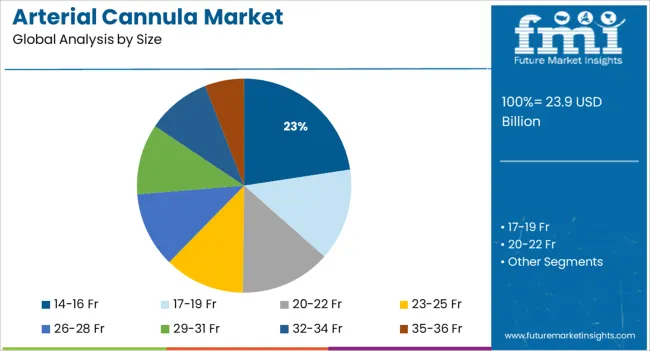
The 14 to 16 Fr size category is expected to account for 22.60% of total market revenue by 2025, positioning it as a key sizing format. This size range offers a balance between flow rate and ease of insertion, making it widely suitable for adult ECMO and surgical applications.
Its preference is driven by clinical guidelines that prioritize efficient oxygenated blood delivery without causing vascular trauma or hemodynamic instability. The versatility and compatibility of this size range with multiple clinical scenarios contribute to its strong market uptake.
As procedural accuracy and patient safety remain critical in arterial access, this size format continues to be widely adopted in intensive care and surgical settings.
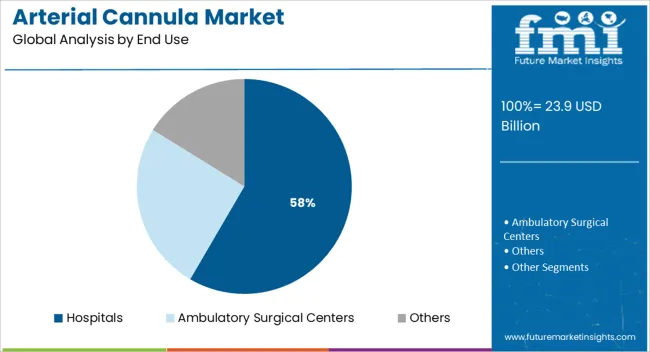
The hospitals segment is anticipated to hold 58.40% of total market revenue by 2025 under the end use category, making it the dominant segment. Hospitals are the primary sites for ECMO and high acuity surgical interventions, requiring specialized equipment and trained personnel.
Their ability to perform complex cardiovascular procedures and manage critical care patients has made them the largest users of arterial cannulas. Investments in upgrading intensive care units and expanding cardiac surgery programs have also supported the growth of this segment.
The hospital environment’s demand for standardized, high quality vascular access devices ensures continued reliance on arterial cannulas, reinforcing its position as the leading end use category in the market.
The global demand for arterial cannula is projected to increase at a CAGR of 6.6% during the forecast period between 2025 and 2035, reaching a total of USD 45.2 Billion in 2035, according to a report from Future Market Insights (FMI). From 2020 to 2025, sales witnessed significant growth, registering a CAGR of 5%.
From 2025 to 2035, the worldwide arterial cannula market is expected to increase significantly during the forecast period. The increasing number of operations, advances in healthcare centers, increased Research and Development investment, rising government financing, and a broad patient pool are projected to drive the global arterial cannula market.
In addition, the rising popularity of minimally invasive surgery (MIS) is expected to fuel the worldwide arterial cannula market. Furthermore, the growth of a number of medical conditions caused by sedentary lifestyles, poor eating habits, alcohol use, smoking, and the development of healthcare systems in developing markets are expected to drive the worldwide arterial cannula market.
Rise in the Frequency of Cardiopulmonary Illnesses to Improve Maintenance and Performance
The rise in the frequency of cardiopulmonary illnesses, which leads to an increase in the number of bypass surgeries done globally, is driving the expansion of the global arterial cannulae market.
Furthermore, growing healthcare expenditures, advancements in healthcare facilities in emerging nations, and the general population's sedentary lifestyle, which leads to heart illnesses and obesity, are the primary drivers driving the market growth of arterial cannulae.
Technological Improvements and Innovations to Accelerate Market Growth
The penetration of regional local companies with low-cost devices is expected to boost the market growth in emerging markets. During the projection period, technological improvements and innovations in the artery cannula such as moveable suture rings, tapered collars, and straight tips are projected to boost the adoption rate of arterial cannulae.
High Cost of Equipment to Hinder Market Growth
The high cost of equipment and a scarcity of trained surgeons are two major factors impeding the growth of the worldwide arterial cannulae market.
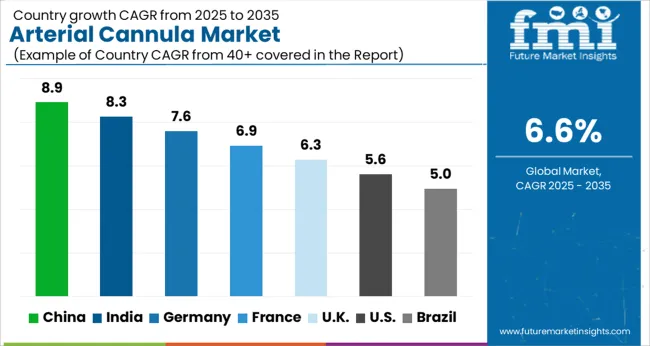
Capitalize on the rising Vehicle Output to Widening Profit Margins
Due to advancements in healthcare facilities, higher Research and Development investment, a huge population base suffering from cardiovascular illnesses, and rising government spending in the healthcare sector, Asia Pacific is expected to grow at a considerable CAGR over the forecast period.
The Asia Pacific cannula market is predicted to rise due to a major increase in the region's older population, which provides a huge patient pool with individuals suffering from chronic conditions such as cardiovascular disease and diabetes. Furthermore, the government's increased attempts to pass favorable healthcare laws, particularly in rural regions, are expected to help this region's market expansion. As per Future Market Insights, the Asia Pacific is expected to grow at a CAGR of 6.1% in the assessment period 2025 to 2035.
Presence of Prominent Market Players to Accelerate Market Growth
Because of the presence of prominent market players and the availability of robust healthcare institutions in the area, North America is likely to contribute considerably to the cannula market during the forecast period. Furthermore, the increased frequency of lifestyle problems in the area is expected to boost regional market development.
Increased awareness of minimally invasive treatments and rising acceptance of cosmetic operations are expected to drive regional market growth in this area. According to the American Society of Plastic Surgeons, cosmetic operations in the United States will cost around USD 22.4 billion in 2024.
North America is expected to dominate the worldwide arterial cannulae market during the projected period, owing to the increasing prevalence of cardiovascular diseases as a result of a sedentary lifestyle, the increasing adoption of minimally invasive techniques, and the rising number of surgeries. As per Future Market Insights, North America is expected to grow at a CAGR of 6.5% in the assessment period 2025 to 2035.
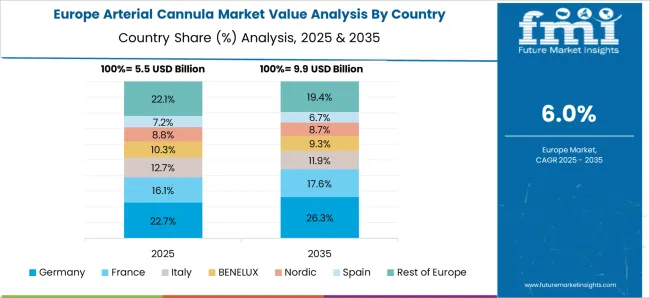
Expanding Government Efforts fuelling sales of Arterial Cannula
In terms of revenue, Europe had the second-largest proportion. Factors such as an aging population, particularly in nations like Italy, expanding government efforts, and advantageous reimbursement situations support the region's growth.
According to MedTech Europe, the European trade group for medical technology, France, for example, established the 2020 to 2025 National Health Strategy for the prevention of cardiovascular risks by encouraging people to change their lifestyle patterns. As per Future Market Insights, Europe is expected to grow at a CAGR of 6.3% in the assessment period 2025 to 2035.
The ECMO sector to enhance Sales Prospects
The sector has been further subdivided based on applications into cardiopulmonary bypass surgery, ECMO, and others. In 2025, the ECMO sector led the worldwide industry. This is due to the high frequency of cardiovascular illnesses and lung failures.
According to the American Lung Association, around 23.9 million Americans will have chronic lung disease by 2025, including COPD, asthma, chronic bronchitis, and emphysema. COPD, an obstructive lung condition that makes breathing difficult over time, has been identified in around 15 million American adults. This shows that the rising prevalence of respiratory disorders, which can lead to lung failure, is a key reason for the ECMO segment's domination.
The Hospitals Segment to Widen Growth Prospects
The global industry has been subdivided into hospitals, Ambulatory Surgical Centers (ASCs), and others based on end-users. In 2025, the hospital's segment led the industry.
This was mostly due to the enormous number of procedures conducted in these settings. Furthermore, the segment's expansion is likely to be fueled by the availability of various sorts of experienced specialists and surgical instruments. The increased number of admissions due to an increase in chronic illnesses is also predicted to drive segment growth throughout the projection period.
Key start-up players in the Arterial Cannula are offering new and innovative product lines to consolidate their market presence, these aforementioned start-ups have left no stone unturned. One of the key Arterial Cannula start-ups is as follows:
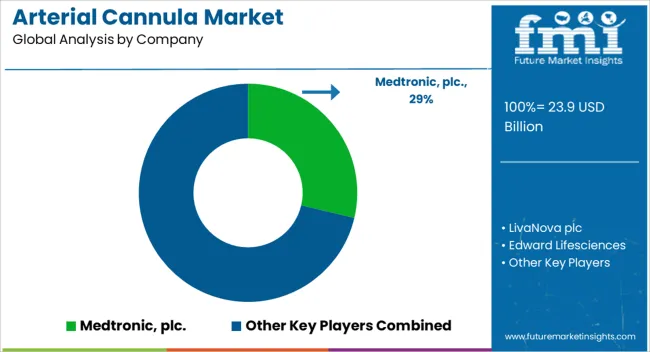
Key businesses are intent on executing strategic activities, such as acquisitions and partnerships, and collaborations that will help them increase their industry footprint and achieve a solid market position. Furthermore, with the introduction of new goods and regulatory clearances, important companies want to extend their portfolio and enhance their position.
Key players in the automotive axles market are Medtronic, plc. LivaNova plc, Edward Lifesciences, Getinge AB, Fresenius Medical Care, BD, Nipro Corp., Andocor, Freelife Medical GmbH, Surgical Holdings, and Kangxin Medical.
Recent Developments:
| Report Attribute | Details |
|---|---|
| Market Value in 2025 | USD 23.9 billion |
| Market Value in 2035 | USD 45.2 billion |
| Growth Rate | CAGR of 6.6% from 2025 to 2035 |
| Base Year for Estimation | 2025 |
| Historical Data | 2020 to 2025 |
| Forecast Period | 2025 to 2035 |
| Quantitative Units | Revenue in US Billion and CAGR from 2025 to 2035 |
| Report Coverage | Revenue Forecast, Company Ranking, Competitive Landscape, Growth Factors, Trends, and Pricing Analysis |
| Segments Covered |
Application, Size, End Use, Region |
| Regions Covered |
North America; Latin America; Europe; South Asia; East Asia; Oceania; Middle East and Africa |
| Key Countries Profiled |
USA, Canada, Brazil, Mexico, Germany, United Kingdom, France, Spain, Italy, China, Japan, South Korea, India, Malaysia, Singapore, Thailand, Australia, New Zealand, GCC Countries, South Africa, Israel |
| Key Companies Profiled |
Medtronic, plc.; LivaNova plc; Edward Lifesciences; Getinge AB; Fresenius Medical Care; BD; Nipro Corp.; Andocor; Freelife Medical GmbH; Surgical Holdings; Kangxin Medical |
| Customization | Available Upon Request |
The global arterial cannula market is estimated to be valued at USD 23.9 billion in 2025.
The market size for the arterial cannula market is projected to reach USD 45.2 billion by 2035.
The arterial cannula market is expected to grow at a 6.6% CAGR between 2025 and 2035.
The key product types in arterial cannula market are extracorporeal membrane oxygenation (ecmo), cardiopulmonary bypass surgery and others.
In terms of size, 14-16 fr segment to command 22.6% share in the arterial cannula market in 2025.


Full Research Suite comprises of:
Market outlook & trends analysis
Interviews & case studies
Strategic recommendations
Vendor profiles & capabilities analysis
5-year forecasts
8 regions and 60+ country-level data splits
Market segment data splits
12 months of continuous data updates
DELIVERED AS:
PDF EXCEL ONLINE
The Pulmonary Arterial Hypertension Treatment Market is segmented by Drug Class and Distribution Channel from 2025 to 2035
Prostatic arterial embolization (PAE) Market
Medical Cannula Market Insights - Growth, Demand & Forecast 2025 to 2035
Nasal Oxygen Cannula Market
MENA Syringes & Cannula Market Size and Share Forecast Outlook 2025 to 2035
High Flow Nasal Cannula Market – Innovations & Forecast 2024-2034
Pediatric Nasal Cannula Market

Thank you!
You will receive an email from our Business Development Manager. Please be sure to check your SPAM/JUNK folder too.
Chat With
MaRIA