Aviation Analytics Market Outlook (2025 to 2035) Size and Share Forecast Outlook 2025 to 2035

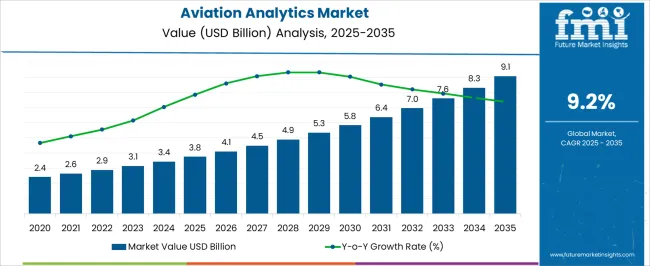
The Aviation Analytics Market is estimated to be valued at USD 3.8 billion in 2025 and is projected to reach USD 9.1 billion by 2035, registering a compound annual growth rate (CAGR) of 9.2% over the forecast period.
Quick Stats for Aviation Analytics Market

  • Aviation Analytics Market Industry Value (2025): USD 3.8 billion
  • Aviation Analytics Market Forecast Value (2035): USD 9.1 billion
  • Aviation Analytics Market Forecast CAGR: 9.2%
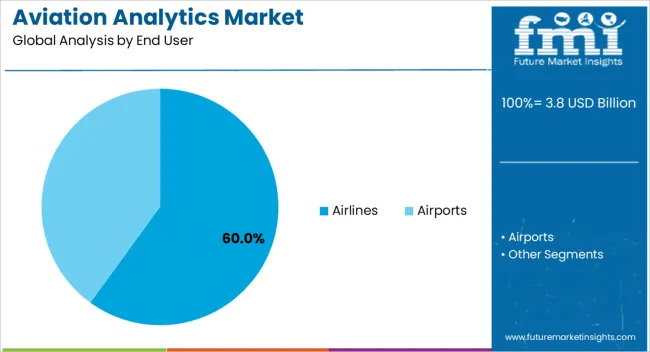
  • Leading Segment in Aviation Analytics Market in 2025: Airlines (60.0%)
  • Key Growth Region in Aviation Analytics Market: North America, Asia-Pacific, Europe
  • Top Key Players in Aviation Analytics Market: IBM Corporation, Oracle Corporation, SAP SE, General Electric, Aviation Analytics Ltd., SAS Institute, Ramco International, Mu-Sigma, Booz Allen Hamilton

Aviation Analytics Market Market Value Analysis

Metric Value
Aviation Analytics Market Estimated Value in (2025 E) USD 3.8 billion
Aviation Analytics Market Forecast Value in (2035 F) USD 9.1 billion
Forecast CAGR (2025 to 2035) 9.2%

Rationale for Segmental Growth in the Aviation Analytics Market

The Aviation Analytics market is witnessing robust expansion driven by the increasing complexity of global air transportation networks and the growing need for operational efficiency. The current market landscape reflects heightened adoption of data-driven solutions that support predictive maintenance, fuel optimization, and passenger experience enhancement. Airlines are investing in analytics platforms that process large volumes of operational and flight data in real time, enabling proactive decision-making and risk mitigation.

The future outlook is shaped by advancements in artificial intelligence and machine learning algorithms that offer deeper insights into maintenance schedules, crew optimization, and delay management. Furthermore, the integration of analytics solutions with existing airline infrastructure is being facilitated by cloud computing and scalable software architectures.

As air traffic volumes rise and regulatory frameworks around safety and environmental compliance evolve, analytics-driven strategies are being prioritized to ensure reliability and cost-efficiency With increasing collaboration between aviation stakeholders, the market is expected to grow steadily, offering actionable intelligence that enhances operational effectiveness and passenger satisfaction.
Segmental Analysis

Insights into the Airlines Segment

Aviation Analytics Market Analysis By End User

The Airlines end-use segment is expected to hold 60.00% of the Aviation Analytics market revenue in 2025, positioning it as the leading sector in the industry. This dominant share is being attributed to the strategic necessity for airlines to leverage data insights across fleet management, scheduling, and customer engagement. Analytics is being used to enhance fuel efficiency, monitor aircraft health, and reduce downtime by anticipating maintenance needs before failures occur.

Airlines are also focusing on optimizing route planning and crew utilization through advanced forecasting tools. The growth of this segment is being supported by the increasing volume of flight operations and a heightened focus on cost reduction and regulatory compliance.

The scalability of analytics solutions has enabled airlines of all sizes to adopt data-driven frameworks, improving operational responsiveness and safety As competition intensifies and passenger expectations rise, analytics has become indispensable in offering personalized services, efficient scheduling, and seamless airport experiences, further driving the segment’s growth.
Insights into the Operations Segment

Aviation Analytics Market Analysis By Verticals

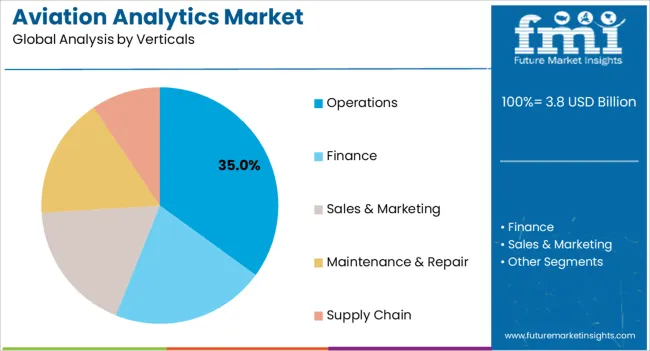
The Operations vertical is projected to account for 35.00% of the Aviation Analytics market revenue in 2025, emerging as a key area of focus within the industry. The prominence of this segment is being driven by the need to streamline operational workflows, reduce delays, and enhance resource allocation across airports and airlines. Analytics solutions are being utilized to monitor maintenance schedules, track equipment performance, and ensure compliance with safety standards, enabling real-time adjustments that improve overall reliability.

Operational analytics is also being applied to optimize crew management, gate assignments, and baggage handling processes, helping reduce turnaround times. The segment’s growth is being supported by the adoption of integrated platforms that combine historical data with predictive algorithms to mitigate disruptions and minimize costs.

As airlines and airports aim to improve on-time performance and reduce environmental impact through efficient fuel usage and optimized routing, the reliance on analytics is expected to increase This trend is reinforcing the importance of operations-focused analytics in supporting strategic planning and operational resilience across the aviation sector.

Which Drivers underpin Aviation Analytics Industry Expansion?

Presently, the vendors of the aviation analytics market are focusing on intelligence and analytics solutions to boost the profitability of their business. This, in turn, is driving the demand for the aviation analytics market. In addition, the growing emphasis on jet fuel management is another factor driving the demand in the aviation analytics market.

The increasing demand for real-time analytics in the aviation industry is positively influencing the demand for aviation analytics. Additionally, increasing centricity in the aviation industry is also one of the major factors contributing to the growth of the aviation analytics market.

Which Factors are Limiting the Growth of the Aviation Analytics Market?

The key challenge faced by the vendors in the aviation analytics market is the dearth of availability of suitable analytical skills. In addition, on certain days, more than two lakh flights operate, making data collection a challenge for the aviation analytics industry. The number of flights that operate is more than the speed of data collection, making it difficult for aviation analytics to use the data for future purposes.
Country-wise Insights

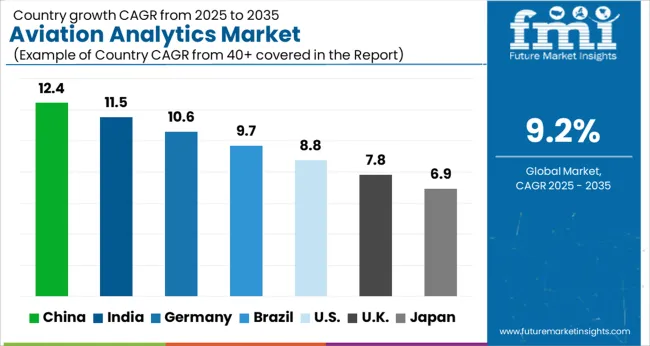
Aviation Analytics Market Cagr Analysis By Country

Countries Revenue Share % (2025)
The United States 18.1%
Germany 8.2%
Japan 5.4%
Australia 4.1%
North America 30.2%
Europe 21.2%
Countries CAGR % (2025 to 2035)
China 8.3%
India 10.2%
The United Kingdom 7.3%

Does North America Hold a Significant Position in the Global Aviation Analytics Market?

Demand for Improving Operational Performance Creating Significant Opportunities

Among various regions, the aviation analytics market in North America is expected to dominate during the forecast period owing to the high adoption of industrial aviation analytics by medium and large size enterprises to improve their operational performance. Moreover, the strong presence of aircraft operators along with key manufacturers of aviation analytics is propelling the integration of the same. Thus, owing to the reasons mentioned above, North America held a market share of 30.25% in 2025.
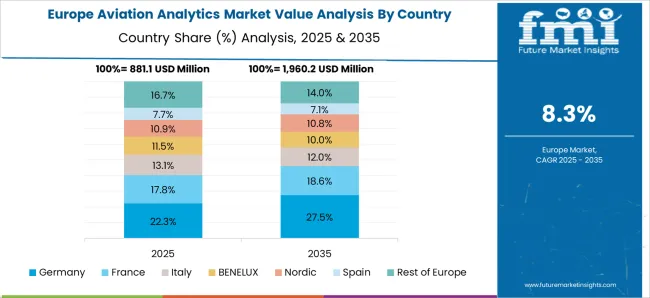
How is the Growth of Europe’s Aviation Analytics Market Likely to Unfold?

Aviation Analytics Market Europe Country Market Share Analysis, 2025 & 2035

Technological Advancements Driving Growth

Countries such as Germany and the United Kingdom are notably contributing to the growth of the aviation analytics market. This is owing to the technological advancements in the aviation analytics sector. Moreover, the increase in travel and tourism along with the modernization of the aviation sector is bolstering the demand for aviation analytics in the region.

The use of artificial intelligence and the Internet of Things has annihilated the requirement for human intervention, making aviation analytics an easy task for companies. Europe held a market share of 21.2% in 2025.

Category-wise Analysis

Category By End User Type
Leading Segment Airlines
Market Share (2025) 65.4%
Category By Verticals Type
Leading Segment Operations
Market Share (2025) 49.3%

Based on end-user type, the airlines segment leads the market as it held a market share of 65.4% in 2025. The vertical category is dominated by the operation segment as it held a market share of 49.3% in 2025.
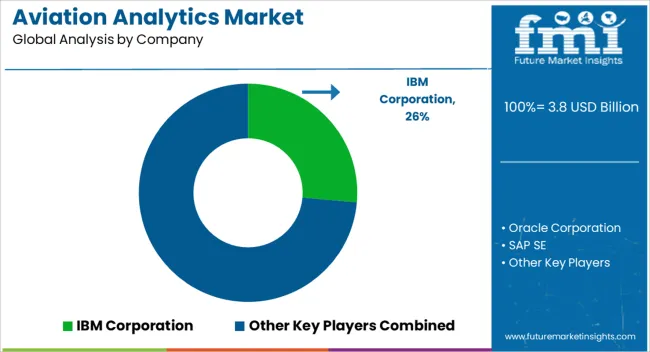
The Start-up Ecosystem: How Key Players are Opening Frontiers for Future Growth?

  • Founded in 2011, SmartSky Networks (formerly known as Jet Pool Ventures) is a USA-based firm that provides LTE-based in-flight connectivity solutions. The firm offers a 4G air-to-ground communication system with patented beamforming technology. It claims to provide 10 times the speed and capacity using 60 MHz of spectrum. To date, the firm has received funding of USD 365 million.
  • Launched in 2013, Flyr is based out of San Francisco (USA) and offers tools to predict and manage the price volatility of travel products. Offerings include FareKeep, SmartRate, and TripPay which help travelers with in-flight or hotel bookings. It offers price prediction, optimization, price, demand, price elasticity forecasting, and travel finance solutions. The company has received overall funding of USD 189 million since the date of its foundation.

Competitive Analysis and Recent Developments

Aviation Analytics Market Analysis By Company

  • Pon. Bike purchased the Dorel Sports branch of Dorel Industries in October 2024 as part of a plan to develop a portfolio of high-end e-bikes that might cover all e-bike segment categories.
  • In Bethesda, Maryland, Pedego launched a new facility in July 2024 that provides a comprehensive selection of e-bike sales, rentals, services, and accessories.
  • David's World Cycle was acquired by Trek Bicycle Corporation in April 2025. To expand its dealer network and support its expansion strategy, Trek Bicycle Corporation bought 21 retail chains.
  • Booz Allen Hamilton has introduced the integration of AI and analytics to solve airline needs through aviation data and flight information.
  • General Electric’s GE Digital has added its flight data & analytics services that work on asset data with flight analytics software. The brand has also launched the aviation insight portal for better understanding.

Key Players Profiled in the Global Market

  • IBM Corporation
  • Oracle Corporation
  • SAP SE
  • General Electric
  • Aviation Analytics Ltd.
  • SAS Institute
  • Ramco International
  • Mu-Sigma
  • Booz Allen Hamilton

Key Segments Covered

By End User:

  • Airlines
  • Airports

By Verticals:

  • Finance
  • Operations
  • Sales & Marketing
  • Maintenance & Repair
  • Supply Chain

Key Regions Covered:

  • North America
    • The United States
    • Canada
  • Latin America
    • Brazil
    • Mexico
    • Rest of Latin America
  • Europe
    • Germany
    • The United Kingdom
    • France
    • Spain
    • Russia
    • Rest of Europe
  • Japan
  • Asia Pacific Excluding Japan
    • China
    • India
    • Malaysia
    • Singapore
    • Australia
    • Rest of Asia Pacific Excluding Japan (APEJ)
  • The Middle East and Africa
    • GCC Countries
    • Israel
    • South Africa
    • The Middle East and Africa (MEA)

Frequently Asked Questions

How big is the aviation analytics market in 2025?

The global aviation analytics market is estimated to be valued at USD 3.8 billion in 2025.

What will be the size of aviation analytics market in 2035?

The market size for the aviation analytics market is projected to reach USD 9.1 billion by 2035.

How much will be the aviation analytics market growth between 2025 and 2035?

The aviation analytics market is expected to grow at a 9.2% CAGR between 2025 and 2035.

What are the key product types in the aviation analytics market?

The key product types in aviation analytics market are airlines and airports.

Which verticals segment to contribute significant share in the aviation analytics market in 2025?

In terms of verticals, operations segment to command 35.0% share in the aviation analytics market in 2025.

Table of Content

  1. Executive Summary
    • Global Market Outlook
    • Demand to side Trends
    • Supply to side Trends
    • Technology Roadmap Analysis
    • Analysis and Recommendations
  2. Market Overview
    • Market Coverage / Taxonomy
    • Market Definition / Scope / Limitations
  3. Market Background
    • Market Dynamics
      • Drivers
      • Restraints
      • Opportunity
      • Trends
    • Scenario Forecast
      • Demand in Optimistic Scenario
      • Demand in Likely Scenario
      • Demand in Conservative Scenario
    • Opportunity Map Analysis
    • Product Life Cycle Analysis
    • Supply Chain Analysis
    • Investment Feasibility Matrix
    • Value Chain Analysis
    • PESTLE and Porter’s Analysis
    • Regulatory Landscape
    • Regional Parent Market Outlook
    • Production and Consumption Statistics
    • Import and Export Statistics
  4. Global Market Analysis 2020 to 2024 and Forecast, 2025 to 2035
    • Historical Market Size Value (USD Million) Analysis, 2020 to 2024
    • Current and Future Market Size Value (USD Million) Projections, 2025 to 2035
      • Y to o to Y Growth Trend Analysis
      • Absolute $ Opportunity Analysis
  5. Global Market Pricing Analysis 2020 to 2024 and Forecast 2025 to 2035
  6. Global Market Analysis 2020 to 2024 and Forecast 2025 to 2035, By Product Form
    • Introduction / Key Findings
    • Historical Market Size Value (USD Million) Analysis By Product Form , 2020 to 2024
    • Current and Future Market Size Value (USD Million) Analysis and Forecast By Product Form , 2025 to 2035
      • Liquid
      • Powder
    • Y to o to Y Growth Trend Analysis By Product Form , 2020 to 2024
    • Absolute $ Opportunity Analysis By Product Form , 2025 to 2035
  7. Global Market Analysis 2020 to 2024 and Forecast 2025 to 2035, By Application
    • Introduction / Key Findings
    • Historical Market Size Value (USD Million) Analysis By Application, 2020 to 2024
    • Current and Future Market Size Value (USD Million) Analysis and Forecast By Application, 2025 to 2035
      • Food & Nutritional Supplements
      • Personal Care & Cosmetics
      • Clinical Nutrition
      • Dialysis Solutions
      • Beverages
      • Cleaners & Detergents
    • Y to o to Y Growth Trend Analysis By Application, 2020 to 2024
    • Absolute $ Opportunity Analysis By Application, 2025 to 2035
  8. Global Market Analysis 2020 to 2024 and Forecast 2025 to 2035, By End User
    • Introduction / Key Findings
    • Historical Market Size Value (USD Million) Analysis By End User, 2020 to 2024
    • Current and Future Market Size Value (USD Million) Analysis and Forecast By End User, 2025 to 2035
      • Food & Beverages Industry
      • Pharmaceuticals Manufacturers
      • Cosmetic Industry
      • Medical Devices Manufacturers
      • Others
    • Y to o to Y Growth Trend Analysis By End User, 2020 to 2024
    • Absolute $ Opportunity Analysis By End User, 2025 to 2035
  9. Global Market Analysis 2020 to 2024 and Forecast 2025 to 2035, By Region
    • Introduction
    • Historical Market Size Value (USD Million) Analysis By Region, 2020 to 2024
    • Current Market Size Value (USD Million) Analysis and Forecast By Region, 2025 to 2035
      • North America
      • Latin America
      • Western Europe
      • Eastern Europe
      • East Asia
      • South Asia and Pacific
      • Middle East & Africa
    • Market Attractiveness Analysis By Region
  10. North America Market Analysis 2020 to 2024 and Forecast 2025 to 2035, By Country
    • Historical Market Size Value (USD Million) Trend Analysis By Market Taxonomy, 2020 to 2024
    • Market Size Value (USD Million) Forecast By Market Taxonomy, 2025 to 2035
      • By Country
        • USA
        • Canada
        • Mexico
      • By Product Form
      • By Application
      • By End User
    • Market Attractiveness Analysis
      • By Country
      • By Product Form
      • By Application
      • By End User
    • Key Takeaways
  11. Latin America Market Analysis 2020 to 2024 and Forecast 2025 to 2035, By Country
    • Historical Market Size Value (USD Million) Trend Analysis By Market Taxonomy, 2020 to 2024
    • Market Size Value (USD Million) Forecast By Market Taxonomy, 2025 to 2035
      • By Country
        • Brazil
        • Chile
        • Rest of Latin America
      • By Product Form
      • By Application
      • By End User
    • Market Attractiveness Analysis
      • By Country
      • By Product Form
      • By Application
      • By End User
    • Key Takeaways
  12. Western Europe Market Analysis 2020 to 2024 and Forecast 2025 to 2035, By Country
    • Historical Market Size Value (USD Million) Trend Analysis By Market Taxonomy, 2020 to 2024
    • Market Size Value (USD Million) Forecast By Market Taxonomy, 2025 to 2035
      • By Country
        • Germany
        • UK
        • Italy
        • Spain
        • France
        • Nordic
        • BENELUX
        • Rest of Western Europe
      • By Product Form
      • By Application
      • By End User
    • Market Attractiveness Analysis
      • By Country
      • By Product Form
      • By Application
      • By End User
    • Key Takeaways
  13. Eastern Europe Market Analysis 2020 to 2024 and Forecast 2025 to 2035, By Country
    • Historical Market Size Value (USD Million) Trend Analysis By Market Taxonomy, 2020 to 2024
    • Market Size Value (USD Million) Forecast By Market Taxonomy, 2025 to 2035
      • By Country
        • Russia
        • Poland
        • Hungary
        • Balkan & Baltic
        • Rest of Eastern Europe
      • By Product Form
      • By Application
      • By End User
    • Market Attractiveness Analysis
      • By Country
      • By Product Form
      • By Application
      • By End User
    • Key Takeaways
  14. East Asia Market Analysis 2020 to 2024 and Forecast 2025 to 2035, By Country
    • Historical Market Size Value (USD Million) Trend Analysis By Market Taxonomy, 2020 to 2024
    • Market Size Value (USD Million) Forecast By Market Taxonomy, 2025 to 2035
      • By Country
        • China
        • Japan
        • South Korea
      • By Product Form
      • By Application
      • By End User
    • Market Attractiveness Analysis
      • By Country
      • By Product Form
      • By Application
      • By End User
    • Key Takeaways
  15. South Asia and Pacific Market Analysis 2020 to 2024 and Forecast 2025 to 2035, By Country
    • Historical Market Size Value (USD Million) Trend Analysis By Market Taxonomy, 2020 to 2024
    • Market Size Value (USD Million) Forecast By Market Taxonomy, 2025 to 2035
      • By Country
        • India
        • ASEAN
        • Australia & New Zealand
        • Rest of South Asia and Pacific
      • By Product Form
      • By Application
      • By End User
    • Market Attractiveness Analysis
      • By Country
      • By Product Form
      • By Application
      • By End User
    • Key Takeaways
  16. Middle East & Africa Market Analysis 2020 to 2024 and Forecast 2025 to 2035, By Country
    • Historical Market Size Value (USD Million) Trend Analysis By Market Taxonomy, 2020 to 2024
    • Market Size Value (USD Million) Forecast By Market Taxonomy, 2025 to 2035
      • By Country
        • Kingdom of Saudi Arabia
        • Other GCC Countries
        • Turkiye
        • South Africa
        • Other African Union
        • Rest of Middle East & Africa
      • By Product Form
      • By Application
      • By End User
    • Market Attractiveness Analysis
      • By Country
      • By Product Form
      • By Application
      • By End User
    • Key Takeaways
  17. Key Countries Market Analysis
    • USA
      • Pricing Analysis
      • Market Share Analysis, 2024
        • By Product Form
        • By Application
        • By End User
    • Canada
      • Pricing Analysis
      • Market Share Analysis, 2024
        • By Product Form
        • By Application
        • By End User
    • Mexico
      • Pricing Analysis
      • Market Share Analysis, 2024
        • By Product Form
        • By Application
        • By End User
    • Brazil
      • Pricing Analysis
      • Market Share Analysis, 2024
        • By Product Form
        • By Application
        • By End User
    • Chile
      • Pricing Analysis
      • Market Share Analysis, 2024
        • By Product Form
        • By Application
        • By End User
    • Germany
      • Pricing Analysis
      • Market Share Analysis, 2024
        • By Product Form
        • By Application
        • By End User
    • UK
      • Pricing Analysis
      • Market Share Analysis, 2024
        • By Product Form
        • By Application
        • By End User
    • Italy
      • Pricing Analysis
      • Market Share Analysis, 2024
        • By Product Form
        • By Application
        • By End User
    • Spain
      • Pricing Analysis
      • Market Share Analysis, 2024
        • By Product Form
        • By Application
        • By End User
    • France
      • Pricing Analysis
      • Market Share Analysis, 2024
        • By Product Form
        • By Application
        • By End User
    • India
      • Pricing Analysis
      • Market Share Analysis, 2024
        • By Product Form
        • By Application
        • By End User
    • ASEAN
      • Pricing Analysis
      • Market Share Analysis, 2024
        • By Product Form
        • By Application
        • By End User
    • Australia & New Zealand
      • Pricing Analysis
      • Market Share Analysis, 2024
        • By Product Form
        • By Application
        • By End User
    • China
      • Pricing Analysis
      • Market Share Analysis, 2024
        • By Product Form
        • By Application
        • By End User
    • Japan
      • Pricing Analysis
      • Market Share Analysis, 2024
        • By Product Form
        • By Application
        • By End User
    • South Korea
      • Pricing Analysis
      • Market Share Analysis, 2024
        • By Product Form
        • By Application
        • By End User
    • Russia
      • Pricing Analysis
      • Market Share Analysis, 2024
        • By Product Form
        • By Application
        • By End User
    • Poland
      • Pricing Analysis
      • Market Share Analysis, 2024
        • By Product Form
        • By Application
        • By End User
    • Hungary
      • Pricing Analysis
      • Market Share Analysis, 2024
        • By Product Form
        • By Application
        • By End User
    • Kingdom of Saudi Arabia
      • Pricing Analysis
      • Market Share Analysis, 2024
        • By Product Form
        • By Application
        • By End User
    • Turkiye
      • Pricing Analysis
      • Market Share Analysis, 2024
        • By Product Form
        • By Application
        • By End User
    • South Africa
      • Pricing Analysis
      • Market Share Analysis, 2024
        • By Product Form
        • By Application
        • By End User
  18. Market Structure Analysis
    • Competition Dashboard
    • Competition Benchmarking
    • Market Share Analysis of Top Players
      • By Regional
      • By Product Form
      • By Application
      • By End User
  19. Competition Analysis
    • Competition Deep Dive
      • Corbion N.V.
        • Overview
        • Product Portfolio
        • Profitability by Market Segments (Product/Age /Sales Channel/Region)
        • Sales Footprint
        • Strategy Overview
          • Marketing Strategy
          • Product Strategy
          • Channel Strategy
      • Jungbunzlauer Suisse AG
      • Galactic S.A.
      • Merck KGaA
      • Jindan Lactic Acid Technology Co., Ltd.
      • Cargill, Inc.
      • Henan Xinghan Biotechnology
      • Musashino Chemical Laboratory
      • Shandong Baisheng Biotechnology Co., Ltd.
      • Qingdao Abel Technology Co., Ltd.
  20. Assumptions & Acronyms Used
  21. Research Methodology

List of Tables

  • Table 1: Global Market Value (USD Million) Forecast by Region, 2020 to 2035
  • Table 2: Global Market Value (USD Million) Forecast by Product Form , 2020 to 2035
  • Table 3: Global Market Value (USD Million) Forecast by Application, 2020 to 2035
  • Table 4: Global Market Value (USD Million) Forecast by End User, 2020 to 2035
  • Table 5: North America Market Value (USD Million) Forecast by Country, 2020 to 2035
  • Table 6: North America Market Value (USD Million) Forecast by Product Form , 2020 to 2035
  • Table 7: North America Market Value (USD Million) Forecast by Application, 2020 to 2035
  • Table 8: North America Market Value (USD Million) Forecast by End User, 2020 to 2035
  • Table 9: Latin America Market Value (USD Million) Forecast by Country, 2020 to 2035
  • Table 10: Latin America Market Value (USD Million) Forecast by Product Form , 2020 to 2035
  • Table 11: Latin America Market Value (USD Million) Forecast by Application, 2020 to 2035
  • Table 12: Latin America Market Value (USD Million) Forecast by End User, 2020 to 2035
  • Table 13: Western Europe Market Value (USD Million) Forecast by Country, 2020 to 2035
  • Table 14: Western Europe Market Value (USD Million) Forecast by Product Form , 2020 to 2035
  • Table 15: Western Europe Market Value (USD Million) Forecast by Application, 2020 to 2035
  • Table 16: Western Europe Market Value (USD Million) Forecast by End User, 2020 to 2035
  • Table 17: Eastern Europe Market Value (USD Million) Forecast by Country, 2020 to 2035
  • Table 18: Eastern Europe Market Value (USD Million) Forecast by Product Form , 2020 to 2035
  • Table 19: Eastern Europe Market Value (USD Million) Forecast by Application, 2020 to 2035
  • Table 20: Eastern Europe Market Value (USD Million) Forecast by End User, 2020 to 2035
  • Table 21: East Asia Market Value (USD Million) Forecast by Country, 2020 to 2035
  • Table 22: East Asia Market Value (USD Million) Forecast by Product Form , 2020 to 2035
  • Table 23: East Asia Market Value (USD Million) Forecast by Application, 2020 to 2035
  • Table 24: East Asia Market Value (USD Million) Forecast by End User, 2020 to 2035
  • Table 25: South Asia and Pacific Market Value (USD Million) Forecast by Country, 2020 to 2035
  • Table 26: South Asia and Pacific Market Value (USD Million) Forecast by Product Form , 2020 to 2035
  • Table 27: South Asia and Pacific Market Value (USD Million) Forecast by Application, 2020 to 2035
  • Table 28: South Asia and Pacific Market Value (USD Million) Forecast by End User, 2020 to 2035
  • Table 29: Middle East & Africa Market Value (USD Million) Forecast by Country, 2020 to 2035
  • Table 30: Middle East & Africa Market Value (USD Million) Forecast by Product Form , 2020 to 2035
  • Table 31: Middle East & Africa Market Value (USD Million) Forecast by Application, 2020 to 2035
  • Table 32: Middle East & Africa Market Value (USD Million) Forecast by End User, 2020 to 2035

List of Figures

  • Figure 1: Global Market Pricing Analysis
  • Figure 2: Global Market Value (USD Million) Forecast 2020-2035
  • Figure 3: Global Market Value Share and BPS Analysis by Product Form , 2025 and 2035
  • Figure 4: Global Market Y to o to Y Growth Comparison by Product Form , 2025-2035
  • Figure 5: Global Market Attractiveness Analysis by Product Form
  • Figure 6: Global Market Value Share and BPS Analysis by Application, 2025 and 2035
  • Figure 7: Global Market Y to o to Y Growth Comparison by Application, 2025-2035
  • Figure 8: Global Market Attractiveness Analysis by Application
  • Figure 9: Global Market Value Share and BPS Analysis by End User, 2025 and 2035
  • Figure 10: Global Market Y to o to Y Growth Comparison by End User, 2025-2035
  • Figure 11: Global Market Attractiveness Analysis by End User
  • Figure 12: Global Market Value (USD Million) Share and BPS Analysis by Region, 2025 and 2035
  • Figure 13: Global Market Y to o to Y Growth Comparison by Region, 2025-2035
  • Figure 14: Global Market Attractiveness Analysis by Region
  • Figure 15: North America Market Incremental Dollar Opportunity, 2025-2035
  • Figure 16: Latin America Market Incremental Dollar Opportunity, 2025-2035
  • Figure 17: Western Europe Market Incremental Dollar Opportunity, 2025-2035
  • Figure 18: Eastern Europe Market Incremental Dollar Opportunity, 2025-2035
  • Figure 19: East Asia Market Incremental Dollar Opportunity, 2025-2035
  • Figure 20: South Asia and Pacific Market Incremental Dollar Opportunity, 2025-2035
  • Figure 21: Middle East & Africa Market Incremental Dollar Opportunity, 2025-2035
  • Figure 22: North America Market Value Share and BPS Analysis by Country, 2025 and 2035
  • Figure 23: North America Market Value Share and BPS Analysis by Product Form , 2025 and 2035
  • Figure 24: North America Market Y to o to Y Growth Comparison by Product Form , 2025-2035
  • Figure 25: North America Market Attractiveness Analysis by Product Form
  • Figure 26: North America Market Value Share and BPS Analysis by Application, 2025 and 2035
  • Figure 27: North America Market Y to o to Y Growth Comparison by Application, 2025-2035
  • Figure 28: North America Market Attractiveness Analysis by Application
  • Figure 29: North America Market Value Share and BPS Analysis by End User, 2025 and 2035
  • Figure 30: North America Market Y to o to Y Growth Comparison by End User, 2025-2035
  • Figure 31: North America Market Attractiveness Analysis by End User
  • Figure 32: Latin America Market Value Share and BPS Analysis by Country, 2025 and 2035
  • Figure 33: Latin America Market Value Share and BPS Analysis by Product Form , 2025 and 2035
  • Figure 34: Latin America Market Y to o to Y Growth Comparison by Product Form , 2025-2035
  • Figure 35: Latin America Market Attractiveness Analysis by Product Form
  • Figure 36: Latin America Market Value Share and BPS Analysis by Application, 2025 and 2035
  • Figure 37: Latin America Market Y to o to Y Growth Comparison by Application, 2025-2035
  • Figure 38: Latin America Market Attractiveness Analysis by Application
  • Figure 39: Latin America Market Value Share and BPS Analysis by End User, 2025 and 2035
  • Figure 40: Latin America Market Y to o to Y Growth Comparison by End User, 2025-2035
  • Figure 41: Latin America Market Attractiveness Analysis by End User
  • Figure 42: Western Europe Market Value Share and BPS Analysis by Country, 2025 and 2035
  • Figure 43: Western Europe Market Value Share and BPS Analysis by Product Form , 2025 and 2035
  • Figure 44: Western Europe Market Y to o to Y Growth Comparison by Product Form , 2025-2035
  • Figure 45: Western Europe Market Attractiveness Analysis by Product Form
  • Figure 46: Western Europe Market Value Share and BPS Analysis by Application, 2025 and 2035
  • Figure 47: Western Europe Market Y to o to Y Growth Comparison by Application, 2025-2035
  • Figure 48: Western Europe Market Attractiveness Analysis by Application
  • Figure 49: Western Europe Market Value Share and BPS Analysis by End User, 2025 and 2035
  • Figure 50: Western Europe Market Y to o to Y Growth Comparison by End User, 2025-2035
  • Figure 51: Western Europe Market Attractiveness Analysis by End User
  • Figure 52: Eastern Europe Market Value Share and BPS Analysis by Country, 2025 and 2035
  • Figure 53: Eastern Europe Market Value Share and BPS Analysis by Product Form , 2025 and 2035
  • Figure 54: Eastern Europe Market Y to o to Y Growth Comparison by Product Form , 2025-2035
  • Figure 55: Eastern Europe Market Attractiveness Analysis by Product Form
  • Figure 56: Eastern Europe Market Value Share and BPS Analysis by Application, 2025 and 2035
  • Figure 57: Eastern Europe Market Y to o to Y Growth Comparison by Application, 2025-2035
  • Figure 58: Eastern Europe Market Attractiveness Analysis by Application
  • Figure 59: Eastern Europe Market Value Share and BPS Analysis by End User, 2025 and 2035
  • Figure 60: Eastern Europe Market Y to o to Y Growth Comparison by End User, 2025-2035
  • Figure 61: Eastern Europe Market Attractiveness Analysis by End User
  • Figure 62: East Asia Market Value Share and BPS Analysis by Country, 2025 and 2035
  • Figure 63: East Asia Market Value Share and BPS Analysis by Product Form , 2025 and 2035
  • Figure 64: East Asia Market Y to o to Y Growth Comparison by Product Form , 2025-2035
  • Figure 65: East Asia Market Attractiveness Analysis by Product Form
  • Figure 66: East Asia Market Value Share and BPS Analysis by Application, 2025 and 2035
  • Figure 67: East Asia Market Y to o to Y Growth Comparison by Application, 2025-2035
  • Figure 68: East Asia Market Attractiveness Analysis by Application
  • Figure 69: East Asia Market Value Share and BPS Analysis by End User, 2025 and 2035
  • Figure 70: East Asia Market Y to o to Y Growth Comparison by End User, 2025-2035
  • Figure 71: East Asia Market Attractiveness Analysis by End User
  • Figure 72: South Asia and Pacific Market Value Share and BPS Analysis by Country, 2025 and 2035
  • Figure 73: South Asia and Pacific Market Value Share and BPS Analysis by Product Form , 2025 and 2035
  • Figure 74: South Asia and Pacific Market Y to o to Y Growth Comparison by Product Form , 2025-2035
  • Figure 75: South Asia and Pacific Market Attractiveness Analysis by Product Form
  • Figure 76: South Asia and Pacific Market Value Share and BPS Analysis by Application, 2025 and 2035
  • Figure 77: South Asia and Pacific Market Y to o to Y Growth Comparison by Application, 2025-2035
  • Figure 78: South Asia and Pacific Market Attractiveness Analysis by Application
  • Figure 79: South Asia and Pacific Market Value Share and BPS Analysis by End User, 2025 and 2035
  • Figure 80: South Asia and Pacific Market Y to o to Y Growth Comparison by End User, 2025-2035
  • Figure 81: South Asia and Pacific Market Attractiveness Analysis by End User
  • Figure 82: Middle East & Africa Market Value Share and BPS Analysis by Country, 2025 and 2035
  • Figure 83: Middle East & Africa Market Value Share and BPS Analysis by Product Form , 2025 and 2035
  • Figure 84: Middle East & Africa Market Y to o to Y Growth Comparison by Product Form , 2025-2035
  • Figure 85: Middle East & Africa Market Attractiveness Analysis by Product Form
  • Figure 86: Middle East & Africa Market Value Share and BPS Analysis by Application, 2025 and 2035
  • Figure 87: Middle East & Africa Market Y to o to Y Growth Comparison by Application, 2025-2035
  • Figure 88: Middle East & Africa Market Attractiveness Analysis by Application
  • Figure 89: Middle East & Africa Market Value Share and BPS Analysis by End User, 2025 and 2035
  • Figure 90: Middle East & Africa Market Y to o to Y Growth Comparison by End User, 2025-2035
  • Figure 91: Middle East & Africa Market Attractiveness Analysis by End User
  • Figure 92: Global Market - Tier Structure Analysis
  • Figure 93: Global Market - Company Share Analysis
Dashboard
Dashboard
Dashboard
Dashboard
Dashboard
Dashboard

Full Research Suite comprises of:

Market outlook & trends analysis

Market outlook & trends analysis

Interviews & case studies

Interviews & case studies

Strategic recommendations

Strategic recommendations

Vendor profiles & capabilities analysis

Vendor profiles & capabilities analysis

5-year forecasts

5-year forecasts

8 regions and 60+ country-level data splits

8 regions and 60+ country-level data splits

Market segment data splits

Market segment data splits

12 months of continuous data updates

12 months of continuous data updates

DELIVERED AS:

PDF EXCEL ONLINE

Full Research Suite


$5000

$7500

$10000

Buy Report Now
Similar Industry Reports

Similar Industry Reports

Aviation Life Rafts Market

Aviation Life Rafts Market Size and Share Forecast Outlook 2025 to 2035

Aviation Power Supply Market

Aviation Power Supply Market Size and Share Forecast Outlook 2025 to 2035

Aviation Compliance Monitoring Software Market

Aviation Compliance Monitoring Software Market Size and Share Forecast Outlook 2025 to 2035

Aviation Cloud Market

Aviation Cloud Market Size and Share Forecast Outlook 2025 to 2035

Aviation Asset Management Market

Aviation Asset Management Market Size and Share Forecast Outlook 2025 to 2035

Aviation Fuel Additives Market

Aviation Fuel Additives Market Growth 2025 to 2035

Aviation Test Equipment Market

Aviation Test Equipment Market Growth - Trends & Forecast 2025 to 2035

Aviation Titanium Alloy Market

Aviation Titanium Alloy Market Analysis by Type, Application, Microstructure, and Region: Forecast for 2025 to 2035

Aviation Connector Market

Aviation Connector Market

Aviation IoT Solutions Market

Aviation IoT Solutions Market

Aviation Cabin Cleaning Chemical Market

Aviation Cabin Cleaning Chemical Market

Aviation Biofuel Market

Aviation Biofuel Market

Aviation Gas Turbines Market

Aviation Gas Turbines Market

Aviation Lubricants Market

Aviation Lubricants Market

IoT In Aviation Market

IoT In Aviation Market Size and Share Forecast Outlook 2025 to 2035

Aerospace Aviation Fuels Market

Aerospace Aviation Fuels Market

Sustainable Aviation Fuel Market

Sustainable Aviation Fuel Market Growth – Trends & Forecast 2025 to 2035

Adoption Analysis of 5G in Aviation Market

5G in Aviation Market – Future of In-Flight Connectivity

Analytics Of Things Market

Analytics Of Things Market Size and Share Forecast Outlook 2025 to 2035

Analytics as a Service (AaaS) Market

Analytics as a Service (AaaS) Market - Growth & Forecast 2025 to 2035

Future Market Insights

Aviation Analytics Market

Chat With MaRIA

Chat With

MaRIA

Hi There, I am MaRIA, Your Market Research Intelligence Assistant. How may I help you?