The aviation test equipment market will demonstrate moderate expansion between 2025 and 2035 because of rising aircraft production and growing maintenance precision demands and enhancing usage of advanced electronics across military and commercial aviation domains. Safety testing for avionics and electrical systems together with propulsion components relies on these system elements which evaluate performance and functionality and safety aspects.
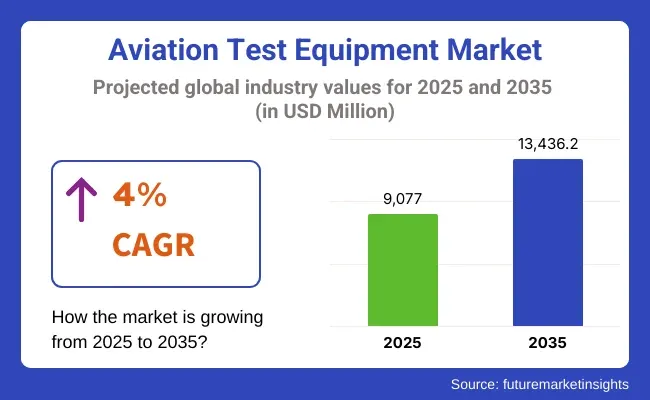
The market progresses due to aviation industry requirements regarding safety compliance and operational reliability. The market will experience a 4% CAGR from 2025 until it reaches a value of USD 13,436.2 million in 2035 according to predicted market projections.
The combination of fleet updates with increasing commercial aviation traffic patterns along with strict testing requirements drives investments toward next-generation test systems. Costs remain elevated along with calibration difficulties but industry adjustments using modular test benches and automated diagnosis and digital simulation solutions improve overall market performance.
Supplier companies prioritize creating test solutions that combine multiple functions within small space constraints together with software upgrade capabilities for different customer segments including OEMs MROs and defense contractors. Research and Development initiatives supported by governments continue to demonstrate how test equipment remains essential throughout all phases of flight and mission-critical diagnostics.
Different segments of the aviation test equipment market can be determined by system type together with platform due to their effects on test capabilities throughout aviation sectors. The market contains electrical and hydraulic as well as pneumatic and power test systems while electrical and avionics test solutions dominate because aircraft undergo rapid digitalization.
These technical systems enable accurate diagnostic determination and calibration operations during assembly line work and field operations. Different types of aircraft such as fixed-wing machines and rotary-wing vehicles and unmanned aerial vehicles (UAVs) need personalized testing to maintain their operational readiness and airworthiness according to evolving aviation standards.
Aviation testing equipment market remains strong growth segment with major corps such as airframe manufacturers, maintenance and overhaul facilities, and military operators investing in technology and added solutions to prevent flight accidents, while reducing down time, maintaining air systems reliability. Aircraft testing equipment across electrical, hydraulic, pneumatic, and power systems.
With regard to product categories, the market is led by electrical aviation test equipment, which facilitates the inspection and maintenance of critical avionics, wiring, and electrical subsystems. The demand-side market has the defense/military sector as its dominant end-user segment since military aircraft fleets demand consistent testing of systems to ensure mission readiness and adherence to strict safety standards. Combined, these segments represent the backbone of a market underpinned by precision testing, rapid diagnostics and long-term operational efficiency.
As civilian air fleets modernize and military air forces adopt increasingly digitally complex platforms, there is an ongoing requirement for rugged, portable, digital testing equipment. However, central to this evolution, integrating electrical testing systems and military aviation requirements, are the maintenance teams to ensure system performance and reduce operational risks.
Electrical aviation test equipment leads product segment by supporting avionics integrity and fault isolation
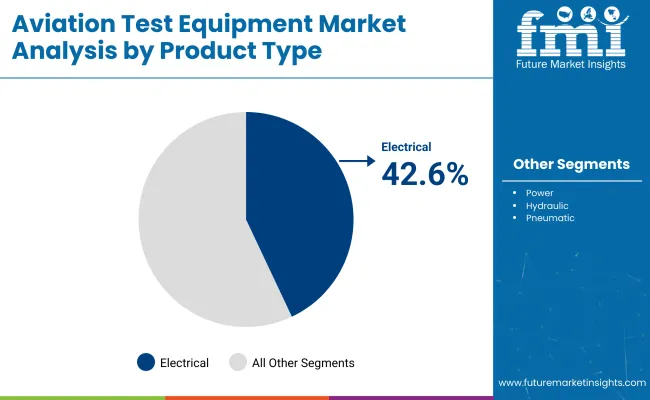
The electrical aviation test equipment segment is the largest among these, offering essential tools for validating the function and reliability of aircraft electrical systems. Some components of these systems are avionics, electrical distribution networks, wiring harnesses, radar systems, and data communications interfaces.
From the smallest electronics to large machinery, technicians can measure voltage, current, resistance, and high-and-low signal integrity with electrical test equipment. They assist in detecting malfunctions below the operational limits before they result in a hazard to aircraft performance occurring in-flight.
Digital mustimeters, loop testers, circuit analysers, and automatic test equipment (ATE) are essential for aircraft maintenance crews to confirm electrical circuit health, identify short circuits, and calibrate electronic control units. And as fly-by-wire systems, electronic flight instrumentation, and advanced navigation systems become more integrated, electrical testing is more important than ever.
Manufacturers have responded to this changing environment with ruggedized, lightweight, software technology-integrated test equipment design for modern aircraft platforms. Overall, as commercial and military aircraft will continue to advance, electrical test equipment will still be one of the foundation stones of aviation maintenance, repair, and overhaul (MRO) operations across the globe.
Defense/Military sector dominates end user segment by ensuring aircraft readiness and regulatory compliance
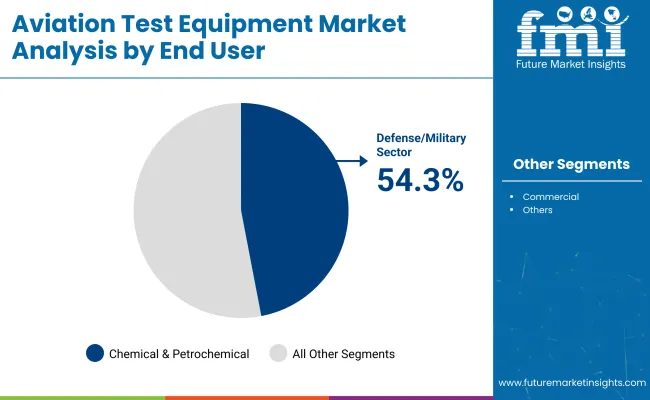
The aviation test equipment market has been driven by growing defense and military sector end-user segment which is attributed to high-performance standards and strict maintenance of military aircraft. Military operators rely on accurate, field-deployable test equipment to validate essential flight systems, weapons integration, communication modules and engine control units.
Military aircraft are subject to extensive testing in extreme operating conditions, not found outside the military: in unprotected environments and during combat readiness evaluations, unlike commercial fleets. This drives the demand for rugged, multi-functional test equipment that can handle legacy aircraft as well as next-generation fighters, drones and surveillance platforms.
Defense procurement agencies are using advanced test benches, software-powered diagnostics and modularized equipment to reduce the turnaround time for maintenance and prolong the life of expensive airframes. Moreover, test equipment must conform to NATO standards and interoperability specifications (for coalition-based operations).
Providing high-reliability testing tools is a matter of national security in which failure has no room when it comes to defense missions. Geopolitical tensions are not abating, and air forces are progressively updating and modernising their fleets, meaning demand for aviation test equipment will be led by defense for the foreseeable future.
Equipment Obsolescence and Integration with Next-Gen Aircraft Systems
One of the biggest challenges facing the aviation test equipment market is the increasing misalignment between legacy testing tools and modern avionics. The evolution of aircraft systems towards digital flight controls, composite structures, and advanced sensors challenges the measurement accuracy, test rig compatibility, and scalability of traditional test rigs.
Countless operators have to make do with older testers because staff have money and/or certification cycles are too long, which creates inefficiency and risk during diagnostics. This is compounded by the need for regular calibration, considerable maintenance cost, and operator training. These issues are particularly acute when it comes to military and commercial sectors experiencing extensive avionics modernisation.
Rise of Automated, Modular, and AI-Enabled Test Platforms
Even with older systems, the market has been gaining traction, particularly with the growth of modular and automated test solutions designed to help mitigate human error and increase test efficiency. To enable faster maintenance cycles, OEMs and MROs are increasingly turning to portable, software-defined testers for hydraulic, pneumatic, and electronic systems.
Such predictive maintenance across aviation fleets is being transformed with the help of AI-driven fault diagnostics and cloud-based data analytics. Global deliveries of aircraft continue to rise, the aircraft MRO infrastructure is expanding and the various military platforms exploring the utility of new defense modernization programs also offer higher demand potential for high-speed scalable and multi-functional test equipment. This change further establishes the market's function in next-gen airborne cap sourced architectures.
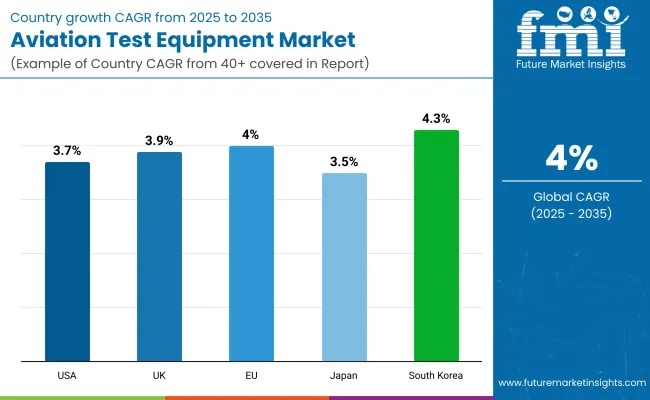
The USA is a leading market for aviation test equipment, supported by the country’s large airline sector and defense modernization initiatives, and its extensive research facilities. The needs from USA Air Force, NASA, and the major aircraft OEMs all share a focus on continuous investment in high precision test benches, avionics test systems, and high Washington automated diagnostic platforms.
Also driving growth is the maintenance, repair and overhaul (MRO) sector, which depends on test equipment to confirm that flight critical systems meet FAA standards. With the increasing demand for electric and hybrid aircraft, the USA market is moving toward next-gen testing systems for power electronics and flight control units.
| Country | CAGR (2025 to 2035) |
|---|---|
| USA | 3.7% |
The United Kingdom aviation test equipment market is projected to register a steady growth owing to the country's strong aerospace and defense manufacturing base. British MRO providers and aircraft manufacturers has complex test rigs and automated ground testing equipment to support both military and civil fleets.
The UK is already building specialized test platforms for electronic actuators, battery systems, and high-frequency signal diagnostics, but with the growing demand for sustainable aviation and electric propulsion systems. Public-private R&D collaboration should maintain an innovation-oriented market.
| Country | CAGR (2025 to 2035) |
|---|---|
| UK | 3.9% |
European Union initiatives are enhancing the aviation test equipment market based on flagship aircraft programs from Airbus, Dassault, and other regional players. Avionics, radar, and communication test systems have strong demand especially as European countries are updating their military aircraft and air traffic infrastructure.
With EASA mandatory directives, test automation and remote diagnostics become essential to reduce aircraft downtime and guarantee compliance. Digital Twin technology has even grown to integrate into test platforms that facilitate real-time flight and stress scenarios across Europe.
| Region | CAGR (2025 to 2035) |
|---|---|
| European Union | 4.0% |
Japan is making gradual progress in its aviation test equipment market, primarily on the back of the growth of its domestic MRO industry and focus on aircraft reliability. Japan’s fastidious attitude towards engineering serves the market, requiring high-accuracy calibration and performance verification tools across defence and commercial fleets.
Japanese companies are even creating compact test platforms for electric aviation components, such as battery management systems and onboard computing modules. An increase in cost-effective aerospace R&D support from the government will help bolster long-term growth prospects for bespoke testing systems.
| Country | CAGR (2025 to 2035) |
|---|---|
| Japan | 3.5% |
South Korea expands air defense systems, including developing indigenous aircraft programs such as KF-21, leading to significant growth in its aviation test equipment market. Local aerospace companies are investing in test stations for advanced avionics and flight control to facilitate domestic assembly and integration.
MRO facilities are also modernising their diagnostic capabilities, with portable multi-function test sets. This increased interest in UAVs and hybrid aircraft has resulted in a need for lightweight modular test systems with improved fault detection.
| Country | CAGR (2025 to 2035) |
|---|---|
| South Korea | 4.3% |
The worldwide aviation test equipment market maintains essential functions for aviation flight safety and aircraft performance assessment and regulatory compliance between military and commercial aviation operations. The test systems evaluate aircraft-based equipment like avionics as well as electrical systems and hydraulic and pneumatic assemblies and propulsion elements.
Precise rugged multifunctional test solutions gain increased demand because of modern aircraft complexity and advanced avionic integration within modernized air fleets. The market sees key industry participants using automated testing platforms as well as portable diagnostics tools and software-based simulations to minimize equipment downtime while improving precision levels.
Aerospace test system manufacturers together with defense contractors and engineering firms targeting original equipment manufacturers battle each other for reliability along with innovation and extended lifecycle maintenance.
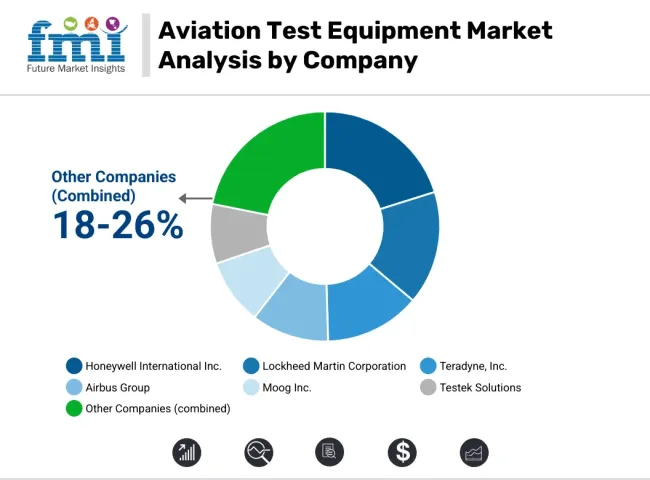
Honeywell International Inc.
Honeywell leads the aviation test equipment market with its advanced avionics and system testing solutions. Its modular benches and diagnostic platforms serve both OEMs and MRO operators, streamlining certification and post-maintenance verification.
Lockheed Martin Corporation
Lockheed Martin develops high-fidelity electronic test and simulation platforms for defense aircraft. Its technologies enable functional validation of communication, radar, and guidance systems critical to mission readiness.
Teradyne, Inc.
Teradyne’s automated test equipment offers precise, programmable validation for embedded systems and electronic modules in aircraft. The company's ATE platforms enhance speed, scalability, and support for modern flight electronics.
Airbus Group
Airbus provides aircraft-specific test benches and simulation suites designed for in-house and external system qualification. Its tools are optimized for propulsion testing, flight control systems, and hydraulic component validation.
Moog Inc.
Moog delivers specialized test stands and dynamic simulation tools for aerospace actuation systems. Its test platforms cater to both traditional aircraft and emerging UAV markets, emphasizing accuracy and control feedback.
Testek Solutions
Testek is known for its portable and fixed test stands supporting a wide range of aircraft systems, including fuel, turbine, and flight control mechanisms. Its flexible systems are ideal for ground support and field operations.
Other Key Players (18-26% Combined)
A range of additional manufacturers and service providers support global aviation test needs through niche solutions, calibration services, and diagnostics:
The overall market size for the aviation test equipment market was USD 9,077 million in 2025.
The aviation test equipment market is expected to reach USD 13,436.2 million in 2035.
The increasing need for precise performance assessment in aircraft systems, rising investments in aerospace and defense infrastructure, and growing use of electrical test systems in defense applications fuel the aviation test equipment market during the forecast period.
The top 5 countries driving the development of the aviation test equipment market are the USA, UK, European Union, Japan, and South Korea.
Electrical test systems and defense applications lead market growth to command a significant share over the assessment period.


Full Research Suite comprises of:
Market outlook & trends analysis
Interviews & case studies
Strategic recommendations
Vendor profiles & capabilities analysis
5-year forecasts
8 regions and 60+ country-level data splits
Market segment data splits
12 months of continuous data updates
DELIVERED AS:
PDF EXCEL ONLINE
Aviation Life Rafts Market Size and Share Forecast Outlook 2025 to 2035
Aviation Power Supply Market Size and Share Forecast Outlook 2025 to 2035
Aviation Compliance Monitoring Software Market Size and Share Forecast Outlook 2025 to 2035
Aviation Analytics Market Size and Share Forecast Outlook 2025 to 2035
Aviation Cloud Market Size and Share Forecast Outlook 2025 to 2035
Aviation Asset Management Market Size and Share Forecast Outlook 2025 to 2035
Aviation Fuel Additives Market Growth 2025 to 2035
Aviation Titanium Alloy Market Analysis by Type, Application, Microstructure, and Region: Forecast for 2025 to 2035
Aviation Connector Market
Aviation IoT Solutions Market
Aviation Cabin Cleaning Chemical Market
Aviation Biofuel Market
Aviation Gas Turbines Market
Aviation Lubricants Market
IoT In Aviation Market Size and Share Forecast Outlook 2025 to 2035
Aerospace Aviation Fuels Market
Sustainable Aviation Fuel Market Growth – Trends & Forecast 2025 to 2035
Adoption Analysis of 5G in Aviation Market Size and Share Forecast Outlook 2025 to 2035
Testosterone Test Market Size and Share Forecast Outlook 2025 to 2035
Test rig Market Size and Share Forecast Outlook 2025 to 2035

Thank you!
You will receive an email from our Business Development Manager. Please be sure to check your SPAM/JUNK folder too.
Chat With
MaRIA