Reports

- Global Locations -

Headquarters

Future Market Insights, Inc.

Christiana Corporate, 200
Continental Drive, Suite 401,
Newark, Delaware - 19713,
United States

T: +1-845-579-5705

Americas

Future Market Insights, Inc.

616 Corporate Way, Suite 2-9018,
Valley Cottage, NY 10989, United States

T: +1-347-918-3531

MEA

Future Market Insights

1602-6 Jumeirah Bay X2 Tower, Plot No: JLT-PH2-X2A,
Jumeirah Lakes Towers, Dubai,
United Arab Emirates

Europe

Future Market Insights

3rd Floor, 207 Regent Street,
W1B 3HH London
United Kingdom

T: + 44 (0) 20 8123 9659
D: +44 (0) 20 3287 4268

Asia Pacific

Future Market Insights

IndiaLand Global Tech Park, Unit UG-1, Behind Grand HighStreet, Phase 1, Hinjawadi, MH, Pune – 411057, India

Aviation Fuel Additives Market Snapshot (2023 to 2033)

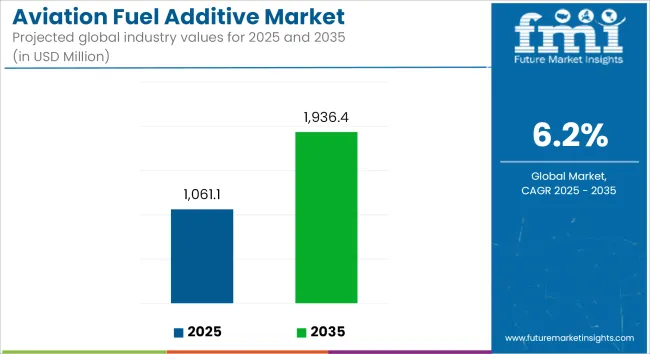
The global aviation fuel additives market is projected to attain a valuation of US$ 940.82 million in 2023 and is expected to reach US$ 1730.9 million by 2033, trailing a CAGR of 6.2% during the forecast period.

Growing demand for aviation fuel additives which are typically used in commercial and military aircraft fuel is expected to drive the market. Also, the demand for aviation fuel additives is expected to rise due to growing demand from the aviation industry. These fuel additives are extensively utilized to enhance the quality and performance of aviation fuels.

The increasing emphasis on fuel efficiency, emission reduction, and engine performance is leading to rising demand for effective fuel additives. Moreover, environmental concerns regarding pollution resulting from the combustion of fossil fuels have further spurred the development of bio-based fuel additives, contributing to the market's revenue growth.

The implementation of stringent government laws and standards worldwide, particularly regarding emissions and fuel efficiency, is fueling the need for aviation fuel additives. For instance,

  • The European Union has enforced the Euro 6 emissions standards, which mandate the use of fuel additives to reduce car emissions. Similarly, the Corporate Average Fuel Economy (CAFE) requirements in the United States mandate the use of fuel additives to enhance fuel efficiency and decrease emissions.

The demand for aviation fuel additives is further expected to be driven by the increasing demand for gasoline additives in countries like China, India, and Brazil, among others. The rise in disposable income in these regions has led to an increased need for vehicles and equipment, consequently driving the demand for gasoline additives in the automotive and industrial sectors.

The development of advanced fuel additives technologies, such as deposit control additives, cetane improvers, lubricity improvers, cold flow improvers, and others, is anticipated to contribute to the market's revenue growth. Key players are emphasizing research and development (R&D) activities and making investments to introduce cutting-edge fuel additives, addressing the growing need for such additives.

Report Attributes Details
Expected Market Value (2023) US$ 940.82 million
Anticipated Forecast Value (2033) US$ 1730.9 million
Projected Growth Rate (2023 to 2033) CAGR 6.2%

Don't pay for what you don't need

Customize your report by selecting specific countries or regions and save 30%!

Comparative View of the Aviation Fuel Additives Market

Aviation Fuel Additives Market :

Attributes Aviation Fuel Additives Market
CAGR (2023 to 2033) 6.2%
Market Value (2033) US$ 1730.9 million
Growth Factor Growing preference for air traveling as compared to other modes due to comfort and quick travel duration is expected to boost sales.
Opportunity Growing demand for piston fixed-wing aircraft that can perform low altitude, moderate speed combat is expected to create opportunities for growth in the market.

Friction Modifier Additives Market :

Attributes Friction Modifier Additives Market
CAGR (2023 to 2033) 4.4%
Market Value (2033) US$ 2390 million
Growth Factor Significant production volume of passenger cars along with the thriving automotive industry are key driving factors of the market.
Opportunity The growing focus on reducing friction in lubricated machine components for increasing the energy efficiency of machines and increasing their life is expected to provide ample opportunities for market growth.

Marine Fuel Additives Market :

Attributes Marine Fuel Additives Market
CAGR (2023 to 2033) 3.4%
Market Value (2033) US$ 2.6 billion
Growth Factor A key factor that is expected to be a key driver for marine fuel additives is their capability to bring fuel efficiency to the ships.
Opportunity The International Maritime Organization (IMO) regulation, called IMO 2020 is anticipated to provide significant opportunities for the key players operating in the market.

2018 to 2022 Aviation Fuel Additives Market Outlook Compared to 2023 to 2033 Forecast

The demand for aviation fuel additives expanded at a 5.5% CAGR between 2018 and 2022. Considering the aviation industries served, demand for aviation fuel additives is uneven depending on international and domestic air transportation.

According to General Aviation Manufacturers Association, piston aircraft shipments increased by 5.5% compared to 2020, totaling 1,393 units; turboprop shipments increased by 19.0%, totaling 527; and business jet shipments increased by 10.2 %, totaling 710 units. Preliminary estimates for aircraft deliveries in 2021 showed a $ 21.6 million increase, a percentage increment of around 7.6%.

The demand for aviation fuel additives is predicted to rise over the assessment period, with a substantial growth rate of 6.2%. Further, the increasing number of commercial flights, along with the growing demand for military aircraft might spur sales of aviation fuel additives.

Nikhil Kaitwade
Nikhil Kaitwade

Principal Consultant

Talk to Analyst

Find your sweet spots for generating winning opportunities in this market.

How is the Increasing Number of Commercial Flights Driving Sales?

Commercial flights are increasing owing to economic development, urbanization, and population expansion. The aviation sector is benefiting from an increase in passenger demand for air travel as well as a rise in freight activity. Additionally, the growing preference for air travel as compared to other modes due to comfort and quick travel duration is expected to boost sales.

The introduction of low-cost airlines offering competitive fares across popular locations is also expected to boost fuel consumption which is further anticipated to propel sales of additives. Furthermore, many travelers have been attracted to the amenities offered when traveling. As a result of these factors, demand for aviation fuel additives is expected to increase in the forthcoming years.

Does High Preference for Piston Fixed-wing Aircraft Augment Growth?

Increasing demand for piston fixed-wing aircraft that can perform low altitude, moderate speed combat is anticipated to create opportunities for growth in the market. Additionally, because of their natural maneuverability, they are highly sought after in private aviation, aircraft racing, and pilot training facilities across the globe.

The most commonly used aviation fuel in piston-engine aircraft is aviation gasoline (avgas). Increasing consumption of avgas is going to eventually spur demand for aviation fuel additives, particularly tetra-ethyl lead (to enhance anti-knock characteristics), antioxidants (to prevent the formation of anti-oxidation and gum products), fuel system icing inhibitors (to prevent ice crystal formation), and static dissipater additives (to curtail the hazardous effects).

Get the data you need at a Fraction of the cost

Personalize your report by choosing insights you need
and save 40%!

Country-wise Insights

What is Driving the United States Aviation Fuel Additives Market?

Rising Preference for Aircraft Oil Additives in the United States to Augment Growth

According to the U.S. Energy Information Administration (EIA), total passenger air travel demand is anticipated to recover in 2025 as it was in 2019. Increasing air travel efficiency implies that improvements in jet fuel usage do not always follow the increase in air travel. Further, the demand for aviation fuel additives in the region is expected to rise with a CAGR of 6.1% during the forecast period.

In 2020, many planes went unused and may not return to service because they were converted to dedicated firefighters. Owing to such factors, efficient aircraft might replace these converted aircraft and accelerate the demand for aviation fuel additives.

The United States administration has targeted a 20% reduction in aviation emissions by 2030 that might prompt the usage of sustainable airline fuel (SAF) and supply 3 billion gallons of SAF per year by 2030. Moreover, SAF fuels that include additives, such as ethyl benzene for ring swelling, offer advantages. Material compatibility is going to be crucial for both the near and longer-term. Additionally, the strong desire to reduce aviation emissions is expected to create opportunities for SAF additives manufacturers in the country.

What is India’s Aviation Fuel Additives Market Outlook?

Increasing Investments in the Aviation Sector Expected to Propel Sales of Aviation Fuel Additives

The International Air Transport Association (IATA) projects that by 2030, India is expected to become the third-largest air passenger market in the world after China and the United States. India is expected to account for over 24.6% market share by the end of the forecast period. The sales of aviation fuel additives in the region are expected to rise with a CAGR of 6.3% during the forecast period.

The aviation industry has benefited from strong competition among low-cost carriers, infrastructure development at main airports, and governmental frameworks that are favorable to the aviation industry.

The nation now has 130 operational airports, comprising 10 custom, 91 domestic, and 29 international airports. It has become essential to expand airport infrastructure to accommodate the rising demand for air travel. The demand for air travel is expected to boost sales of aviation fuel additives.

Category-wise Insights

Which is the Leading Application of Aviation Fuel Additives?

Sales of Aviation Fuel Additives for Military Aircraft Expected to Remain High

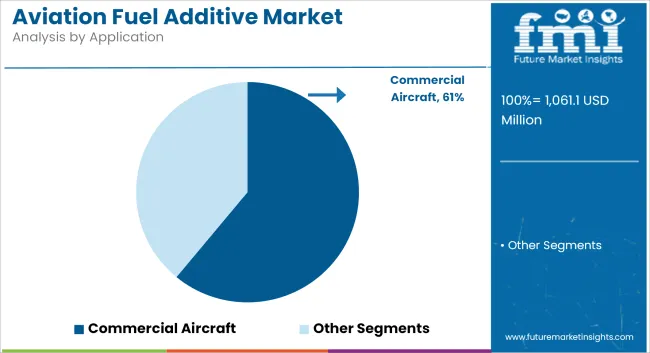
For many years, the commercial aircraft industry has been the dominant market for jet fuel additives. Further, the aerospace sector is supported by rising passenger demand for air travel and increased freight activity. The sales of aviation fuel additives for military aircraft are expected to rise with a CAGR of 7% during the forecast period.

The need for cutting-edge military aircraft with multi-mission capability is still being driven by political conflicts and territorial disputes. Additionally, a few nations are aiming to update their fleets by swapping older models with more recent versions that cost less to operate and maintain.

To accomplish the requirements of military aircraft, aviation fuel additives such as corrosion inhibitors and fuel system icing inhibitors are used. With the potential concern of rust or ice crystal formation, they are mandatory to use in military jets.

Start-ups in the Aviation Fuel Additives Market

Start-ups are crucial in identifying growth prospects and fostering industry growth, thanks to their ability to efficiently convert inputs into outputs and adapt to volatile market conditions. Within the aviation fuel additives market, numerous start-ups are actively involved in manufacturing and offering related services.

  • Response Technologies utilize additive manufacturing technology to enhance the fluid resistance of urethane open-cell foams. Their developed technology focuses on treating these foams to improve resistance against various fluids such as fuel, water, oil, and silicone coolant.
  • Sylvatex develops biomass-based nano additives for engine oil, utilizing a platform technology that creates a stable liquid crystal microemulsion from biomass-derived inputs.
  • Rocky Mountain GTL, a startup in Canada, converts natural gas liquids into synthetic fuels through modular Fischer-Tropsch GTL plants that it designs, constructs, and operates.

Competitive Landscape

The market for aviation fuel additives is characterized by extreme competition, as key industry players are making significant investments to improve their manufacturing capabilities.

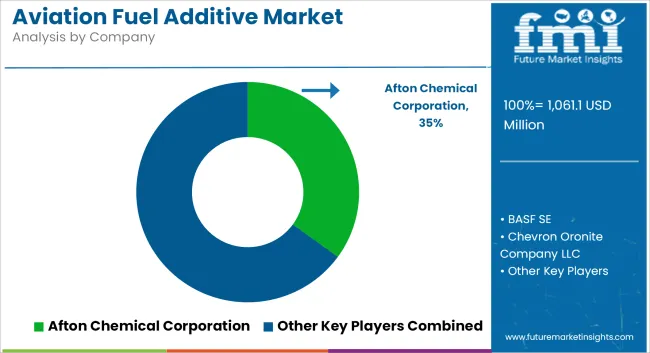
The key industry players operating in the market are Afton Chemical Corporation, BASF SE, Dorf-Ketal Chemicals India Pvt., Ltd., Hammonds, Meridian Fuels, Nalco and Ecolab Company, Shell Chemicals LP, The Chemours Company, Biobor Fuel Additives, Nexeo Solutions, Innospec Chemical Company, and Albemarle Corporation.

Recent Developments in the Aviation Fuel Additives Market

  • In September 2021, Royal Dutch Shell plc announced plans to produce around 2 million tonnes of sustainable aviation fuel (SAF) annually until 2025. The company's objective is to have at least 10% of its global aviation fuel sales composed of SAF.
  • In January 2021, BASF Enzymes LLC and Innospec Fuel Specialties LLC forged a distribution agreement to enhance consumer value and showcase their dedication to the ethanol yield business.
  • In December 2021, BASF introduced KEROPUR-D, a new multipurpose diesel additive, in South Korea. This high-performance additive effectively eliminates engine deposits and prevents the formation of new deposits.
  • In November 2021, Evonik revealed the establishment of a state-of-the-art oil additive performance test lab in the Asia Pacific region.

Report Scope

Report Attribute Details
Market Value in 2023 US$ 940.82 million
Market Value in 2033 US$ 1730.9 million
Growth Rate CAGR of 6.2% from 2023 to 2033
Base Year for Estimation 2022
Historical Data 2018 to 2022
Forecast Period 2023 to 2033
Quantitative Units Revenue in US$ million and CAGR from 2023 to 2033
Report Coverage Revenue Forecast, Volume Forecast, Company Ranking, Competitive Landscape, Growth Factors, Trends, and Pricing Analysis
Segments Covered
  • By additive type
  • By fuel type
  • By application
  • By region
Regions Covered
  • North America
  • Latin America
  • Western Europe
  • Eastern Europe
  • South Asia and Pacific
  • East Asia
  • The Middle East and Africa
Key Countries Profiled
  • The United States of America
  • Canada
  • Brazil
  • Mexico
  • Germany
  • The United Kingdom
  • France
  • Spain
  • Italy
  • India
  • China
  • Japan
  • Malaysia
  • Singapore
  • Thailand
  • South Korea
  • Australia
  • New Zealand
  • South Africa
  • Israel
Key Companies Profiled
  • Afton Chemical Corporation
  • BASF SE
  • Dorf-Ketal Chemicals India Pvt., Ltd.
  • Hammonds
  • Meridian Fuels
  • Nalco an Ecolab Company
  • Shell Chemicals LP
  • The Chemours Company
  • Biobor Fuel Additives
  • Nexeo Solutions.
  • Innospec Chemical Company
  • Albemarle Corporation
Customization Available Upon Request

Key Segments Profiled in the Aviation Fuel Additives Market Industry Survey.

By Additive Type :

  • Dispersants
  • Antioxidants
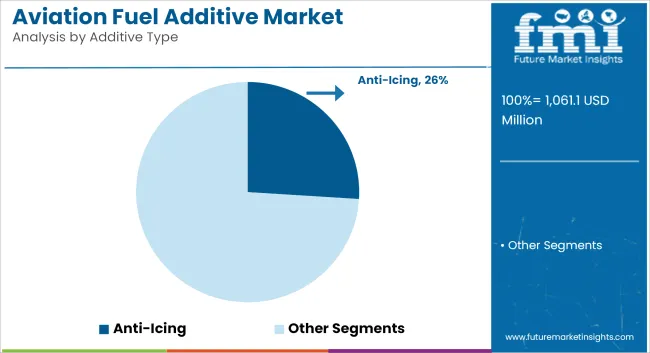
  • Anti-Icing
  • Corrosion Inhibitors
  • Antiknock
  • Metal Deactivators
  • Others

By Fuel Type :

  • Aviation Gasoline
  • Jet Fuel

By Application :

  • Commercial Aircraft
    • Passenger Aircraft
    • Cargo Aircraft
  • Military Aircraft
  • Others

By Region :

  • North America
  • Latin America
  • Western Europe
  • Eastern Europe
  • South Asia and Pacific
  • East Asia
  • The Middle East and Africa

Frequently Asked Questions

What is the Aviation Fuel Additives Market CAGR for 2033?

The aviation fuel additives market CAGR for 2033 is 6.2%.

How Big Will the Aviation Fuel Additives Market by 2033?

The market is estimated to reach US$ 1,730.9 million by 2033.

How Key Players are Developing the Aviation Fuel Additives Market?

Key players in the aviation fuel additives market are developing it by introducing innovative technologies.

What is the Current Aviation Fuel Additives Market Valuation?

The market is estimated to secure a valuation of US$ 940.82 million in 2023.

Who are the Three Key Players in the Aviation Fuel Additives Market?

Afton Chemical Corporation, BASF SE, and Innospec Inc. are the key aviation fuel additives market players.

Table of Content

1. Executive Summary

    1.1. Global Market Outlook

    1.2. Demand-side Trends

    1.3. Supply-side Trends

    1.4. Technology Roadmap Analysis

    1.5. Analysis and Recommendations

2. Market Overview

    2.1. Market Coverage / Taxonomy

    2.2. Market Definition / Scope / Limitations

3. Market Background

    3.1. Market Dynamics

        3.1.1. Drivers

        3.1.2. Restraints

        3.1.3. Opportunity

        3.1.4. Trends

    3.2. Scenario Forecast

        3.2.1. Demand in Optimistic Scenario

        3.2.2. Demand in Likely Scenario

        3.2.3. Demand in Conservative Scenario

    3.3. Opportunity Map Analysis

    3.4. Product Life Cycle Analysis

    3.5. Supply Chain Analysis

        3.5.1. Supply Side Participants and their Roles

            3.5.1.1. Producers

            3.5.1.2. Mid-Level Participants (Traders/ Agents/ Brokers)

            3.5.1.3. Wholesalers and Distributors

        3.5.2. Value Added and Value Created at Node in the Supply Chain

        3.5.3. List of Raw Material Suppliers

        3.5.4. List of Existing and Potential Buyer’s

    3.6. Investment Feasibility Matrix

    3.7. Value Chain Analysis

        3.7.1. Profit Margin Analysis

        3.7.2. Wholesalers and Distributors

        3.7.3. Retailers

    3.8. PESTLE and Porter’s Analysis

    3.9. Regulatory Landscape

        3.9.1. By Key Regions

        3.9.2. By Key Countries

    3.10. Regional Parent Market Outlook

    3.11. Production and Consumption Statistics

    3.12. Import and Export Statistics

4. Global Market Analysis 2018 to 2022 and Forecast, 2023 to 2033

    4.1. Historical Market Size Value (US$ Million) & Volume (Tons) Analysis, 2018 to 2022

    4.2. Current and Future Market Size Value (US$ Million) & Volume (Tons) Projections, 2023 to 2033

        4.2.1. Y-o-Y Growth Trend Analysis

        4.2.2. Absolute $ Opportunity Analysis

5. Global Market Analysis 2018 to 2022 and Forecast 2023 to 2033, By Additive Type

    5.1. Introduction / Key Findings

    5.2. Historical Market Size Value (US$ Million) & Volume (Tons) Analysis By Additive Type, 2018 to 2022

    5.3. Current and Future Market Size Value (US$ Million) & Volume (Tons) Analysis and Forecast By Additive Type, 2023 to 2033

        5.3.1. Dispersants

        5.3.2. Antioxidants

        5.3.3. Anti-Icing

        5.3.4. Corrosion Inhibitors

        5.3.5. Antiknock

        5.3.6. Metal Deactivators

        5.3.7. Others

    5.4. Y-o-Y Growth Trend Analysis By Additive Type, 2018 to 2022

    5.5. Absolute $ Opportunity Analysis By Additive Type, 2023 to 2033

6. Global Market Analysis 2018 to 2022 and Forecast 2023 to 2033, By Fuel Type

    6.1. Introduction / Key Findings

    6.2. Historical Market Size Value (US$ Million) & Volume (Tons) Analysis By Fuel Type, 2018 to 2022

    6.3. Current and Future Market Size Value (US$ Million) & Volume (Tons) Analysis and Forecast By Fuel Type, 2023 to 2033

        6.3.1. Aviation Gasoline

        6.3.2. Jet Fuel

    6.4. Y-o-Y Growth Trend Analysis By Fuel Type, 2018 to 2022

    6.5. Absolute $ Opportunity Analysis By Fuel Type, 2023 to 2033

7. Global Market Analysis 2018 to 2022 and Forecast 2023 to 2033, By Application

    7.1. Introduction / Key Findings

    7.2. Historical Market Size Value (US$ Million) & Volume (Tons) Analysis By Application, 2018 to 2022

    7.3. Current and Future Market Size Value (US$ Million) & Volume (Tons) Analysis and Forecast By Application, 2023 to 2033

        7.3.1. Commercial Aircraft

            7.3.1.1. Passenger Aircraft

            7.3.1.2. Cargo Aircraft

        7.3.2. Military Aircraft

        7.3.3. Others

    7.4. Y-o-Y Growth Trend Analysis By Application, 2018 to 2022

    7.5. Absolute $ Opportunity Analysis By Application, 2023 to 2033

8. Global Market Analysis 2018 to 2022 and Forecast 2023 to 2033, By Region

    8.1. Introduction

    8.2. Historical Market Size Value (US$ Million) & Volume (Tons) Analysis By Region, 2018 to 2022

    8.3. Current Market Size Value (US$ Million) & Volume (Tons) Analysis and Forecast By Region, 2023 to 2033

        8.3.1. North America

        8.3.2. Latin America

        8.3.3. Western Europe

        8.3.4. Eastern Europe

        8.3.5. South Asia and Pacific

        8.3.6. East Asia

        8.3.7. Middle East and Africa

    8.4. Market Attractiveness Analysis By Region

9. North America Market Analysis 2018 to 2022 and Forecast 2023 to 2033, By Country

    9.1. Historical Market Size Value (US$ Million) & Volume (Tons) Trend Analysis By Market Taxonomy, 2018 to 2022

    9.2. Market Size Value (US$ Million) & Volume (Tons) Forecast By Market Taxonomy, 2023 to 2033

        9.2.1. By Country

            9.2.1.1. USA

            9.2.1.2. Canada

        9.2.2. By Additive Type

        9.2.3. By Fuel Type

        9.2.4. By Application

    9.3. Market Attractiveness Analysis

        9.3.1. By Country

        9.3.2. By Additive Type

        9.3.3. By Fuel Type

        9.3.4. By Application

    9.4. Key Takeaways

10. Latin America Market Analysis 2018 to 2022 and Forecast 2023 to 2033, By Country

    10.1. Historical Market Size Value (US$ Million) & Volume (Tons) Trend Analysis By Market Taxonomy, 2018 to 2022

    10.2. Market Size Value (US$ Million) & Volume (Tons) Forecast By Market Taxonomy, 2023 to 2033

        10.2.1. By Country

            10.2.1.1. Brazil

            10.2.1.2. Mexico

            10.2.1.3. Rest of Latin America

        10.2.2. By Additive Type

        10.2.3. By Fuel Type

        10.2.4. By Application

    10.3. Market Attractiveness Analysis

        10.3.1. By Country

        10.3.2. By Additive Type

        10.3.3. By Fuel Type

        10.3.4. By Application

    10.4. Key Takeaways

11. Western Europe Market Analysis 2018 to 2022 and Forecast 2023 to 2033, By Country

    11.1. Historical Market Size Value (US$ Million) & Volume (Tons) Trend Analysis By Market Taxonomy, 2018 to 2022

    11.2. Market Size Value (US$ Million) & Volume (Tons) Forecast By Market Taxonomy, 2023 to 2033

        11.2.1. By Country

            11.2.1.1. Germany

            11.2.1.2. UK

            11.2.1.3. France

            11.2.1.4. Spain

            11.2.1.5. Italy

            11.2.1.6. Rest of Western Europe

        11.2.2. By Additive Type

        11.2.3. By Fuel Type

        11.2.4. By Application

    11.3. Market Attractiveness Analysis

        11.3.1. By Country

        11.3.2. By Additive Type

        11.3.3. By Fuel Type

        11.3.4. By Application

    11.4. Key Takeaways

12. Eastern Europe Market Analysis 2018 to 2022 and Forecast 2023 to 2033, By Country

    12.1. Historical Market Size Value (US$ Million) & Volume (Tons) Trend Analysis By Market Taxonomy, 2018 to 2022

    12.2. Market Size Value (US$ Million) & Volume (Tons) Forecast By Market Taxonomy, 2023 to 2033

        12.2.1. By Country

            12.2.1.1. Poland

            12.2.1.2. Russia

            12.2.1.3. Czech Republic

            12.2.1.4. Romania

            12.2.1.5. Rest of Eastern Europe

        12.2.2. By Additive Type

        12.2.3. By Fuel Type

        12.2.4. By Application

    12.3. Market Attractiveness Analysis

        12.3.1. By Country

        12.3.2. By Additive Type

        12.3.3. By Fuel Type

        12.3.4. By Application

    12.4. Key Takeaways

13. South Asia and Pacific Market Analysis 2018 to 2022 and Forecast 2023 to 2033, By Country

    13.1. Historical Market Size Value (US$ Million) & Volume (Tons) Trend Analysis By Market Taxonomy, 2018 to 2022

    13.2. Market Size Value (US$ Million) & Volume (Tons) Forecast By Market Taxonomy, 2023 to 2033

        13.2.1. By Country

            13.2.1.1. India

            13.2.1.2. Bangladesh

            13.2.1.3. Australia

            13.2.1.4. New Zealand

            13.2.1.5. Rest of South Asia and Pacific

        13.2.2. By Additive Type

        13.2.3. By Fuel Type

        13.2.4. By Application

    13.3. Market Attractiveness Analysis

        13.3.1. By Country

        13.3.2. By Additive Type

        13.3.3. By Fuel Type

        13.3.4. By Application

    13.4. Key Takeaways

14. East Asia Market Analysis 2018 to 2022 and Forecast 2023 to 2033, By Country

    14.1. Historical Market Size Value (US$ Million) & Volume (Tons) Trend Analysis By Market Taxonomy, 2018 to 2022

    14.2. Market Size Value (US$ Million) & Volume (Tons) Forecast By Market Taxonomy, 2023 to 2033

        14.2.1. By Country

            14.2.1.1. China

            14.2.1.2. Japan

            14.2.1.3. South Korea

        14.2.2. By Additive Type

        14.2.3. By Fuel Type

        14.2.4. By Application

    14.3. Market Attractiveness Analysis

        14.3.1. By Country

        14.3.2. By Additive Type

        14.3.3. By Fuel Type

        14.3.4. By Application

    14.4. Key Takeaways

15. Middle East and Africa Market Analysis 2018 to 2022 and Forecast 2023 to 2033, By Country

    15.1. Historical Market Size Value (US$ Million) & Volume (Tons) Trend Analysis By Market Taxonomy, 2018 to 2022

    15.2. Market Size Value (US$ Million) & Volume (Tons) Forecast By Market Taxonomy, 2023 to 2033

        15.2.1. By Country

            15.2.1.1. GCC Countries

            15.2.1.2. South Africa

            15.2.1.3. Israel

            15.2.1.4. Rest of MEA

        15.2.2. By Additive Type

        15.2.3. By Fuel Type

        15.2.4. By Application

    15.3. Market Attractiveness Analysis

        15.3.1. By Country

        15.3.2. By Additive Type

        15.3.3. By Fuel Type

        15.3.4. By Application

    15.4. Key Takeaways

16. Key Countries Market Analysis

    16.1. USA

        16.1.1. Pricing Analysis

        16.1.2. Market Share Analysis, 2022

            16.1.2.1. By Additive Type

            16.1.2.2. By Fuel Type

            16.1.2.3. By Application

    16.2. Canada

        16.2.1. Pricing Analysis

        16.2.2. Market Share Analysis, 2022

            16.2.2.1. By Additive Type

            16.2.2.2. By Fuel Type

            16.2.2.3. By Application

    16.3. Brazil

        16.3.1. Pricing Analysis

        16.3.2. Market Share Analysis, 2022

            16.3.2.1. By Additive Type

            16.3.2.2. By Fuel Type

            16.3.2.3. By Application

    16.4. Mexico

        16.4.1. Pricing Analysis

        16.4.2. Market Share Analysis, 2022

            16.4.2.1. By Additive Type

            16.4.2.2. By Fuel Type

            16.4.2.3. By Application

    16.5. Germany

        16.5.1. Pricing Analysis

        16.5.2. Market Share Analysis, 2022

            16.5.2.1. By Additive Type

            16.5.2.2. By Fuel Type

            16.5.2.3. By Application

    16.6. UK

        16.6.1. Pricing Analysis

        16.6.2. Market Share Analysis, 2022

            16.6.2.1. By Additive Type

            16.6.2.2. By Fuel Type

            16.6.2.3. By Application

    16.7. France

        16.7.1. Pricing Analysis

        16.7.2. Market Share Analysis, 2022

            16.7.2.1. By Additive Type

            16.7.2.2. By Fuel Type

            16.7.2.3. By Application

    16.8. Spain

        16.8.1. Pricing Analysis

        16.8.2. Market Share Analysis, 2022

            16.8.2.1. By Additive Type

            16.8.2.2. By Fuel Type

            16.8.2.3. By Application

    16.9. Italy

        16.9.1. Pricing Analysis

        16.9.2. Market Share Analysis, 2022

            16.9.2.1. By Additive Type

            16.9.2.2. By Fuel Type

            16.9.2.3. By Application

    16.10. Poland

        16.10.1. Pricing Analysis

        16.10.2. Market Share Analysis, 2022

            16.10.2.1. By Additive Type

            16.10.2.2. By Fuel Type

            16.10.2.3. By Application

    16.11. Russia

        16.11.1. Pricing Analysis

        16.11.2. Market Share Analysis, 2022

            16.11.2.1. By Additive Type

            16.11.2.2. By Fuel Type

            16.11.2.3. By Application

    16.12. Czech Republic

        16.12.1. Pricing Analysis

        16.12.2. Market Share Analysis, 2022

            16.12.2.1. By Additive Type

            16.12.2.2. By Fuel Type

            16.12.2.3. By Application

    16.13. Romania

        16.13.1. Pricing Analysis

        16.13.2. Market Share Analysis, 2022

            16.13.2.1. By Additive Type

            16.13.2.2. By Fuel Type

            16.13.2.3. By Application

    16.14. India

        16.14.1. Pricing Analysis

        16.14.2. Market Share Analysis, 2022

            16.14.2.1. By Additive Type

            16.14.2.2. By Fuel Type

            16.14.2.3. By Application

    16.15. Bangladesh

        16.15.1. Pricing Analysis

        16.15.2. Market Share Analysis, 2022

            16.15.2.1. By Additive Type

            16.15.2.2. By Fuel Type

            16.15.2.3. By Application

    16.16. Australia

        16.16.1. Pricing Analysis

        16.16.2. Market Share Analysis, 2022

            16.16.2.1. By Additive Type

            16.16.2.2. By Fuel Type

            16.16.2.3. By Application

    16.17. New Zealand

        16.17.1. Pricing Analysis

        16.17.2. Market Share Analysis, 2022

            16.17.2.1. By Additive Type

            16.17.2.2. By Fuel Type

            16.17.2.3. By Application

    16.18. China

        16.18.1. Pricing Analysis

        16.18.2. Market Share Analysis, 2022

            16.18.2.1. By Additive Type

            16.18.2.2. By Fuel Type

            16.18.2.3. By Application

    16.19. Japan

        16.19.1. Pricing Analysis

        16.19.2. Market Share Analysis, 2022

            16.19.2.1. By Additive Type

            16.19.2.2. By Fuel Type

            16.19.2.3. By Application

    16.20. South Korea

        16.20.1. Pricing Analysis

        16.20.2. Market Share Analysis, 2022

            16.20.2.1. By Additive Type

            16.20.2.2. By Fuel Type

            16.20.2.3. By Application

    16.21. GCC Countries

        16.21.1. Pricing Analysis

        16.21.2. Market Share Analysis, 2022

            16.21.2.1. By Additive Type

            16.21.2.2. By Fuel Type

            16.21.2.3. By Application

    16.22. South Africa

        16.22.1. Pricing Analysis

        16.22.2. Market Share Analysis, 2022

            16.22.2.1. By Additive Type

            16.22.2.2. By Fuel Type

            16.22.2.3. By Application

    16.23. Israel

        16.23.1. Pricing Analysis

        16.23.2. Market Share Analysis, 2022

            16.23.2.1. By Additive Type

            16.23.2.2. By Fuel Type

            16.23.2.3. By Application

17. Market Structure Analysis

    17.1. Competition Dashboard

    17.2. Competition Benchmarking

    17.3. Market Share Analysis of Top Players

        17.3.1. By Regional

        17.3.2. By Additive Type

        17.3.3. By Fuel Type

        17.3.4. By Application

18. Competition Analysis

    18.1. Competition Deep Dive

        18.1.1. Afton Chemical Corporation

            18.1.1.1. Overview

            18.1.1.2. Product Portfolio

            18.1.1.3. Profitability by Market Segments

            18.1.1.4. Sales Footprint

            18.1.1.5. Strategy Overview

                18.1.1.5.1. Marketing Strategy

                18.1.1.5.2. Product Strategy

                18.1.1.5.3. Channel Strategy

        18.1.2. BASF SE

            18.1.2.1. Overview

            18.1.2.2. Product Portfolio

            18.1.2.3. Profitability by Market Segments

            18.1.2.4. Sales Footprint

            18.1.2.5. Strategy Overview

                18.1.2.5.1. Marketing Strategy

                18.1.2.5.2. Product Strategy

                18.1.2.5.3. Channel Strategy

        18.1.3. Dorf-Ketal Chemicals India Pvt., Ltd.

            18.1.3.1. Overview

            18.1.3.2. Product Portfolio

            18.1.3.3. Profitability by Market Segments

            18.1.3.4. Sales Footprint

            18.1.3.5. Strategy Overview

                18.1.3.5.1. Marketing Strategy

                18.1.3.5.2. Product Strategy

                18.1.3.5.3. Channel Strategy

        18.1.4. Hammonds

            18.1.4.1. Overview

            18.1.4.2. Product Portfolio

            18.1.4.3. Profitability by Market Segments

            18.1.4.4. Sales Footprint

            18.1.4.5. Strategy Overview

                18.1.4.5.1. Marketing Strategy

                18.1.4.5.2. Product Strategy

                18.1.4.5.3. Channel Strategy

        18.1.5. Meridian Fuels

            18.1.5.1. Overview

            18.1.5.2. Product Portfolio

            18.1.5.3. Profitability by Market Segments

            18.1.5.4. Sales Footprint

            18.1.5.5. Strategy Overview

                18.1.5.5.1. Marketing Strategy

                18.1.5.5.2. Product Strategy

                18.1.5.5.3. Channel Strategy

        18.1.6. Nalco an Ecolab Company

            18.1.6.1. Overview

            18.1.6.2. Product Portfolio

            18.1.6.3. Profitability by Market Segments

            18.1.6.4. Sales Footprint

            18.1.6.5. Strategy Overview

                18.1.6.5.1. Marketing Strategy

                18.1.6.5.2. Product Strategy

                18.1.6.5.3. Channel Strategy

        18.1.7. Shell Chemicals LP

            18.1.7.1. Overview

            18.1.7.2. Product Portfolio

            18.1.7.3. Profitability by Market Segments

            18.1.7.4. Sales Footprint

            18.1.7.5. Strategy Overview

                18.1.7.5.1. Marketing Strategy

                18.1.7.5.2. Product Strategy

                18.1.7.5.3. Channel Strategy

        18.1.8. The Chemours Company

            18.1.8.1. Overview

            18.1.8.2. Product Portfolio

            18.1.8.3. Profitability by Market Segments

            18.1.8.4. Sales Footprint

            18.1.8.5. Strategy Overview

                18.1.8.5.1. Marketing Strategy

                18.1.8.5.2. Product Strategy

                18.1.8.5.3. Channel Strategy

        18.1.9. Biobor Fuel Additives

            18.1.9.1. Overview

            18.1.9.2. Product Portfolio

            18.1.9.3. Profitability by Market Segments

            18.1.9.4. Sales Footprint

            18.1.9.5. Strategy Overview

                18.1.9.5.1. Marketing Strategy

                18.1.9.5.2. Product Strategy

                18.1.9.5.3. Channel Strategy

        18.1.10. Nexeo Solutions.

            18.1.10.1. Overview

            18.1.10.2. Product Portfolio

            18.1.10.3. Profitability by Market Segments

            18.1.10.4. Sales Footprint

            18.1.10.5. Strategy Overview

                18.1.10.5.1. Marketing Strategy

                18.1.10.5.2. Product Strategy

                18.1.10.5.3. Channel Strategy

        18.1.11. Innospec Chemical Company

            18.1.11.1. Overview

            18.1.11.2. Product Portfolio

            18.1.11.3. Profitability by Market Segments

            18.1.11.4. Sales Footprint

            18.1.11.5. Strategy Overview

                18.1.11.5.1. Marketing Strategy

                18.1.11.5.2. Product Strategy

                18.1.11.5.3. Channel Strategy

        18.1.12. Albemarle Corporation

            18.1.12.1. Overview

            18.1.12.2. Product Portfolio

            18.1.12.3. Profitability by Market Segments

            18.1.12.4. Sales Footprint

            18.1.12.5. Strategy Overview

                18.1.12.5.1. Marketing Strategy

                18.1.12.5.2. Product Strategy

                18.1.12.5.3. Channel Strategy

19. Assumptions & Acronyms Used

20. Research Methodology

Don't pay for what you don't need

Customize your report by selecting specific countries or regions and save 30%!

List of Tables

Table 01: Global Market Value (US$ Million) Forecast by Region, 2018 to 2033

Table 02: Global Market Volume (Tons) Forecast by Region, 2018 to 2033

Table 03: Global Market Value (US$ Million) Forecast by Additive Type, 2018 to 2033

Table 04: Global Market Volume (Tons) Forecast by Additive Type, 2018 to 2033

Table 05: Global Market Value (US$ Million) Forecast by Fuel Type, 2018 to 2033

Table 06: Global Market Volume (Tons) Forecast by Fuel Type, 2018 to 2033

Table 07: Global Market Value (US$ Million) Forecast by Application, 2018 to 2033

Table 08: Global Market Volume (Tons) Forecast by Application, 2018 to 2033

Table 09: North America Market Value (US$ Million) Forecast by Country, 2018 to 2033

Table 10: North America Market Volume (Tons) Forecast by Country, 2018 to 2033

Table 11: North America Market Value (US$ Million) Forecast by Additive Type, 2018 to 2033

Table 12: North America Market Volume (Tons) Forecast by Additive Type, 2018 to 2033

Table 13: North America Market Value (US$ Million) Forecast by Fuel Type, 2018 to 2033

Table 14: North America Market Volume (Tons) Forecast by Fuel Type, 2018 to 2033

Table 15: North America Market Value (US$ Million) Forecast by Application, 2018 to 2033

Table 16: North America Market Volume (Tons) Forecast by Application, 2018 to 2033

Table 17: Latin America Market Value (US$ Million) Forecast by Country, 2018 to 2033

Table 18: Latin America Market Volume (Tons) Forecast by Country, 2018 to 2033

Table 19: Latin America Market Value (US$ Million) Forecast by Additive Type, 2018 to 2033

Table 20: Latin America Market Volume (Tons) Forecast by Additive Type, 2018 to 2033

Table 21: Latin America Market Value (US$ Million) Forecast by Fuel Type, 2018 to 2033

Table 22: Latin America Market Volume (Tons) Forecast by Fuel Type, 2018 to 2033

Table 23: Latin America Market Value (US$ Million) Forecast by Application, 2018 to 2033

Table 24: Latin America Market Volume (Tons) Forecast by Application, 2018 to 2033

Table 25: Western Europe Market Value (US$ Million) Forecast by Country, 2018 to 2033

Table 26: Western Europe Market Volume (Tons) Forecast by Country, 2018 to 2033

Table 27: Western Europe Market Value (US$ Million) Forecast by Additive Type, 2018 to 2033

Table 28: Western Europe Market Volume (Tons) Forecast by Additive Type, 2018 to 2033

Table 29: Western Europe Market Value (US$ Million) Forecast by Fuel Type, 2018 to 2033

Table 30: Western Europe Market Volume (Tons) Forecast by Fuel Type, 2018 to 2033

Table 31: Western Europe Market Value (US$ Million) Forecast by Application, 2018 to 2033

Table 32: Western Europe Market Volume (Tons) Forecast by Application, 2018 to 2033

Table 33: Eastern Europe Market Value (US$ Million) Forecast by Country, 2018 to 2033

Table 34: Eastern Europe Market Volume (Tons) Forecast by Country, 2018 to 2033

Table 35: Eastern Europe Market Value (US$ Million) Forecast by Additive Type, 2018 to 2033

Table 36: Eastern Europe Market Volume (Tons) Forecast by Additive Type, 2018 to 2033

Table 37: Eastern Europe Market Value (US$ Million) Forecast by Fuel Type, 2018 to 2033

Table 38: Eastern Europe Market Volume (Tons) Forecast by Fuel Type, 2018 to 2033

Table 39: Eastern Europe Market Value (US$ Million) Forecast by Application, 2018 to 2033

Table 40: Eastern Europe Market Volume (Tons) Forecast by Application, 2018 to 2033

Table 41: South Asia and Pacific Market Value (US$ Million) Forecast by Country, 2018 to 2033

Table 42: South Asia and Pacific Market Volume (Tons) Forecast by Country, 2018 to 2033

Table 43: South Asia and Pacific Market Value (US$ Million) Forecast by Additive Type, 2018 to 2033

Table 44: South Asia and Pacific Market Volume (Tons) Forecast by Additive Type, 2018 to 2033

Table 45: South Asia and Pacific Market Value (US$ Million) Forecast by Fuel Type, 2018 to 2033

Table 46: South Asia and Pacific Market Volume (Tons) Forecast by Fuel Type, 2018 to 2033

Table 47: South Asia and Pacific Market Value (US$ Million) Forecast by Application, 2018 to 2033

Table 48: South Asia and Pacific Market Volume (Tons) Forecast by Application, 2018 to 2033

Table 49: East Asia Market Value (US$ Million) Forecast by Country, 2018 to 2033

Table 50: East Asia Market Volume (Tons) Forecast by Country, 2018 to 2033

Table 51: East Asia Market Value (US$ Million) Forecast by Additive Type, 2018 to 2033

Table 52: East Asia Market Volume (Tons) Forecast by Additive Type, 2018 to 2033

Table 53: East Asia Market Value (US$ Million) Forecast by Fuel Type, 2018 to 2033

Table 54: East Asia Market Volume (Tons) Forecast by Fuel Type, 2018 to 2033

Table 55: East Asia Market Value (US$ Million) Forecast by Application, 2018 to 2033

Table 56: East Asia Market Volume (Tons) Forecast by Application, 2018 to 2033

Table 57: Middle East and Africa Market Value (US$ Million) Forecast by Country, 2018 to 2033

Table 58: Middle East and Africa Market Volume (Tons) Forecast by Country, 2018 to 2033

Table 59: Middle East and Africa Market Value (US$ Million) Forecast by Additive Type, 2018 to 2033

Table 60: Middle East and Africa Market Volume (Tons) Forecast by Additive Type, 2018 to 2033

Table 61: Middle East and Africa Market Value (US$ Million) Forecast by Fuel Type, 2018 to 2033

Table 62: Middle East and Africa Market Volume (Tons) Forecast by Fuel Type, 2018 to 2033

Table 63: Middle East and Africa Market Value (US$ Million) Forecast by Application, 2018 to 2033

Table 64: Middle East and Africa Market Volume (Tons) Forecast by Application, 2018 to 2033
Nikhil Kaitwade
Nikhil Kaitwade

Principal Consultant

Talk to Analyst

Find your sweet spots for generating winning opportunities in this market.

List of Charts

Figure 01: Global Market Value (US$ Million) by Additive Type, 2023 to 2033

Figure 02: Global Market Value (US$ Million) by Fuel Type, 2023 to 2033

Figure 03: Global Market Value (US$ Million) by Application, 2023 to 2033

Figure 04: Global Market Value (US$ Million) by Region, 2023 to 2033

Figure 05: Global Market Value (US$ Million) Analysis by Region, 2018 to 2033

Figure 06: Global Market Volume (Tons) Analysis by Region, 2018 to 2033

Figure 07: Global Market Value Share (%) and BPS Analysis by Region, 2023 to 2033

Figure 08: Global Market Y-o-Y Growth (%) Projections by Region, 2023 to 2033

Figure 09: Global Market Value (US$ Million) Analysis by Additive Type, 2018 to 2033

Figure 10: Global Market Volume (Tons) Analysis by Additive Type, 2018 to 2033

Figure 11: Global Market Value Share (%) and BPS Analysis by Additive Type, 2023 to 2033

Figure 12: Global Market Y-o-Y Growth (%) Projections by Additive Type, 2023 to 2033

Figure 13: Global Market Value (US$ Million) Analysis by Fuel Type, 2018 to 2033

Figure 14: Global Market Volume (Tons) Analysis by Fuel Type, 2018 to 2033

Figure 15: Global Market Value Share (%) and BPS Analysis by Fuel Type, 2023 to 2033

Figure 16: Global Market Y-o-Y Growth (%) Projections by Fuel Type, 2023 to 2033

Figure 17: Global Market Value (US$ Million) Analysis by Application, 2018 to 2033

Figure 18: Global Market Volume (Tons) Analysis by Application, 2018 to 2033

Figure 19: Global Market Value Share (%) and BPS Analysis by Application, 2023 to 2033

Figure 20: Global Market Y-o-Y Growth (%) Projections by Application, 2023 to 2033

Figure 21: Global Market Attractiveness by Additive Type, 2023 to 2033

Figure 22: Global Market Attractiveness by Fuel Type, 2023 to 2033

Figure 23: Global Market Attractiveness by Application, 2023 to 2033

Figure 24: Global Market Attractiveness by Region, 2023 to 2033

Figure 25: North America Market Value (US$ Million) by Additive Type, 2023 to 2033

Figure 26: North America Market Value (US$ Million) by Fuel Type, 2023 to 2033

Figure 27: North America Market Value (US$ Million) by Application, 2023 to 2033

Figure 28: North America Market Value (US$ Million) by Country, 2023 to 2033

Figure 29: North America Market Value (US$ Million) Analysis by Country, 2018 to 2033

Figure 30: North America Market Volume (Tons) Analysis by Country, 2018 to 2033

Figure 31: North America Market Value Share (%) and BPS Analysis by Country, 2023 to 2033

Figure 32: North America Market Y-o-Y Growth (%) Projections by Country, 2023 to 2033

Figure 33: North America Market Value (US$ Million) Analysis by Additive Type, 2018 to 2033

Figure 34: North America Market Volume (Tons) Analysis by Additive Type, 2018 to 2033

Figure 35: North America Market Value Share (%) and BPS Analysis by Additive Type, 2023 to 2033

Figure 36: North America Market Y-o-Y Growth (%) Projections by Additive Type, 2023 to 2033

Figure 37: North America Market Value (US$ Million) Analysis by Fuel Type, 2018 to 2033

Figure 38: North America Market Volume (Tons) Analysis by Fuel Type, 2018 to 2033

Figure 39: North America Market Value Share (%) and BPS Analysis by Fuel Type, 2023 to 2033

Figure 40: North America Market Y-o-Y Growth (%) Projections by Fuel Type, 2023 to 2033

Figure 41: North America Market Value (US$ Million) Analysis by Application, 2018 to 2033

Figure 42: North America Market Volume (Tons) Analysis by Application, 2018 to 2033

Figure 43: North America Market Value Share (%) and BPS Analysis by Application, 2023 to 2033

Figure 44: North America Market Y-o-Y Growth (%) Projections by Application, 2023 to 2033

Figure 45: North America Market Attractiveness by Additive Type, 2023 to 2033

Figure 46: North America Market Attractiveness by Fuel Type, 2023 to 2033

Figure 47: North America Market Attractiveness by Application, 2023 to 2033

Figure 48: North America Market Attractiveness by Country, 2023 to 2033

Figure 49: Latin America Market Value (US$ Million) by Additive Type, 2023 to 2033

Figure 50: Latin America Market Value (US$ Million) by Fuel Type, 2023 to 2033

Figure 51: Latin America Market Value (US$ Million) by Application, 2023 to 2033

Figure 52: Latin America Market Value (US$ Million) by Country, 2023 to 2033

Figure 53: Latin America Market Value (US$ Million) Analysis by Country, 2018 to 2033

Figure 54: Latin America Market Volume (Tons) Analysis by Country, 2018 to 2033

Figure 55: Latin America Market Value Share (%) and BPS Analysis by Country, 2023 to 2033

Figure 56: Latin America Market Y-o-Y Growth (%) Projections by Country, 2023 to 2033

Figure 57: Latin America Market Value (US$ Million) Analysis by Additive Type, 2018 to 2033

Figure 58: Latin America Market Volume (Tons) Analysis by Additive Type, 2018 to 2033

Figure 59: Latin America Market Value Share (%) and BPS Analysis by Additive Type, 2023 to 2033

Figure 60: Latin America Market Y-o-Y Growth (%) Projections by Additive Type, 2023 to 2033

Figure 61: Latin America Market Value (US$ Million) Analysis by Fuel Type, 2018 to 2033

Figure 62: Latin America Market Volume (Tons) Analysis by Fuel Type, 2018 to 2033

Figure 63: Latin America Market Value Share (%) and BPS Analysis by Fuel Type, 2023 to 2033

Figure 64: Latin America Market Y-o-Y Growth (%) Projections by Fuel Type, 2023 to 2033

Figure 65: Latin America Market Value (US$ Million) Analysis by Application, 2018 to 2033

Figure 66: Latin America Market Volume (Tons) Analysis by Application, 2018 to 2033

Figure 67: Latin America Market Value Share (%) and BPS Analysis by Application, 2023 to 2033

Figure 68: Latin America Market Y-o-Y Growth (%) Projections by Application, 2023 to 2033

Figure 69: Latin America Market Attractiveness by Additive Type, 2023 to 2033

Figure 70: Latin America Market Attractiveness by Fuel Type, 2023 to 2033

Figure 71: Latin America Market Attractiveness by Application, 2023 to 2033

Figure 72: Latin America Market Attractiveness by Country, 2023 to 2033

Figure 73: Western Europe Market Value (US$ Million) by Additive Type, 2023 to 2033

Figure 74: Western Europe Market Value (US$ Million) by Fuel Type, 2023 to 2033

Figure 75: Western Europe Market Value (US$ Million) by Application, 2023 to 2033

Figure 76: Western Europe Market Value (US$ Million) by Country, 2023 to 2033

Figure 77: Western Europe Market Value (US$ Million) Analysis by Country, 2018 to 2033

Figure 78: Western Europe Market Volume (Tons) Analysis by Country, 2018 to 2033

Figure 79: Western Europe Market Value Share (%) and BPS Analysis by Country, 2023 to 2033

Figure 80: Western Europe Market Y-o-Y Growth (%) Projections by Country, 2023 to 2033

Figure 81: Western Europe Market Value (US$ Million) Analysis by Additive Type, 2018 to 2033

Figure 82: Western Europe Market Volume (Tons) Analysis by Additive Type, 2018 to 2033

Figure 83: Western Europe Market Value Share (%) and BPS Analysis by Additive Type, 2023 to 2033

Figure 84: Western Europe Market Y-o-Y Growth (%) Projections by Additive Type, 2023 to 2033

Figure 85: Western Europe Market Value (US$ Million) Analysis by Fuel Type, 2018 to 2033

Figure 86: Western Europe Market Volume (Tons) Analysis by Fuel Type, 2018 to 2033

Figure 87: Western Europe Market Value Share (%) and BPS Analysis by Fuel Type, 2023 to 2033

Figure 88: Western Europe Market Y-o-Y Growth (%) Projections by Fuel Type, 2023 to 2033

Figure 89: Western Europe Market Value (US$ Million) Analysis by Application, 2018 to 2033

Figure 90: Western Europe Market Volume (Tons) Analysis by Application, 2018 to 2033

Figure 91: Western Europe Market Value Share (%) and BPS Analysis by Application, 2023 to 2033

Figure 92: Western Europe Market Y-o-Y Growth (%) Projections by Application, 2023 to 2033

Figure 93: Western Europe Market Attractiveness by Additive Type, 2023 to 2033

Figure 94: Western Europe Market Attractiveness by Fuel Type, 2023 to 2033

Figure 95: Western Europe Market Attractiveness by Application, 2023 to 2033

Figure 96: Western Europe Market Attractiveness by Country, 2023 to 2033

Figure 97: Eastern Europe Market Value (US$ Million) by Additive Type, 2023 to 2033

Figure 98: Eastern Europe Market Value (US$ Million) by Fuel Type, 2023 to 2033

Figure 99: Eastern Europe Market Value (US$ Million) by Application, 2023 to 2033

Figure 100: Eastern Europe Market Value (US$ Million) by Country, 2023 to 2033

Figure 101: Eastern Europe Market Value (US$ Million) Analysis by Country, 2018 to 2033

Figure 102: Eastern Europe Market Volume (Tons) Analysis by Country, 2018 to 2033

Figure 103: Eastern Europe Market Value Share (%) and BPS Analysis by Country, 2023 to 2033

Figure 104: Eastern Europe Market Y-o-Y Growth (%) Projections by Country, 2023 to 2033

Figure 105: Eastern Europe Market Value (US$ Million) Analysis by Additive Type, 2018 to 2033

Figure 106: Eastern Europe Market Volume (Tons) Analysis by Additive Type, 2018 to 2033

Figure 107: Eastern Europe Market Value Share (%) and BPS Analysis by Additive Type, 2023 to 2033

Figure 108: Eastern Europe Market Y-o-Y Growth (%) Projections by Additive Type, 2023 to 2033

Figure 109: Eastern Europe Market Value (US$ Million) Analysis by Fuel Type, 2018 to 2033

Figure 110: Eastern Europe Market Volume (Tons) Analysis by Fuel Type, 2018 to 2033

Figure 111: Eastern Europe Market Value Share (%) and BPS Analysis by Fuel Type, 2023 to 2033

Figure 112: Eastern Europe Market Y-o-Y Growth (%) Projections by Fuel Type, 2023 to 2033

Figure 113: Eastern Europe Market Value (US$ Million) Analysis by Application, 2018 to 2033

Figure 114: Eastern Europe Market Volume (Tons) Analysis by Application, 2018 to 2033

Figure 115: Eastern Europe Market Value Share (%) and BPS Analysis by Application, 2023 to 2033

Figure 116: Eastern Europe Market Y-o-Y Growth (%) Projections by Application, 2023 to 2033

Figure 117: Eastern Europe Market Attractiveness by Additive Type, 2023 to 2033

Figure 118: Eastern Europe Market Attractiveness by Fuel Type, 2023 to 2033

Figure 119: Eastern Europe Market Attractiveness by Application, 2023 to 2033

Figure 120: Eastern Europe Market Attractiveness by Country, 2023 to 2033

Figure 121: South Asia and Pacific Market Value (US$ Million) by Additive Type, 2023 to 2033

Figure 122: South Asia and Pacific Market Value (US$ Million) by Fuel Type, 2023 to 2033

Figure 123: South Asia and Pacific Market Value (US$ Million) by Application, 2023 to 2033

Figure 124: South Asia and Pacific Market Value (US$ Million) by Country, 2023 to 2033

Figure 125: South Asia and Pacific Market Value (US$ Million) Analysis by Country, 2018 to 2033

Figure 126: South Asia and Pacific Market Volume (Tons) Analysis by Country, 2018 to 2033

Figure 127: South Asia and Pacific Market Value Share (%) and BPS Analysis by Country, 2023 to 2033

Figure 128: South Asia and Pacific Market Y-o-Y Growth (%) Projections by Country, 2023 to 2033

Figure 129: South Asia and Pacific Market Value (US$ Million) Analysis by Additive Type, 2018 to 2033

Figure 130: South Asia and Pacific Market Volume (Tons) Analysis by Additive Type, 2018 to 2033

Figure 131: South Asia and Pacific Market Value Share (%) and BPS Analysis by Additive Type, 2023 to 2033

Figure 132: South Asia and Pacific Market Y-o-Y Growth (%) Projections by Additive Type, 2023 to 2033

Figure 133: South Asia and Pacific Market Value (US$ Million) Analysis by Fuel Type, 2018 to 2033

Figure 134: South Asia and Pacific Market Volume (Tons) Analysis by Fuel Type, 2018 to 2033

Figure 135: South Asia and Pacific Market Value Share (%) and BPS Analysis by Fuel Type, 2023 to 2033

Figure 136: South Asia and Pacific Market Y-o-Y Growth (%) Projections by Fuel Type, 2023 to 2033

Figure 137: South Asia and Pacific Market Value (US$ Million) Analysis by Application, 2018 to 2033

Figure 138: South Asia and Pacific Market Volume (Tons) Analysis by Application, 2018 to 2033

Figure 139: South Asia and Pacific Market Value Share (%) and BPS Analysis by Application, 2023 to 2033

Figure 140: South Asia and Pacific Market Y-o-Y Growth (%) Projections by Application, 2023 to 2033

Figure 141: South Asia and Pacific Market Attractiveness by Additive Type, 2023 to 2033

Figure 142: South Asia and Pacific Market Attractiveness by Fuel Type, 2023 to 2033

Figure 143: South Asia and Pacific Market Attractiveness by Application, 2023 to 2033

Figure 144: South Asia and Pacific Market Attractiveness by Country, 2023 to 2033

Figure 145: East Asia Market Value (US$ Million) by Additive Type, 2023 to 2033

Figure 146: East Asia Market Value (US$ Million) by Fuel Type, 2023 to 2033

Figure 147: East Asia Market Value (US$ Million) by Application, 2023 to 2033

Figure 148: East Asia Market Value (US$ Million) by Country, 2023 to 2033

Figure 149: East Asia Market Value (US$ Million) Analysis by Country, 2018 to 2033

Figure 150: East Asia Market Volume (Tons) Analysis by Country, 2018 to 2033

Figure 151: East Asia Market Value Share (%) and BPS Analysis by Country, 2023 to 2033

Figure 152: East Asia Market Y-o-Y Growth (%) Projections by Country, 2023 to 2033

Figure 153: East Asia Market Value (US$ Million) Analysis by Additive Type, 2018 to 2033

Figure 154: East Asia Market Volume (Tons) Analysis by Additive Type, 2018 to 2033

Figure 155: East Asia Market Value Share (%) and BPS Analysis by Additive Type, 2023 to 2033

Figure 156: East Asia Market Y-o-Y Growth (%) Projections by Additive Type, 2023 to 2033

Figure 157: East Asia Market Value (US$ Million) Analysis by Fuel Type, 2018 to 2033

Figure 158: East Asia Market Volume (Tons) Analysis by Fuel Type, 2018 to 2033

Figure 159: East Asia Market Value Share (%) and BPS Analysis by Fuel Type, 2023 to 2033

Figure 160: East Asia Market Y-o-Y Growth (%) Projections by Fuel Type, 2023 to 2033

Figure 161: East Asia Market Value (US$ Million) Analysis by Application, 2018 to 2033

Figure 162: East Asia Market Volume (Tons) Analysis by Application, 2018 to 2033

Figure 163: East Asia Market Value Share (%) and BPS Analysis by Application, 2023 to 2033

Figure 164: East Asia Market Y-o-Y Growth (%) Projections by Application, 2023 to 2033

Figure 165: East Asia Market Attractiveness by Additive Type, 2023 to 2033

Figure 166: East Asia Market Attractiveness by Fuel Type, 2023 to 2033

Figure 167: East Asia Market Attractiveness by Application, 2023 to 2033

Figure 168: East Asia Market Attractiveness by Country, 2023 to 2033

Figure 169: Middle East and Africa Market Value (US$ Million) by Additive Type, 2023 to 2033

Figure 170: Middle East and Africa Market Value (US$ Million) by Fuel Type, 2023 to 2033

Figure 171: Middle East and Africa Market Value (US$ Million) by Application, 2023 to 2033

Figure 172: Middle East and Africa Market Value (US$ Million) by Country, 2023 to 2033

Figure 173: Middle East and Africa Market Value (US$ Million) Analysis by Country, 2018 to 2033

Figure 174: Middle East and Africa Market Volume (Tons) Analysis by Country, 2018 to 2033

Figure 175: Middle East and Africa Market Value Share (%) and BPS Analysis by Country, 2023 to 2033

Figure 176: Middle East and Africa Market Y-o-Y Growth (%) Projections by Country, 2023 to 2033

Figure 177: Middle East and Africa Market Value (US$ Million) Analysis by Additive Type, 2018 to 2033

Figure 178: Middle East and Africa Market Volume (Tons) Analysis by Additive Type, 2018 to 2033

Figure 179: Middle East and Africa Market Value Share (%) and BPS Analysis by Additive Type, 2023 to 2033

Figure 180: Middle East and Africa Market Y-o-Y Growth (%) Projections by Additive Type, 2023 to 2033

Figure 181: Middle East and Africa Market Value (US$ Million) Analysis by Fuel Type, 2018 to 2033

Figure 182: Middle East and Africa Market Volume (Tons) Analysis by Fuel Type, 2018 to 2033

Figure 183: Middle East and Africa Market Value Share (%) and BPS Analysis by Fuel Type, 2023 to 2033

Figure 184: Middle East and Africa Market Y-o-Y Growth (%) Projections by Fuel Type, 2023 to 2033

Figure 185: Middle East and Africa Market Value (US$ Million) Analysis by Application, 2018 to 2033

Figure 186: Middle East and Africa Market Volume (Tons) Analysis by Application, 2018 to 2033

Figure 187: Middle East and Africa Market Value Share (%) and BPS Analysis by Application, 2023 to 2033

Figure 188: Middle East and Africa Market Y-o-Y Growth (%) Projections by Application, 2023 to 2033

Figure 189: Middle East and Africa Market Attractiveness by Additive Type, 2023 to 2033

Figure 190: Middle East and Africa Market Attractiveness by Fuel Type, 2023 to 2033

Figure 191: Middle East and Africa Market Attractiveness by Application, 2023 to 2033

Figure 192: Middle East and Africa Market Attractiveness by Country, 2023 to 2033

Recommendations

Chemicals & Materials

Friction Modifier Additives Market

Published : August 2023

Explore Chemicals & Materials Insights

View Reports

Aviation Fuel Additives Market