Behavioral Biometrics Market
Market Insights on Behavioral Biometrics covering sales outlook, demand forecast & up-to-date key trends
Behavioral Biometrics Market By Solution (Software, Services), Application (Identity Verification & Validation, Fraud Prevention, Multi-factor Authentication), Enterprise Size (SMEs, Large enterprises), Industry (BFSI, Retail and eCommerce, Healthcare, IT & Telecom , Government and Defense) & Region - Forecast 2021 - 2031
Behavioral Biometrics Industry Snapshot
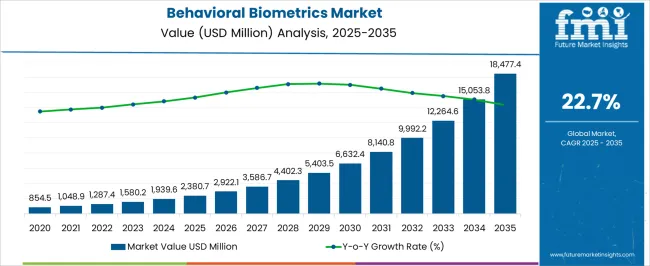
[420 Pages Report] The behavioral biometrics market revenue totaled ~US$ 1.1 Bn in 2020, according to Future Market Insights (FMI). The overall market is expected to reach ~US$ 11.2 Bn by 2031, growing at a CAGR of 23.6% for 2021 – 31.
The behavioral biometrics market growth will continue to accelerate, resulting in a higher degree of competition among key players. FMI has forecast the top 5 providers to account for around 55.0% of total market in 2020.
Base year (2020) Market Value |
US$ 1.1 Bn |
Projected year (2031) Market Value |
US$ 11.2 Bn |
CAGR% (2021-2031) |
23.6% |
Let us know your requirement to get
100% FREE customization
Behavioral Biometrics Market Outlook 2016-2020 Compared to 2021-2031 Forecast
Frequent developments and the implementation of new technologies/software such as advanced behavioral biometrics technologies, human behavioral patterns, and machine learning/deep learning for identity verification and validation, fraud prevention, and multi-factor authentication applications are creating opportunities for growth of the behavioral biometrics solutions.
Advantages such as flexibility, convenience, efficiency, and security, which also facilitate integration with cloud solutions are primary factors resulting in higher demand for behavioral biometrics being used on a global scale.
The integration of technologies such as the Internet of Things (IoT), Big Data, Artificial Intelligence (AI), and others can be expected to lead to development of the behavioral biometrics functionalities, with improved performance.
Based on aforementioned factors FMI predicts the behavioral biometrics demand to rise at 23.6% CAGR between 2021 and 2031 in comparison with 18.8% CAGR registered during 2016-2020.
Biometric authentication software helps improving security for networks, applications, and physical locations through integration of biometric factors such as additional access qualifier. Biometric authentication tools uses physical characteristics including facial, fingerprint, or voice recognition to verify a user’s identity.
Higher integration of the technology will enable the global behavioral biometrics market reach ~US$ 1.3 Bn in 2021 to ~US$ 11.2 Bn by 2031.
How is Behavioral Biometrics Application in Banking, Financial Services and Insurance (BFSI) Industry Affecting Growth?
Behavioral biometrics are mainly used for analyzing a user’s cognitive behavior and digital-physical features. It is gaining traction across diverse industries as an effective fraud prevention solution. Behavioral biometrics helps in distinguishing between legitimate users and cybercriminals and verifies people by how they perform and interact online rather than by their physical characteristics.
Behavioral biometrics are adopted across a range of industries with a digital presence and are poised to play a crucial role in building digital trust and safety. Digital banking is one of the most effective platforms for financial institutions to drive growth, attract new customers, and increase revenue.
Behavioral biometrics offers various benefits in the banking sectors such as account opening protection, account takeover protection, and social engineering scam detection, among others. The reliability offered by behavioral biometrics solutions will push their uptake in the BFSI sector.
Find your sweet spots for generating winning opportunities in this market.
Talk to AnalystReliable and Convenient Security Solutions Offered by Behavioral Biometrics Aiding Expansion
Ongoing digitization has created a lucrative revenue stream for the behavioral biometrics industry wherein access, security, and privacy of data remains at top of the mind of all digitally-driven businesses.
As password security has become vulnerable to breaches, businesses are seeking intelligent yet convenient security solutions to avoid fraudulent activities, financial losses, and market reputation.
Popular biometric technologies, ranging from fingerprint to facial recognition, have witnessed a demand uptick because they offer accurate, reliable, and cost-efficient security services. The reliance of enterprises on biometric technologies for security needs is set to fuel behavioral biometrics demand in the future.
Behavioral Biometrics Market - Country-wise Insights
How big is the Opportunity for Adoption of Behavioral Biometrics in the U.S.?
North America is predicted to remain one of the most attractive markets during the forecast period. According to the study, the U.S. is expected to account for nearly 79% of the North America market share through 2031.
The U.S. is the largest market for behavioral biometrics due to the strong presence of some of the leading behavioral biometrics software and service providers. Implementation of behavioral biometrics creates unique records of individuals and helps in elimination of data duplication and fraud activities, thereby combating identity fraud.
Hence, the demand for behavioral biometrics would increase across various organizations in the U.S., during the forecast period.
Why is Demand for Behavioral Biometrics Increasing in the France?
The behavioral biometrics demand in the France is expected to rise at a CAGR of around 27.2% over the forecast period. France is increasingly powered by Internet of Things (IoT), human behavioral patterns, smart sensors, machine learning/deep learning, smartphone technology, and peer-to-peer networks.
Governments in Europe are encouraging the use of face biometrics incorporated civil ID cards for issuing passports and driving license. This is one of the factors driving behavioral biometrics demand in France and elsewhere in Europe. Furthermore, the increasing demand for a multi-layered security approach in banking and financial institutions is anticipated to drive growth in the country.
How will the Sales Prospects for Behavioral Biometrics Solutions unfold in India?
The sales in India are expected to increase at around 38% CAGR between 2021 and 2031. There is continuous development and implementation of new technologies/solution such as behavioral biometrics software across organizations in India.
The proliferation of and real-time payment and mobile payment platforms in the country has augmented cases of fraud, which is fueling the demand for behavioral biometrics. In addition to this, financial solution providers in the South Asia & Pacific region are focusing on offering secured authentication solutions based on advanced behavioral biometrics technologies to their customers.

An unified Market Research Subscription Platform, built for today’s disparate research needs.
Behavioral Biometrics Market - Category-wise Insights
Why is the Demand for Behavioral Biometrics Software Increasing?
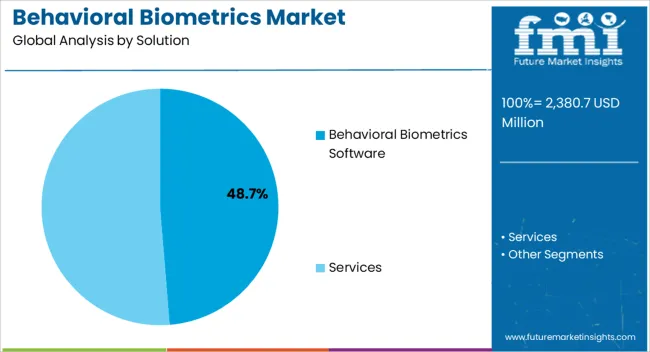
Based on solution, behavioral biometrics solutions are available as behavioral biometrics software and services. The behavioral biometrics software segment was valued US$ 680.0 Mn in 2020 and is also anticipated to register a high CAGR during the forecast period (2021-2031).
Behavioral biometrics software offers various benefits such as better user experience, fast and inexpensive deployment, flexibility, increased security, and are compliant with regulations.
Behavioral biometric authentication solutions identify a person based on human behavioral patterns exhibited when they interact with a device like smartphone, tablet, or computer with including mouse and keyboard.
Why are Identity Verification & Validation Applications of Behavioral Biometrics Increasing?
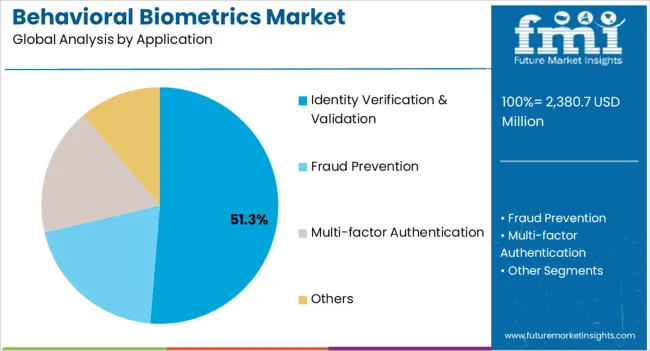
On the basis of application, behavioral biometrics is segmented into identity verification & validation, fraud prevention, multi-factor authentication, and others. Rising awareness among organizations about the requirement to maintain the privacy of their data and counter the increasingly frequent and sophisticated cyber-attacks, identity-related fraud, malware, and data breaches targeted at their data is further expected to drive the identity verification & validation application segment growth
Identity verification & validation application had the highest market share in terms of value in 2020 and is set to report a CAGR of 23.6% from 2021 to 2031. The identity verification & validation solutions provide different authentication options to users based on their privilege levels. For instance, June 2020, Incognia launched location-based behavioral biometrics solution to combat mobile fraud. Implementation of behavioral biometrics helps to fight the cybercrimes as well.
Why is the Adoption of Behavioral Biometrics HigherMostly Preferred in Large Enterprises?
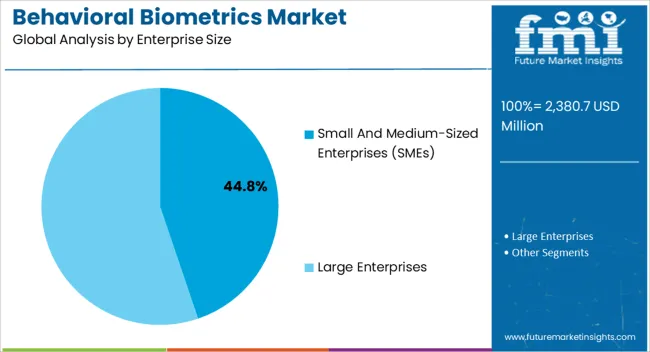
The large enterprises segment accounted for more than 59.2% of the overall market share in 2020, and is expected to continue its dominance during the forecast period. Large enterprises have been focusing on implementing behavioral biometrics solution in their business applications to improve customer security and overcome infrastructure costs.
Emerging trend of online transactions is encouraging large enterprises large multinational banks and financial institution to adopt advanced and more sophisticated service platforms. Rising cases of cyber-attacks and sophisticated data theft are propelling the adoption of behavioral biometrics-based cybersecurity systems, which enable flexible authentication and persistent security, in the large enterprises.
Why is Demand from Banking, Financial Services and Insurance (BFSI) Industry Rising?
On the basis of industry, behavioral biometrics is segmented into banking, financial services and insurance (BFSI), retail and eCommerce, healthcare, IT & telecom, government and defense, and others.
The BFSI segment held the highest market share in terms of value in 2020 and is set to register a CAGR of 27.0% from 2021 to 2031. BFSI industry segment is expected to witness substantially high demand during the forecast period due to its advantages including ease of operation, flexibility, security, and cost proficiency.
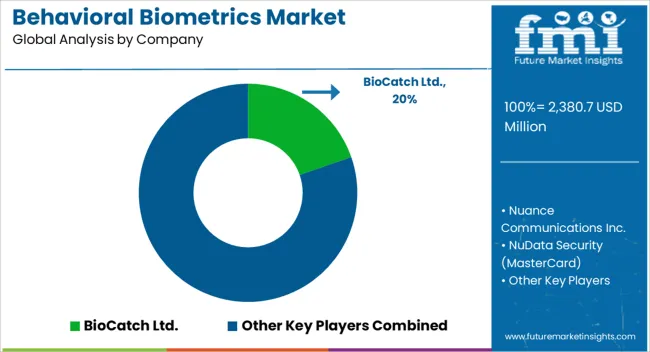
Behavioral Biometrics Market - Competitive Landscape
Implementation of behavioral biometrics facilitates secure authentication in financial institutions, businesses, government facilities and retail Point-of-Sale (POS), and in other environments. Behavioral biometric verification methods include keystroke dynamics, gait analysis, voice ID, mouse use characteristics, signature analysis and cognitive biometrics.
For instance, October 2021, BioCatch, a leading behavioral biometrics company launched behavioral biometric software to protect vulnerable segments of the population against fraud. The software is a new account opening protection capability that’s focused on shielding elderly consumers from fraudulent practices.
Scope of Report
Attribute |
Details |
Market value in 2021 |
US$ 1.3 Bn |
Market CAGR 2021 to 2031 |
23.6% |
Share of top 5 players |
Around 55% |
Forecast Period |
2021-2031 |
Historical Data Available for |
2016-2020 |
Market Analysis |
USD Million for Value |
Key Regions Covered |
North America, Latin America, Europe, East Asia, South Asia & Pacific, and the Middle East & Africa |
Key Countries Covered |
US, Canada, Germany, U.K., France, Italy, Spain, Russia, China, Japan, South Korea, India, Malaysia, Indonesia, Singapore, Australia & New Zealand, GCC Countries, Turkey, North Africa and South Africa |
Key Segments Covered |
Solution, Application, Enterprise Size, Industry, and Region |
Key Companies Profiled |
|
Report Coverage |
Market Forecast, Company Share Analysis, Competition Intelligence, DROT Analysis, Market Dynamics and Challenges, and Strategic Growth Initiatives |
Customization & Pricing |
Available upon Request |
Behavioral Biometrics Market Outlook by Category
By Solution, Behavioral Biometrics Demand is segmented as:
- Behavioral Biometrics Software
- Cloud-Based
- On-Premise
- Services
- Professional Services
- Consulting Services
- Implementation Services
- Support & Maintenance
- Managed Services
- Professional Services
By Application, Behavioral Biometrics Outlook is segmented as:
- Identity Verification & Validation
- Fraud Prevention
- Multi-factor Authentication
- Others
By Enterprise Size, Behavioral Biometrics Outlook is segmented as:
- Small and Medium-sized Enterprises (SMEs)
- Large enterprises
By Industry, Behavioral Biometrics Demand is segmented as:
- Banking, Financial Services and Insurance (BFSI)
- Retail and eCommerce
- Healthcare
- IT & Telecom
- Government and Defense
- Others
By Region, Behavioral Biometrics Sales is segmented as:
- North America
- Latin America
- Europe
- East Asia
- South Asia & Pacific
- Middle East and Africa (MEA)
Frequently Asked Questions
South Asia & Pacific is projected to register robust growth in the market, exhibiting a CAGR of nearly 33% during the forecast period from 2021 to 2031.
Some of the leading companies in this landscape are BioCatch Ltd., Nuance Communications Inc., SecuredTouch Ltd. (Ping Identity), and Fair Issac Corporation, among others. As per Future Market Insight, nearly 55%-60% of the market share is currently covered by the top 15 players.
Banking, financial services and insurance (BFSI) segment is expected to dominate the market over the forecast period, accounting for maximum revenue share in the market. Demand in the banking, financial services and insurance (BFSI) segment is also projected to increase by 27% CAGR during the forecast period.
The behavioral biometrics industry was valued at ~US$ 1.1 Bn in 2020, and is estimated to grow at an exceptional pace with a CAGR of 23.6%.
The sales of behavioral biometrics solutions are expected to total ~US$ 1.3 Bn by the end of 2021, and is likely to reach ~US$ 11.2 Bn by 2031.
The market in last 5 years (2016 – 2020) grew by a CAGR of 18.8%.
Key trends in the market includes: • Technological advancements in cybersecurity to create new growth opportunities • Rise in sophistication level of security threats to drive solution demand • Implementation of behavioral biometrics in payments industry for secure transaction
Implementation of behavioral biometrics to improve customer experience and adoption of convenient security solutions have increased the demand of behavioral biometrics solution and are the key factors driving the market growth.
Top 5 countries driving demand for behavioral biometrics include the India, China, U.S., and Malaysia.
North America is predicted to remain one of the most attractive markets during the forecast period. According to the study, U.S. is expected to account for nearly 78.7% of the Europe market through 2031.
The behavioral biometrics demand in China and India is projected to grow at CAGR of around 25.6% and 38.2%, respectively between 2021 and 2031.
Table of Content
1. Executive Summary
1.1. Global Market Outlook
1.2. Demand Side Trends
1.3. Supply Side Trends
1.4. Analysis and Recommendations
2. Market Overview
2.1. Market Coverage / Taxonomy
2.2. Market Definition / Scope / Limitations
3. Key Market Trends
3.1. Key Trends Impacting the Market
3.2. Behavioral Biometrics Technology Innovation / Development Trends
3.3. Key Success Factors
4. Behavioral Biometrics Examples & Use Cases
4.1. Phishing Attacks
4.2. Identity Fraud
4.3. Insider Threats
4.4. Stolen Credentials
4.5. Others
5. Types of Behavioral Biometrics
5.1. Body Movements
5.2. Voice Inputs
5.3. Device-Based Gestures
6. Pricing Analysis
6.1. Pricing Analysis, By Solution
6.2. Average Pricing Analysis Benchmark
7. COVID-19 Pandemic Crisis Impact Analysis
7.1. Impact of COVID-19 Pandemic Crisis on Behavioral Biometrics Market
7.1.1. Pre-COVID-19 Analysis (2017-2019)
7.1.2. Post-COVID-19 Analysis (2020 & beyond)
7.2. Expected Recovery Scenario (Short-term / Mid-term / Long-term)
7.3. Key Action Points for Behavioral Biometrics Vendors
8. Market Structure Analysis
8.1. Market Analysis by Tier of Companies
8.2. Market Share Analysis of Top Players
8.3. Market Presence Analysis, Regional footprint by Players
9. Global Behavioral Biometrics Market Demand (in Value in US$ Mn) Analysis 2016-2020 and Forecast, 2021-2031
9.1. Historical Market Value (US$ Mn) Analysis, 2016-2020
9.2. Current and Future Market Value (US$ Mn) Projections, 2021-2031
9.2.1. Y-o-Y Growth Trend Analysis
9.2.2. Absolute $ Opportunity Analysis
10. Market Background
10.1. Macro-Economic Factors
10.1.1. Global GDP Growth Outlook
10.1.2. Global ICT Market Outlook
10.2. Forecast Factors - Relevance & Impact
10.2.1. Historic Growth Rate of Behavioral Biometrics Providers
10.2.2. Business Impact of COVID-19 on Global Economy
10.3. Value Chain Analysis
10.4. Market Dynamics
10.4.1. Drivers
10.4.2. Restraints
10.4.3. Opportunities
11. Global Behavioral Biometrics Market Analysis 2016-2020 and Forecast 2021-2031, Solution
11.1. Introduction / Key Findings
11.2. Historical Market Size (US$ Mn) Analysis Solution, 2016 - 2020
11.3. Current and Future Market Size (US$ Mn) Analysis and Forecast Solution, 2021 - 2031
11.3.1. Behavioral Biometrics Software
11.3.1.1. Cloud-Based
11.3.1.2. On-Premise
11.3.2. Services
11.3.2.1. Professional Services
11.3.2.1.1. Consulting Services
11.3.2.1.2. Implementation Services
11.3.2.1.3. Support & Maintenance
11.3.2.2. Managed Services
11.4. Market Attractiveness Analysis Solution
12. Global Behavioral Biometrics Market Analysis 2016-2020 and Forecast 2021-2031, by Application
12.1. Introduction / Key Findings
12.2. Historical Market Size (US$ Mn) Analysis By Application, 2016 - 2020
12.3. Current and Future Market Size (US$ Mn) Analysis and Forecast By Application, 2021 - 2031
12.3.1. Identity Verification & Validation
12.3.2. Fraud Prevention
12.3.3. Multi-factor Authentication
12.3.4. Others
12.4. Market Attractiveness Analysis By Application
13. Global Behavioral Biometrics Market Analysis 2016-2020 and Forecast 2021-2031, by Enterprises Size
13.1. Introduction / Key Findings
13.2. Historical Market Size (US$ Mn) Analysis By Enterprises Size, 2016 - 2020
13.3. Current and Future Market Size (US$ Mn) Analysis and Forecast By Enterprises Size, 2021 - 2031
13.3.1. Small and Medium-sized Enterprises (SMEs)
13.3.2. Large enterprises
13.4. Market Attractiveness Analysis By Enterprises Size
14. Global Behavioral Biometrics Market Analysis 2016-2020 and Forecast 2021-2031, by Industry
14.1. Introduction / Key Findings
14.2. Historical Market Size (US$ Mn) Analysis By Industry, 2016 - 2020
14.3. Current and Future Market Size (US$ Mn) Analysis and Forecast By Industry, 2021 - 2031
14.3.1. Banking, Financial Services and Insurance (BFSI)
14.3.2. Retail and eCommerce
14.3.3. Healthcare
14.3.4. IT & Telecom
14.3.5. Government and Defense
14.3.6. Others
14.4. Market Attractiveness Analysis By Industry
15. Global Behavioral Biometrics Market Analysis 2016-2020 and Forecast 2021-2031, by Region
15.1. Introduction / Key Findings
15.2. Historical Market Size (US$ Mn) Analysis By Region, 2016 - 2020
15.3. Current and Future Market Size (US$ Mn) Analysis and Forecast By Region, 2021 - 2031
15.3.1. North America
15.3.2. Latin America
15.3.3. Europe
15.3.4. East Asia
15.3.5. South Asia & Pacific
15.3.6. Middle East & Africa
15.4. Market Attractiveness Analysis By Region
16. North America Behavioral Biometrics Market Analysis 2016-2020 and Forecast 2021-2031
16.1. Introduction
16.2. Historical Market Size (US$ Mn) Trend Analysis By Market Taxonomy, 2016 - 2020
16.3. Current and Future Market Size (US$ Mn) Forecast By Market Taxonomy, 2021 - 2031
16.3.1. By Solution
16.3.2. By Application
16.3.3. By Enterprises Size
16.3.4. By Industry
16.3.5. By Country
16.3.5.1. U.S.
16.3.5.2. Canada
16.4. Market Attractiveness Analysis
16.4.1. By Solution
16.4.2. By Application
16.4.3. By Enterprises Size
16.4.4. By Industry
16.4.5. By Country
16.5. Drivers and Restraints - Impact Analysis
17. Latin America Behavioral Biometrics Market Analysis 2016-2020 and Forecast 2021-2031
17.1. Introduction
17.2. Historical Market Size (US$ Mn) Trend Analysis By Market Taxonomy, 2016 - 2020
17.3. Current and Future Market Size (US$ Mn) Forecast By Market Taxonomy, 2021 - 2031
17.3.1. By Solution
17.3.2. By Application
17.3.3. By Enterprises Size
17.3.4. By Industry
17.3.5. By Country
17.3.5.1. Brazil
17.3.5.2. Mexico
17.3.5.3. Rest of Latin America
17.4. Market Attractiveness Analysis
17.4.1. By Solution
17.4.2. By Application
17.4.3. By Enterprises Size
17.4.4. By Industry
17.4.5. By Country
17.5. Drivers and Restraints - Impact Analysis
18. Europe Behavioral Biometrics Market Analysis 2016-2020 and Forecast 2021-2031
18.1. Introduction
18.2. Historical Market Size (US$ Mn) Trend Analysis By Market Taxonomy, 2016 - 2020
18.3. Current and Future Market Size (US$ Mn) Forecast By Market Taxonomy, 2021 - 2031
18.3.1. By Solution
18.3.2. By Application
18.3.3. By Enterprises Size
18.3.4. By Industry
18.3.5. By Country
18.3.5.1. Germany
18.3.5.2. Italy
18.3.5.3. France
18.3.5.4. U.K.
18.3.5.5. Spain
18.3.5.6. BENELUX
18.3.5.7. Russia
18.3.5.8. Rest of Europe
18.4. Market Attractiveness Analysis
18.4.1. By Solution
18.4.2. By Application
18.4.3. By Enterprises Size
18.4.4. By Industry
18.4.5. By Country
18.5. Drivers and Restraints - Impact Analysis
19. South Asia & Pacific Behavioral Biometrics Market Analysis 2016-2020 and Forecast 2021-2031
19.1. Introduction
19.2. Historical Market Size (US$ Mn) Trend Analysis By Market Taxonomy, 2016 - 2020
19.3. Current and Future Market Size (US$ Mn) Forecast By Market Taxonomy, 2021 - 2031
19.3.1. By Solution
19.3.2. By Application
19.3.3. By Enterprises Size
19.3.4. By Industry
19.3.5. By Country
19.3.5.1. India
19.3.5.2. Thailand
19.3.5.3. Indonesia
19.3.5.4. Malaysia
19.3.5.5. Australia & New Zealand
19.3.5.6. Rest of South Asia
19.4. Market Attractiveness Analysis
19.4.1. By Solution
19.4.2. By Application
19.4.3. By Enterprises Size
19.4.4. By Industry
19.4.5. By Country
19.5. Drivers and Restraints - Impact Analysis
20. East Asia Behavioral Biometrics Market Analysis 2016-2020 and Forecast 2021-2031
20.1. Introduction
20.2. Historical Market Size (US$ Mn) Trend Analysis By Market Taxonomy, 2016 - 2020
20.3. Current and Future Market Size (US$ Mn) Forecast By Market Taxonomy, 2021 - 2031
20.3.1. By Solution
20.3.2. By Application
20.3.3. By Enterprises Size
20.3.4. By Industry
20.3.5. By Country
20.3.5.1. China
20.3.5.2. Japan
20.3.5.3. South Korea
20.4. Market Attractiveness Analysis
20.4.1. By Solution
20.4.2. By Application
20.4.3. By Enterprises Size
20.4.4. By Industry
20.4.5. By Country
20.5. Drivers and Restraints - Impact Analysis
21. Middle East and Africa Behavioral Biometrics Market Analysis 2016-2020 and Forecast 2021-2031
21.1. Introduction
21.2. Historical Market Size (US$ Mn) Trend Analysis By Market Taxonomy, 2016 - 2020
21.3. Current and Future Market Size (US$ Mn) Forecast By Market Taxonomy, 2021 - 2031
21.3.1. By Solution
21.3.2. By Application
21.3.3. By Enterprises Size
21.3.4. By Industry
21.3.5. By Country
21.3.5.1. GCC Countries
21.3.5.2. Turkey
21.3.5.3. South Africa
21.3.5.4. Rest of Middle East and Africa
21.4. Market Attractiveness Analysis
21.4.1. By Solution
21.4.2. By Application
21.4.3. By Enterprises Size
21.4.4. By Industry
21.4.5. By Country
21.5. Drivers and Restraints - Impact Analysis
22. Key Countries Opportunity Analysis- Behavioral Biometrics Market
22.1. U.S. Behavioral Biometrics Market Opportunity Analysis
22.1.1. By Solution
22.1.2. By Application
22.1.3. By Enterprises Size
22.1.4. By Industry
22.2. Canada Behavioral Biometrics Market Opportunity Analysis
22.2.1. By Solution
22.2.2. By Application
22.2.3. By Enterprises Size
22.2.4. By Industry
22.3. Mexico Behavioral Biometrics Market Opportunity Analysis
22.3.1. By Solution
22.3.2. By Application
22.3.3. By Enterprises Size
22.3.4. By Industry
22.4. Brazil Behavioral Biometrics Market Opportunity Analysis
22.4.1. By Solution
22.4.2. By Application
22.4.3. By Enterprises Size
22.4.4. By Industry
22.5. Germany Behavioral Biometrics Market Opportunity Analysis
22.5.1. By Solution
22.5.2. By Application
22.5.3. By Enterprises Size
22.5.4. By Industry
22.6. Italy Behavioral Biometrics Market Opportunity Analysis
22.6.1. By Solution
22.6.2. By Application
22.6.3. By Enterprises Size
22.6.4. By Industry
22.7. France Behavioral Biometrics Market Opportunity Analysis
22.7.1. By Solution
22.7.2. By Application
22.7.3. By Enterprises Size
22.7.4. By Industry
22.8. U.K. Behavioral Biometrics Market Opportunity Analysis
22.8.1. By Solution
22.8.2. By Application
22.8.3. By Enterprises Size
22.8.4. By Industry
22.9. Spain Behavioral Biometrics Market Opportunity Analysis
22.9.1. By Solution
22.9.2. By Application
22.9.3. By Enterprises Size
22.9.4. By Industry
22.10. BENELUX Behavioral Biometrics Market Opportunity Analysis
22.10.1. By Solution
22.10.2. By Application
22.10.3. By Enterprises Size
22.10.4. By Industry
22.11. Russia Behavioral Biometrics Market Opportunity Analysis
22.11.1. By Solution
22.11.2. By Application
22.11.3. By Enterprises Size
22.11.4. By Industry
22.12. China Behavioral Biometrics Market Opportunity Analysis
22.12.1. By Solution
22.12.2. By Application
22.12.3. By Enterprises Size
22.12.4. By Industry
22.13. Japan Behavioral Biometrics Market Opportunity Analysis
22.13.1. By Solution
22.13.2. By Application
22.13.3. By Enterprises Size
22.13.4. By Industry
22.14. South Korea Behavioral Biometrics Market Opportunity Analysis
22.14.1. By Solution
22.14.2. By Application
22.14.3. By Enterprises Size
22.14.4. By Industry
22.15. India Behavioral Biometrics Market Opportunity Analysis
22.15.1. By Solution
22.15.2. By Application
22.15.3. By Enterprises Size
22.15.4. By Industry
22.16. ASEAN Behavioral Biometrics Market Opportunity Analysis
22.16.1. By Solution
22.16.2. By Application
22.16.3. By Enterprises Size
22.16.4. By Industry
22.17. Australia and New Zealand Behavioral Biometrics Market Opportunity Analysis
22.17.1. By Solution
22.17.2. By Application
22.17.3. By Enterprises Size
22.17.4. By Industry
22.18. GCC Countries Behavioral Biometrics Market Opportunity Analysis
22.18.1. By Solution
22.18.2. By Application
22.18.3. By Enterprises Size
22.18.4. By Industry
22.19. Turkey Behavioral Biometrics Market Opportunity Analysis
22.19.1. By Solution
22.19.2. By Application
22.19.3. By Enterprises Size
22.19.4. By Industry
22.20. South Africa Behavioral Biometrics Market Opportunity Analysis
22.20.1. By Solution
22.20.2. By Application
22.20.3. By Enterprises Size
22.20.4. By Industry
23. Competition Analysis
23.1. Dashboard for Key Behavioral Biometrics Vendors
23.2. Competition Deep Dive
23.2.1. BioCatch Ltd.
23.2.1.1. Business Overview
23.2.1.2. Solution Offering
23.2.1.3. Key Financial Outlook (Business Segment/Region)
23.2.1.4. Key Market Developments
23.2.1.5. Strategy Overview
23.2.1.5.1. Product Strategy
23.2.1.5.2. Business Strategy
23.2.2. Nuance Communications Inc.
23.2.2.1. Business Overview
23.2.2.2. Solution Offering
23.2.2.3. Key Financial Outlook (Business Segment/Region)
23.2.2.4. Key Market Developments
23.2.2.5. Strategy Overview
23.2.2.5.1. Product Strategy
23.2.2.5.2. Business Strategy
23.2.3. NuData Security (MasterCard)
23.2.3.1. Business Overview
23.2.3.2. Solution Offering
23.2.3.3. Key Financial Outlook (Business Segment/Region)
23.2.3.4. Key Market Developments
23.2.3.5. Strategy Overview
23.2.3.5.1. Product Strategy
23.2.3.5.2. Business Strategy
23.2.4. SecuredTouch Ltd.(Ping Identity)
23.2.4.1. Business Overview
23.2.4.2. Solution Offering
23.2.4.3. Key Financial Outlook (Business Segment/Region)
23.2.4.4. Key Market Developments
23.2.4.5. Strategy Overview
23.2.4.5.1. Product Strategy
23.2.4.5.2. Business Strategy
23.2.5. UnifyID (Prove)
23.2.5.1. Business Overview
23.2.5.2. Solution Offering
23.2.5.3. Key Financial Outlook (Business Segment/Region)
23.2.5.4. Key Market Developments
23.2.5.5. Strategy Overview
23.2.5.5.1. Product Strategy
23.2.5.5.2. Business Strategy
23.2.6. Fair Issac Corporation
23.2.6.1. Business Overview
23.2.6.2. Solution Offering
23.2.6.3. Key Financial Outlook (Business Segment/Region)
23.2.6.4. Key Market Developments
23.2.6.5. Strategy Overview
23.2.6.5.1. Product Strategy
23.2.6.5.2. Business Strategy
23.2.7. BehavioSec Inc.
23.2.7.1. Business Overview
23.2.7.2. Solution Offering
23.2.7.3. Key Financial Outlook (Business Segment/Region)
23.2.7.4. Key Market Developments
23.2.7.5. Strategy Overview
23.2.7.5.1. Product Strategy
23.2.7.5.2. Business Strategy
23.2.8. ThreatMark
23.2.8.1. Business Overview
23.2.8.2. Solution Offering
23.2.8.3. Key Financial Outlook (Business Segment/Region)
23.2.8.4. Key Market Developments
23.2.8.5. Strategy Overview
23.2.8.5.1. Product Strategy
23.2.8.5.2. Business Strategy
23.2.9. Callsign Inc.
23.2.9.1. Business Overview
23.2.9.2. Solution Offering
23.2.9.3. Key Financial Outlook (Business Segment/Region)
23.2.9.4. Key Market Developments
23.2.9.5. Strategy Overview
23.2.9.5.1. Product Strategy
23.2.9.5.2. Business Strategy
23.2.10. Adjust GmbH (AppLovin)
23.2.10.1. Business Overview
23.2.10.2. Solution Offering
23.2.10.3. Key Financial Outlook (Business Segment/Region)
23.2.10.4. Key Market Developments
23.2.10.5. Strategy Overview
23.2.10.5.1. Product Strategy
23.2.10.5.2. Business Strategy
24. Assumptions and Acronyms Used
25. Research Methodology
Let us know your requirement to get
100% FREE customization
List of Tables
Table 01: Global Behavioral Biometrics Market Value (US$ Mn) Analysis (2016 – 2020) by Solution
Table 02: Global Behavioral Biometrics Market Value (US$ Mn) Analysis (2021 – 2031) by Solution
Table 03: Global Behavioral Biometrics Market Value (US$ Mn) Analysis (2016 – 2020) by Application
Table 04: Global Behavioral Biometrics Market Value (US$ Mn) Analysis (2021 – 2031) by Application
Table 05: Global Behavioral Biometrics Market Value (US$ Mn) Analysis (2016 – 2020) by Enterprise Size
Table 06: Global Behavioral Biometrics Market Value (US$ Mn) Analysis (2021 – 2031) by Enterprise Size
Table 07: Global Behavioral Biometrics Market Value (US$ Mn) Analysis (2016 – 2020) by Industry
Table 08: Global Behavioral Biometrics Market Value (US$ Mn) Analysis (2021 – 2031) by Industry
Table 09: Global Behavioral Biometrics Market Value (US$ Mn) Analysis (2016 – 2020) by Region
Table 10: Global Behavioral Biometrics Market Value (US$ Mn) Forecast (2021 – 2031) by Region
Table 11: North America Behavioral Biometrics Market Value (US$ Mn) Analysis (2016 – 2020) by Solution
Table 12: North America Behavioral Biometrics Market Value (US$ Mn) Analysis (2021 – 2031) by Solution
Table 13: North America Behavioral Biometrics Market Value (US$ Mn) Analysis (2016 – 2020) by Application
Table 14: North America Behavioral Biometrics Market Value (US$ Mn) Analysis (2021 – 2031) by Application
Table 15: North America Behavioral Biometrics Market Value (US$ Mn) Analysis (2016 – 2020) by Enterprise Size
Table 16: North America Behavioral Biometrics Market Value (US$ Mn) Analysis (2021 – 2031) by Enterprise Size
Table 17: North America Behavioral Biometrics Market Value (US$ Mn) Analysis (2016 – 2020) by Industry
Table 18: North America Behavioral Biometrics Market Value (US$ Mn) Analysis (2021 – 2031) by Industry
Table 19: North America Behavioral Biometrics Market Value (US$ Mn) Analysis (2016 – 2020) by Country
Table 20: North America Behavioral Biometrics Market Value (US$ Mn) Forecast (2021 – 2031) by Country
Table 21: Latin America Behavioral Biometrics Market Value (US$ Mn) Analysis (2016 – 2020) by Solution
Table 22: Latin America Behavioral Biometrics Market Value (US$ Mn) Analysis (2021 – 2031) by Solution
Table 23: Latin America Behavioral Biometrics Market Value (US$ Mn) Analysis (2016 – 2020) by Application
Table 24: Latin America Behavioral Biometrics Market Value (US$ Mn) Analysis (2021 – 2031) by Application
Table 25: Latin America Behavioral Biometrics Market Value (US$ Mn) Analysis (2016 – 2020) by Enterprise Size
Table 26: Latin America Behavioral Biometrics Market Value (US$ Mn) Analysis (2021 – 2031) by Enterprise Size
Table 27: Latin America Behavioral Biometrics Market Value (US$ Mn) Analysis (2016 – 2020) by Industry
Table 28: Latin America Behavioral Biometrics Market Value (US$ Mn) Analysis (2021 – 2031) by Industry
Table 29: Latin America Behavioral Biometrics Market Value (US$ Mn) Analysis (2016 – 2020) by Country
Table 30: Latin America Behavioral Biometrics Market Value (US$ Mn) Forecast (2021 – 2031) by Country
Table 31: Europe Behavioral Biometrics Market Value (US$ Mn) Analysis (2016 – 2020) by Solution
Table 32: Europe Behavioral Biometrics Market Value (US$ Mn) Analysis (2021 – 2031) by Solution
Table 33: Europe Behavioral Biometrics Market Value (US$ Mn) Analysis (2016 – 2020) by Application
Table 34: Europe Behavioral Biometrics Market Value (US$ Mn) Analysis (2021 – 2031) by Application
Table 35: Europe Behavioral Biometrics Market Value (US$ Mn) Analysis (2016 – 2020) by Enterprise Size
Table 36: Europe Behavioral Biometrics Market Value (US$ Mn) Analysis (2021 – 2031) by Enterprise Size
Table 37: Europe Behavioral Biometrics Market Value (US$ Mn) Analysis (2016 – 2020) by Industry
Table 38: Europe Behavioral Biometrics Market Value (US$ Mn) Analysis (2021 – 2031) by Industry
Table 39: Europe Behavioral Biometrics Market Value (US$ Mn) Analysis (2016 – 2020) by Country
Table 40: Europe Behavioral Biometrics Market Value (US$ Mn) Forecast (2021 – 2031) by Country
Table 41: South Asia & Pacific Behavioral Biometrics Market Value (US$ Mn) Analysis (2016 – 2020) by Solution
Table 42: South Asia & Pacific Behavioral Biometrics Market Value (US$ Mn) Analysis (2021 – 2031) by Solution
Table 43: South Asia & Pacific Behavioral Biometrics Market Value (US$ Mn) Analysis (2016 – 2020) by Application
Table 44: South Asia & Pacific Behavioral Biometrics Market Value (US$ Mn) Analysis (2021 – 2031) by Application
Table 45: South Asia & Pacific Behavioral Biometrics Market Value (US$ Mn) Analysis (2016 – 2020) by Enterprise Size
Table 46: South Asia & Pacific Behavioral Biometrics Market Value (US$ Mn) Analysis (2021 – 2031) by Enterprise Size
Table 47: South Asia & Pacific Behavioral Biometrics Market Value (US$ Mn) Analysis (2016 – 2020) by Industry
Table 48: South Asia & Pacific Behavioral Biometrics Market Value (US$ Mn) Analysis (2021 – 2031) by Industry
Table 49: South Asia & Pacific Behavioral Biometrics Market Value (US$ Mn) Analysis (2016 – 2020) by Country
Table 50: South Asia & Pacific Behavioral Biometrics Market Value (US$ Mn) Forecast (2021 – 2031) by Country
Table 51: East Asia Behavioral Biometrics Market Value (US$ Mn) Analysis (2016 – 2020) by Solution
Table 52: East Asia Behavioral Biometrics Market Value (US$ Mn) Analysis (2021 – 2031) by Solution
Table 53: East Asia Behavioral Biometrics Market Value (US$ Mn) Analysis (2016 – 2020) by Application
Table 54: East Asia Behavioral Biometrics Market Value (US$ Mn) Analysis (2021 – 2031) by Application
Table 55: East Asia Behavioral Biometrics Market Value (US$ Mn) Analysis (2016 – 2020) by Enterprise Size
Table 56: East Asia Behavioral Biometrics Market Value (US$ Mn) Analysis (2021 – 2031) by Enterprise Size
Table 57: East Asia Behavioral Biometrics Market Value (US$ Mn) Analysis (2016 – 2020) by Industry
Table 58: East Asia Behavioral Biometrics Market Value (US$ Mn) Analysis (2021 – 2031) by Industry
Table 59: East Asia Behavioral Biometrics Market Value (US$ Mn) Analysis (2016 – 2020) by Country
Table 60: East Asia Behavioral Biometrics Market Value (US$ Mn) Forecast (2021 – 2031) by Country
Table 61: Middle East and Africa Behavioral Biometrics Market Value (US$ Mn) Analysis (2016 – 2020) by Solution
Table 62: Middle East and Africa Behavioral Biometrics Market Value (US$ Mn) Analysis (2021 – 2031) by Solution
Table 63: Middle East and Africa Behavioral Biometrics Market Value (US$ Mn) Analysis (2016 – 2020) by Application
Table 64: Middle East and Africa Behavioral Biometrics Market Value (US$ Mn) Analysis (2021 – 2031) by Application
Table 65: Middle East and Africa Behavioral Biometrics Market Value (US$ Mn) Analysis (2016 – 2020) by Enterprise Size
Table 66: Middle East and Africa Behavioral Biometrics Market Value (US$ Mn) Analysis (2021 – 2031) by Enterprise Size
Table 67: Middle East and Africa Behavioral Biometrics Market Value (US$ Mn) Analysis (2016 – 2020) by Industry
Table 68: Middle East and Africa Behavioral Biometrics Market Value (US$ Mn) Analysis (2021 – 2031) by Industry
Table 69: Middle East and Africa Behavioral Biometrics Market Value (US$ Mn) Analysis (2016 – 2020) by Country
Table 70: Middle East and Africa Behavioral Biometrics Market Value (US$ Mn) Forecast (2021 – 2031) by Country
Find your sweet spots for generating winning opportunities in this market.
Talk to AnalystList of Charts
Figure 01: Global Behavioral Biometrics Market Value (US$ Mn) and Y-o-Y Growth Rate from 2021-2031
Figure 02: Global Behavioral Biometrics Market Absolute $ Opportunity (US$ Mn), 2020– 2031
Figure 03: Global Behavioral Biometrics Market Value (US$ Mn), 2016-2020
Figure 04: Global Behavioral Biometrics Market Value (US$ Mn), 2021-2031
Figure 05: Global Behavioral Biometrics Market Value Share Analysis (2021 – 2031) by Solution
Figure 06: Global Behavioral Biometrics Market Value Y-o-Y Growth Trend Analysis (2019 – 2031) by Solution
Figure 07: Global Behavioral Biometrics Market Attractiveness by Solution
Figure 08: Global Behavioral Biometrics Market Value Share Analysis (2021 – 2031) by Application
Figure 09: Global Behavioral Biometrics Market Value Y-o-Y Growth Trend Analysis (2019 – 2031) by Application
Figure 10: Global Behavioral Biometrics Market Attractiveness by Application
Figure 11: Global Behavioral Biometrics Market Value Share Analysis (2021 – 2031) by Enterprise Size
Figure 12: Global Behavioral Biometrics Market Value Y-o-Y Growth Trend Analysis (2019 – 2031) by Enterprise Size
Figure 13: Global Behavioral Biometrics Market Attractiveness by Enterprise Size
Figure 14: Global Behavioral Biometrics Market Value Share Analysis (2021 – 2031) by Industry
Figure 15: Global Behavioral Biometrics Market Value Y-o-Y Growth Trend Analysis (2019 – 2031) by Industry
Figure 16: Global Behavioral Biometrics Market Attractiveness by Industry
Figure 17: Global Behavioral Biometrics Market Value Share Analysis (2021 – 2031) by Region
Figure 18: Global Behavioral Biometrics Market Value Y-o-Y Growth Trend Analysis (2019 – 2031) by Region
Figure 19: Global Behavioral Biometrics Market Attractiveness by Region
Figure 20: North America Behavioral Biometrics Market Absolute $ Opportunity (US$ Mn), 2016 – 2031
Figure 21: Latin America Behavioral Biometrics Market Absolute $ Opportunity (US$ Mn), 2016 – 2031
Figure 22: Europe Behavioral Biometrics Market Absolute $ Opportunity (US$ Mn), 2016 – 2031
Figure 23: East Asia Behavioral Biometrics Market Absolute $ Opportunity (US$ Mn), 2016 – 2031
Figure 24: South Asia & Pacific Behavioral Biometrics Market Absolute $ Opportunity (US$ Mn), 2016 – 2031
Figure 25: Middle East and Africa Behavioral Biometrics Market Absolute $ Opportunity (US$ Mn), 2016 – 2031
Figure 26: North America Behavioral Biometrics Market Value (US$ Mn), 2016-2020
Figure 27: North America Behavioral Biometrics Market Value (US$ Mn), 2021-2031
Figure 28: North America Behavioral Biometrics Market Value Share Analysis (2021 – 2031) by Solution
Figure 29: North America Behavioral Biometrics Market Value Y-o-Y Growth Trend Analysis (2019 – 2031) by Solution
Figure 30: North America Behavioral Biometrics Market Attractiveness by Solution
Figure 31: North America Behavioral Biometrics Market Value Share Analysis (2021 – 2031) by Application
Figure 32: North America Behavioral Biometrics Market Value Y-o-Y Growth Trend Analysis (2019 – 2031) by Application
Figure 33: North America Behavioral Biometrics Market Attractiveness by Application
Figure 34: North America Behavioral Biometrics Market Value Share Analysis (2021 – 2031) by Enterprise Size
Figure 35: North America Behavioral Biometrics Market Value Y-o-Y Growth Trend Analysis (2019 – 2031) by Enterprise Size
Figure 36: North America Behavioral Biometrics Market Attractiveness by Enterprise Size
Figure 37: North America Behavioral Biometrics Market Value Share Analysis (2021 – 2031) by Industry
Figure 38: North America Behavioral Biometrics Market Value Y-o-Y Growth Trend Analysis (2019 – 2031) by Industry
Figure 39: North America Behavioral Biometrics Market Attractiveness by Industry
Figure 40: North America Behavioral Biometrics Market Value Share Analysis (2021 – 2031) by Country
Figure 41: North America Behavioral Biometrics Market Value Y-o-Y Growth Trend Analysis (2019 – 2031) by Country
Figure 42: North America Behavioral Biometrics Market Attractiveness by Country
Figure 43: U.S. Behavioral Biometrics Market Absolute $ Opportunity (US$ Mn), 2016 – 2031
Figure 44: Canada Behavioral Biometrics Market Absolute $ Opportunity (US$ Mn), 2016 – 2031
Figure 45: Latin America Behavioral Biometrics Market Value (US$ Mn), 2016-2020
Figure 46: Latin America Behavioral Biometrics Market Value (US$ Mn), 2021-2031
Figure 47: Latin America Behavioral Biometrics Market Value Share Analysis (2021 – 2031) by Solution
Figure 48: Latin America Behavioral Biometrics Market Value Y-o-Y Growth Trend Analysis (2019 – 2031) by Solution
Figure 49: Latin America Behavioral Biometrics Market Attractiveness by Solution
Figure 50: Latin America Behavioral Biometrics Market Value Share Analysis (2021 – 2031) by Application
Figure 51: Latin America Behavioral Biometrics Market Value Y-o-Y Growth Trend Analysis (2019 – 2031) by Application
Figure 52: Latin America Behavioral Biometrics Market Attractiveness by Application
Figure 53: Latin America Behavioral Biometrics Market Value Share Analysis (2021 – 2031) by Enterprise Size
Figure 54: Latin America Behavioral Biometrics Market Value Y-o-Y Growth Trend Analysis (2019 – 2031) by Enterprise Size
Figure 55: Latin America Behavioral Biometrics Market Attractiveness by Enterprise Size
Figure 56: Latin America Behavioral Biometrics Market Value Share Analysis (2021 – 2031) by Industry
Figure 57: Latin America Behavioral Biometrics Market Value Y-o-Y Growth Trend Analysis (2019 – 2031) by Industry
Figure 58: Latin America Behavioral Biometrics Market Attractiveness by Industry
Figure 59: Latin America Behavioral Biometrics Market Value Share Analysis (2021 – 2031) by Country
Figure 60: Latin America Behavioral Biometrics Market Value Y-o-Y Growth Trend Analysis (2019 – 2031) by Country
Figure 61: Latin America Behavioral Biometrics Market Attractiveness by Country
Figure 62: Brazil Behavioral Biometrics Market Absolute $ Opportunity (US$ Mn), 2016 – 2031
Figure 63: Mexico Behavioral Biometrics Market Absolute $ Opportunity (US$ Mn), 2016 – 2031
Figure 64: Rest of Latin America Behavioral Biometrics Market Absolute $ Opportunity (US$ Mn), 2016 – 2031
Figure 65: Europe Behavioral Biometrics Market Value (US$ Mn), 2016-2020
Figure 66: Europe Behavioral Biometrics Market Value (US$ Mn), 2021-2031
Figure 67: Europe Behavioral Biometrics Market Value Share Analysis (2021 – 2031) by Solution
Figure 68: Europe Behavioral Biometrics Market Value Y-o-Y Growth Trend Analysis (2019 – 2031) by Solution
Figure 69: Europe Behavioral Biometrics Market Attractiveness by Solution
Figure 70: Europe Behavioral Biometrics Market Value Share Analysis (2021 – 2031) by Application
Figure 71: Europe Behavioral Biometrics Market Value Y-o-Y Growth Trend Analysis (2019 – 2031) by Application
Figure 72: Europe Behavioral Biometrics Market Attractiveness by Application
Figure 73: Europe Behavioral Biometrics Market Value Share Analysis (2021 – 2031) by Enterprise Size
Figure 74: Europe Behavioral Biometrics Market Value Y-o-Y Growth Trend Analysis (2019 – 2031) by Enterprise Size
Figure 75: Europe Behavioral Biometrics Market Attractiveness by Enterprise Size
Figure 76: Europe Behavioral Biometrics Market Value Share Analysis (2021 – 2031) by Industry
Figure 77: Europe Behavioral Biometrics Market Value Y-o-Y Growth Trend Analysis (2019 – 2031) by Industry
Figure 78: Europe Behavioral Biometrics Market Attractiveness by Industry
Figure 79: Europe Behavioral Biometrics Market Value Share Analysis (2021 – 2031) by Country
Figure 80: Europe Behavioral Biometrics Market Value Y-o-Y Growth Trend Analysis (2019 – 2031) by Country
Figure 81: Europe Behavioral Biometrics Market Attractiveness by Country
Figure 82: Germany Behavioral Biometrics Market Absolute $ Opportunity (US$ Mn), 2016 – 2031
Figure 83: Italy Behavioral Biometrics Market Absolute $ Opportunity (US$ Mn), 2016 – 2031
Figure 84: U.K. Behavioral Biometrics Market Absolute $ Opportunity (US$ Mn), 2016 – 2031
Figure 85: France Behavioral Biometrics Market Absolute $ Opportunity (US$ Mn), 2016 – 2031
Figure 86: Spain Behavioral Biometrics Market Absolute $ Opportunity (US$ Mn), 2016 – 2031
Figure 87: BENELUX Behavioral Biometrics Market Absolute $ Opportunity (US$ Mn), 2016 – 2031
Figure 88: Russia Behavioral Biometrics Market Absolute $ Opportunity (US$ Mn), 2016 – 2031
Figure 89: Rest of Europe Behavioral Biometrics Market Absolute $ Opportunity (US$ Mn), 2016 – 2031
Figure 90: South Asia & Pacific Behavioral Biometrics Market Value (US$ Mn), 2016-2020
Figure 91: South Asia & Pacific Behavioral Biometrics Market Value (US$ Mn), 2021-2031
Figure 92: South Asia & Pacific Behavioral Biometrics Market Value Share Analysis (2021 – 2031) by Solution
Figure 93: South Asia & Pacific Behavioral Biometrics Market Value Y-o-Y Growth Trend Analysis (2019 – 2031) by Solution
Figure 94: South Asia & Pacific Behavioral Biometrics Market Attractiveness by Solution
Figure 95: South Asia & Pacific Behavioral Biometrics Market Value Share Analysis (2021 – 2031) by Application
Figure 96: South Asia & Pacific Behavioral Biometrics Market Value Y-o-Y Growth Trend Analysis (2019 – 2031) by Application
Figure 97: South Asia & Pacific Behavioral Biometrics Market Attractiveness by Application
Figure 98: South Asia & Pacific Behavioral Biometrics Market Value Share Analysis (2021 – 2031) by Enterprise Size
Figure 99: South Asia & Pacific Behavioral Biometrics Market Value Y-o-Y Growth Trend Analysis (2019 – 2031) by Enterprise Size
Figure 100: South Asia & Pacific Behavioral Biometrics Market Attractiveness by Enterprise Size
Figure 101: South Asia & Pacific Behavioral Biometrics Market Value Share Analysis (2021 – 2031) by Industry
Figure 102: South Asia & Pacific Behavioral Biometrics Market Value Y-o-Y Growth Trend Analysis (2019 – 2031) by Industry
Figure 103: South Asia & Pacific Behavioral Biometrics Market Attractiveness by Industry
Figure 104: South Asia & Pacific Behavioral Biometrics Market Value Share Analysis (2021 – 2031) by Country
Figure 105: South Asia & Pacific Behavioral Biometrics Market Value Y-o-Y Growth Trend Analysis (2019 – 2031) by Country
Figure 106: South Asia & Pacific Behavioral Biometrics Market Attractiveness by Country
Figure 107: India Behavioral Biometrics Market Absolute $ Opportunity (US$ Mn), 2016 – 2031
Figure 108: Thailand Behavioral Biometrics Market Absolute $ Opportunity (US$ Mn), 2016 – 2031
Figure 109: Indonesia Behavioral Biometrics Market Absolute $ Opportunity (US$ Mn), 2016 – 2031
Figure 110: Malaysia Behavioral Biometrics Market Absolute $ Opportunity (US$ Mn), 2016 – 2031
Figure 111: Australia & New Zealand Behavioral Biometrics Market Absolute $ Opportunity (US$ Mn), 2016 – 2031
Figure 112: Rest of South Asia & Pacific Behavioral Biometrics Market Absolute $ Opportunity (US$ Mn), 2016 – 2031
Figure 113: East Asia Behavioral Biometrics Market Value (US$ Mn), 2016-2020
Figure 114: East Asia Behavioral Biometrics Market Value (US$ Mn), 2021-2031
Figure 115: East Asia Behavioral Biometrics Market Value Share Analysis (2021 – 2031) by Solution
Figure 116: East Asia Behavioral Biometrics Market Value Y-o-Y Growth Trend Analysis (2019 – 2031) by Solution
Figure 117: East Asia Behavioral Biometrics Market Attractiveness by Solution
Figure 118: East Asia Behavioral Biometrics Market Value Share Analysis (2021 – 2031) by Application
Figure 119: East Asia Behavioral Biometrics Market Value Y-o-Y Growth Trend Analysis (2019 – 2031) by Application
Figure 120: East Asia Behavioral Biometrics Market Attractiveness by Application
Figure 121: East Asia Behavioral Biometrics Market Value Share Analysis (2021 – 2031) by Enterprise Size
Figure 122: East Asia Behavioral Biometrics Market Value Y-o-Y Growth Trend Analysis (2019 – 2031) by Enterprise Size
Figure 123: East Asia Behavioral Biometrics Market Attractiveness by Enterprise Size
Figure 124: East Asia Behavioral Biometrics Market Value Share Analysis (2021 – 2031) by Industry
Figure 125: East Asia Behavioral Biometrics Market Value Y-o-Y Growth Trend Analysis (2019 – 2031) by Industry
Figure 126: East Asia Behavioral Biometrics Market Attractiveness by Industry
Figure 127: East Asia Behavioral Biometrics Market Value Share Analysis (2021 – 2031) by Country
Figure 128: East Asia Behavioral Biometrics Market Value Y-o-Y Growth Trend Analysis (2019 – 2031) by Country
Figure 129: East Asia Behavioral Biometrics Market Attractiveness by Country
Figure 130: China Behavioral Biometrics Market Absolute $ Opportunity (US$ Mn), 2016 – 2031
Figure 131: Japan Behavioral Biometrics Market Absolute $ Opportunity (US$ Mn), 2016 – 2031
Figure 132: South Korea Behavioral Biometrics Market Absolute $ Opportunity (US$ Mn), 2016 – 2031
Figure 133: Middle East and Africa Behavioral Biometrics Market Value (US$ Mn), 2016-2020
Figure 134: Middle East and Africa Behavioral Biometrics Market Value (US$ Mn), 2021-2031
Figure 135: Middle East and Africa Behavioral Biometrics Market Value Share Analysis (2021 – 2031) by Solution
Figure 136: Middle East and Africa Behavioral Biometrics Market Value Y-o-Y Growth Trend Analysis (2019 – 2031) by Solution
Figure 137: Middle East and Africa Behavioral Biometrics Market Attractiveness by Solution
Figure 138: Middle East and Africa Behavioral Biometrics Market Value Share Analysis (2021 – 2031) by Application
Figure 139: Middle East and Africa Behavioral Biometrics Market Value Y-o-Y Growth Trend Analysis (2019 – 2031) by Application
Figure 140: Middle East and Africa Behavioral Biometrics Market Attractiveness by Application
Figure 141: Middle East and Africa Behavioral Biometrics Market Value Share Analysis (2021 – 2031) by Enterprise Size
Figure 142: Middle East and Africa Behavioral Biometrics Market Value Y-o-Y Growth Trend Analysis (2019 – 2031) by Enterprise Size
Figure 143: Middle East and Africa Behavioral Biometrics Market Attractiveness by Enterprise Size
Figure 144: Middle East and Africa Behavioral Biometrics Market Value Share Analysis (2021 – 2031) by Industry
Figure 145: Middle East and Africa Behavioral Biometrics Market Value Y-o-Y Growth Trend Analysis (2019 – 2031) by Industry
Figure 146: Middle East and Africa Behavioral Biometrics Market Attractiveness by Industry
Figure 147: Middle East and Africa Behavioral Biometrics Market Value Share Analysis (2021 – 2031) by Country
Figure 148: Middle East and Africa Behavioral Biometrics Market Value Y-o-Y Growth Trend Analysis (2019 – 2031) by Country
Figure 149: Middle East and Africa Behavioral Biometrics Market Attractiveness by Country
Figure 150: GCC Countries Behavioral Biometrics Market Absolute $ Opportunity (US$ Mn), 2016 – 2031
Figure 151: Turkey Behavioral Biometrics Market Absolute $ Opportunity (US$ Mn), 2016 – 2031
Figure 152: Northern Africa Behavioral Biometrics Market Absolute $ Opportunity (US$ Mn), 2016 – 2031
Figure 153: South Africa Behavioral Biometrics Market Absolute $ Opportunity (US$ Mn), 2016 – 2031
Figure 154: Rest of Middle East and Africa Behavioral Biometrics Market Absolute $ Opportunity (US$ Mn), 2016 – 2031
Need specific information?
Request CustomizationExplore Technology Insights
View Reports