
- Market Size (2026)
- USD 2.0 Bn
- Forecast (2036)
- USD 3.2 Bn
- CAGR (2026 to 2036)
- 4.8%
How big is Buckwheat Market in 2026?
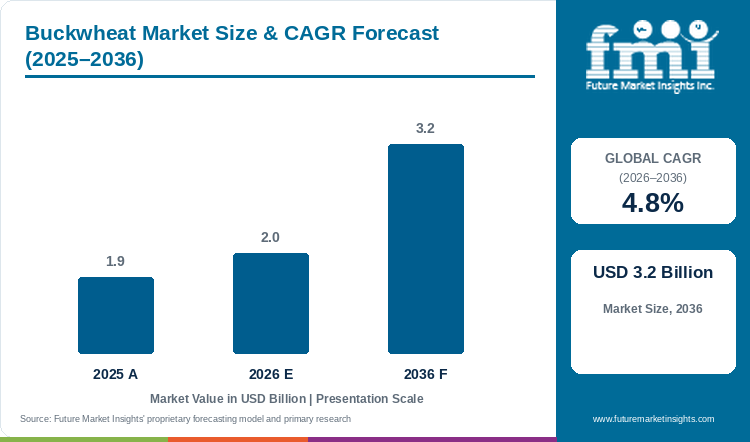
With a valuation of USD 1.9 billion in 2025 and moving to USD 2.0 billion in 2026, the buckwheat market is positioned to attain USD 3.2 billion by 2036, exhibiting a CAGR of 4.8%.
Consumer awareness regarding low-glycemic, gluten-free diets and antioxidant-rich herbal teas is driving steady expansion across the global buckwheat market. FMI estimates place the global buckwheat market size at USD 1.9 billion in 2025 and USD 2.0 billion in 2026. Ten-year demand is forecast to lift total industry valuation to USD 3.2 billion by 2036 at a 4.8% annual rate through 2036. Hulled Buckwheat Groats and Kasha represent 46.8% of 2026 product form value since steam-conditioned whole kernels stay fresh in storage silos much longer than ground flour. Food and beverage brands are looking beyond traditional common buckwheat toward Tartary buckwheat because of its exceptionally high levels of rutin, a natural flavonoid that supports blood-vessel health. A September 2026 study in Foods reported that untreated Tartary buckwheat contains 5,004.33 ug per gram of rutin versus 65.35 ug per gram in common buckwheat while dry-heat air frying at 180 degrees Celsius keeps 95.7% to 105.9% of that rutin intact and cuts light-sensitive fagopyrin F to 13.30 ug per gram. This verified flavonoid retention gives buckwheat a strong health advantage over pseudocereal amaranth flours. However, flower loss during hot summer weather and the cost of optical sorting to remove stray wheat kernels in shared grain mills restrain faster supply growth through 2036.
Key Market Trends & Insights
- By product form: Hulled Buckwheat Groats and Kasha hold an estimated 46.8% share in 2026 because raw white groats and toasted brown kasha supply both retail grocery packs and secondary flour mills.
- By species: Common Buckwheat Fagopyrum esculentum represents 78.4% in 2026 since its mild, non-bitter taste fits mainstream soba noodles and savory galettes.
- By cultivation: Conventional farming secures 71.2% in 2026 owing to short-season rotational cover-crop harvesting across Poland and Canada as well as the United States and East Asia.
- By end use: Soba Noodles, Pasta, and Bakery Products account for 51.4% in 2026 as soba mills in Japan and Western gluten-free pasta factories expand production.
- By distribution & scale: B2B Food Processors and Noodle Mills command 54.8% by channel while Multinational CPG and Beverage Groups account for 54.1% by customer scale in 2026.
Regional Highlights
- Top national expansion: The United States leads national growth projections at a 5.3% CAGR through 2036 under regenerative cover-crop contracting and gluten-free bakery and Tartary tea launches.
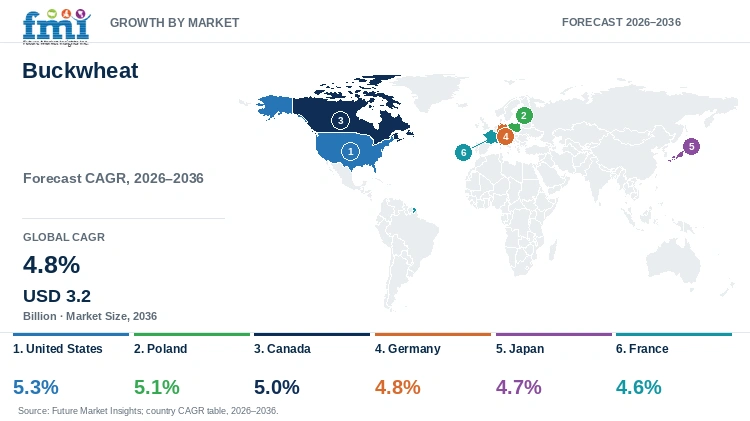
- Broader country progression: Poland tracks at a 5.1% CAGR ahead of Canada at 5.0% and Germany at 4.8%, while Japan records 4.7% and France reaches 4.6%.
Market Size & Forecast
Table 1: Market Size and Forecast for the Buckwheat Market (USD billion and CAGR percentage), 2025 to 2036
| Metric | Value |
|---|---|
| 2025 Market Size | USD 1.9 billion |
| Estimated Market Size in 2026 | USD 2.0 billion |
| Projected Market Size by 2036 | USD 3.2 billion |
| CAGR, 2026 to 2036 | 4.8% |
| Added Market Value, 2026 to 2036 | USD 1.2 billion |
Food manufacturers formulating with Tartary buckwheat face a major taste hurdle compared to standard common buckwheat. When raw Tartary buckwheat flour is mixed with water, a natural enzyme inside the seed quickly turns its rutin into quercetin, creating a strong bitter flavor that shoppers reject in noodles and breads. Per an April 2026 review in Food Chemistry X, Tartary buckwheat contains 0.8% to 1.7% dry-weight rutin compared to 0.01% in common buckwheat while key rutin and quercetin compounds make up 73.05% to 81.79% of total flavonoids. To eliminate bitterness and make high-rutin products palatable, specialty millers steam-treat the grain before milling and blend it with ancient and specialty grain flours.
Milled Grain Volume and Active-Rutin Sizing
Table 2: Milled Grain Volume and Active-Rutin Sizing for the Buckwheat Market (USD billion, million metric tons, and USD per metric ton), 2025 to 2036
| Metric | 2025 | 2026 | 2036 |
|---|---|---|---|
| Market size (USD billion) | 1.9 | 2.0 | 3.2 |
| Commercial dehulled & milled buckwheat volume (million metric tons) | 1.52 to 1.68 | 1.58 to 1.75 | 2.35 to 2.60 |
| Tartary buckwheat tea & functional extract volume (thousand metric tons) | 145.0 to 162.0 | 155.0 to 174.0 | 268.0 to 298.0 |
| Average commercial dehulled & milled grain valuation per metric ton (USD) | 1,130 to 1,250 | 1,140 to 1,265 | 1,230 to 1,360 |
Operational note: Grain-milling tonnage covers commercial dehulled groats and toasted kasha with stone-milled soba and bakery flours as well as roasted Tartary tea granules and hull byproducts.
Consumer focus on blood-sugar management and long-lasting fullness is also boosting buckwheat adoption in breakfast cereals and snack bars. Unlike refined wheat or white rice that digest rapidly and spike blood glucose, buckwheat contains slowly digestible starches and complete plant proteins rich in lysine. As documented in an April 2026 agrifood review on Fagopyrum species, natural interactions between buckwheat starches and polyphenols slow down carbohydrate digestion in gluten-free foods. Cereal makers combine dehulled buckwheat groats with dehulled millet grains and stone-milled millet flours to produce crunchy, low-glycemic breakfast granolas.
Per Capita & Commercial Milling Line Sizing
Table 3: Per Capita and Milling Line Valuation Indicators for the Buckwheat Market (USD and percentage share), 2025 to 2036
| Metric | 2025 | 2026 | 2036 |
|---|---|---|---|
| World population (billion) | 8.2 | 8.3 | 9.0 |
| Market value per 1,000 people (USD) | 231.7 | 241.0 | 355.6 |
| Annual market value per commercial soba, pasta & dehulling line (USD thousand) | 210.0 to 235.0 | 220.0 to 246.0 | 335.0 to 375.0 |
| Rutin-Rich Tartary Buckwheat species share (%) | 20.8% to 22.0% | 21.0% to 22.2% | 24.5% to 26.5% |
Table 4: Industrial Milling and Channel Valuation Indicators for the Buckwheat Market (USD billion and line count), 2026
| Metric | Value | Institutional Reference Basis |
|---|---|---|
| Market size, 2026 | USD 2.0 billion | 2026 global market valuation baseline |
| Commercial buckwheat dehulling, soba & gluten-free pasta lines | 8,600 lines | Global stone-milling, hydrothermal kasha, and soba lines |
| Market value per processing line | USD 232,558.1 | Annualized buckwheat grain and flour procurement valuation |
| B2B Food Processors & Noodle Mills market value, 2026 | USD 1.1 billion | 54.8% distribution channel allocation |
Because buckwheat is a pseudocereal rather than a true wheat grass, it contains zero gluten and cannot trap fermentation gas on its own in yeast-risen breads. A 2026 study in Foods evaluating six common and Tartary buckwheat noodle formulations demonstrated that hydrocolloid and protein network structuring prevents strand breakage during boiling. To help bakeries make soft loaves and firm pasta shapes, ingredient suppliers blend fine buckwheat flour with buckwheat Mediterranean grain blends and extruded gluten-free pasta products.
Analyst Perspective
"Industrial grain buyers no longer view buckwheat as a regional Eastern European kasha or seasonal soba crop in Japan, because it functions as a dual-purpose regenerative cover crop and rutin-rich metabolic ingredient. Millers that pair optical allergen sorting with hydrothermal rutinosidase inactivation will secure multi-year contracts with multinational cereal and functional tea brands through 2036."
- Nandini Roy Choudhury, Principal Consultant, Future Market Insights.
How is the buckwheat market segmented?
The buckwheat market is segmented by product form and species with cultivation, end use, distribution channel and customer scale. In 2026, Hulled Buckwheat Groats and Kasha are projected at 46.8% and Common Buckwheat Fagopyrum esculentum at 78.4%, while Conventional holds 71.2%, Soba Noodles, Pasta, and Bakery Products reach 51.4%, B2B Food Processors and Noodle Mills command 54.8% and Multinational CPG and Beverage Groups account for 54.1%.
By product form: Hulled Buckwheat Groats and Kasha with Milled Buckwheat Soba and Galette Flour as well as Buckwheat Flakes, Bran, and Hulls plus Roasted Tartary Buckwheat Tea Granules.
By species: Common Buckwheat Fagopyrum esculentum and Rutin-Rich Tartary Buckwheat Fagopyrum tataricum.
By cultivation: Conventional and Certified Organic.
By end use: Soba Noodles, Pasta, and Bakery Products with Breakfast Cereals, Porridges, and Snacks as well as Functional Rutin Teas and Nutraceuticals plus Brewing, Distilling, and Hull Pillow Fillings.
By distribution channel: B2B Food Processors and Noodle Mills with Supermarkets and Hypermarkets and Specialty Organic and Health Grocers.
By customer scale: Multinational CPG and Beverage Groups with Regional Co-Packers and Mid-Market Brands and Artisanal and Foodservice Operators.
Why do Hulled Buckwheat Groats and Kasha lead the product form category?
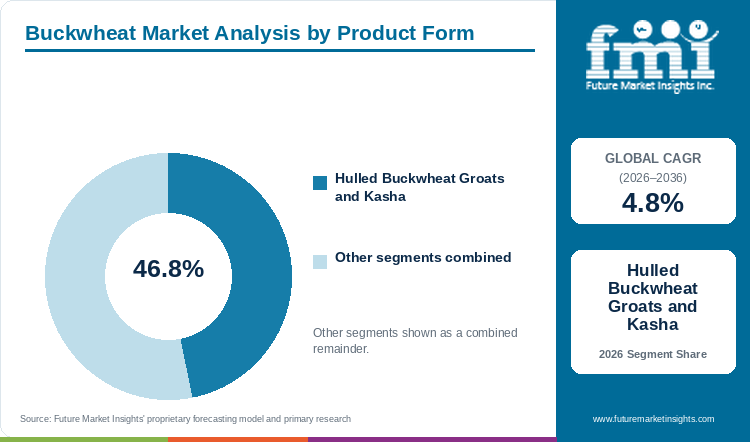
Hulled Buckwheat Groats and Kasha hold an estimated 46.8% of product form demand in 2026, anchored by retail whole-grain kasha consumption and longer lipid shelf life.
Table 5: Product Form Share for the Buckwheat Market (percentage share), 2026
| Product Form | Share (2026) |
|---|---|
| Hulled Buckwheat Groats and Kasha | 46.8% |
| Other Segments Combined | 53.2%* |
| Total | 100.0% |
*Note: Additional product form categories (Milled Buckwheat Soba and Galette Flour with Buckwheat Flakes, Bran, and Hulls and Roasted Tartary Buckwheat Tea Granules) make up the remaining 2026 buckwheat share.
Table 6: Product Form Leadership and Market Growth for the Buckwheat Market (segment share and CAGR percentage), 2026 to 2036
| Metric | Value |
|---|---|
| Global CAGR (2026 to 2036) | 4.8% |
| Leading Segment | Hulled Buckwheat Groats and Kasha (46.8% share in 2026) |
Once buckwheat is ground into flour, its natural unsaturated oils are exposed to air and can turn rancid within a few months unless refrigerated. By contrast, removing the outer black hull while keeping the inner triangular groat intact protects those oils and gives raw white groats and toasted kasha a long ambient shelf life. Manufacturers of whole-grain breakfast cereals and retail side-dish pouches buy whole dehulled groats in bulk and mill or flake them right before packaging.
- Hulled Buckwheat Groats and Kasha hold 46.8% of product form value in 2026 because whole dehulled kernels serve both retail grocers in Eastern Europe and North America and downstream flaking mills.
- According to a June 2025 study in Food Science and Biotechnology, controlled heat treatment of Tartary buckwheat at 200 degrees Celsius for 40 minutes measurably increases quercetin and phenolic bioactivity while improving insulin sensitivity.
What sustains Common Buckwheat Fagopyrum esculentum leadership in species?
Common Buckwheat Fagopyrum esculentum represents 78.4% of the species category in 2026, supported by larger seed size, easier mechanical dehulling, and mild nutty taste.
Grain millers and noodle factories favor common buckwheat because its larger, winged seeds crack open cleanly on mechanical dehulling tables without crushing the starchy kernel inside. Common buckwheat also has a mild, sweet flavor that appeals to mainstream family shoppers in pancakes and soba noodles, whereas bitter Tartary buckwheat is mainly roasted for caffeine-free herbal tea infusions and health supplements.
- Common Buckwheat Fagopyrum esculentum accounts for 78.4% of species demand in 2026 as commercial soba noodle and pancake mix manufacturers prioritize sweet aroma and pale flour color.
- Per a June 2025 Breeding Science study in Japan, pollinating leading Hokkaido common buckwheat cultivars (0.15 to 0.21 mg per gram rutin) with bred HR8 pollen (0.60 mg per gram rutin) measurably boosts seed antioxidant content.
How does Conventional cultivation lead the farming segment?
Conventional cultivation accounts for 71.2% of supply in 2026, driven by short 70-to-90-day summer double-cropping across temperate grain belts.
Buckwheat matures in just 10 to 12 weeks and thrives in poor soils, making it a favorite summer catch crop for conventional grain farmers in Poland and Canada as well as the United States. Growers plant conventional buckwheat after harvesting winter wheat to suppress weeds and release soil phosphorus for the next crop season. This large rotational acreage gives B2B ingredient millers supplying cereal and grain fortification ingredients a steady, affordable supply of grain.
- Conventional cultivation secures 71.2% of supply in 2026 because broadacre rotational farmers integrate buckwheat between winter wheat and spring oilseed harvests.
- An April 2025 review in Plant Science detailed the molecular heat-shock and drought-response mechanisms that govern buckwheat seed set under variable field climates.
Why do Soba Noodles, Pasta, and Bakery Products lead end-use demand?
Soba Noodles, Pasta, and Bakery Products secure 51.4% of end-use value in 2026, anchored by soba consumption in Japan and Western gluten-free bakery lines.
Year-round consumption of fresh and dried soba noodles in Japan and expanding supermarket aisles for gluten-free pasta and breads in Europe and North America generate over half of global buckwheat usage. Commercial noodle mills carefully separate the white inner starch flour from the darker, protein-rich outer seed layers to give soba noodles a smooth bite that does not break apart in boiling water.
- Soba Noodles, Pasta, and Bakery Products represent 51.4% of end-use demand in 2026 as mainstream supermarkets expand dedicated gluten-free pasta and artisanal flatbread aisles.
- Per a May 2026 review in the International Journal of Food Science, combining pseudocereal flours with hydrocolloids and enzymes improves crumb elasticity and loaf volume in gluten-free breads.
What gives B2B Food Processors and Multinational CPG Groups the leading channel and scale share?
B2B Food Processors and Noodle Mills command 54.8% of channel share while Multinational CPG and Beverage Groups hold 54.1% of customer scale in 2026.
Because buckwheat grows in fields that previously held wheat or barley, raw harvested lots almost always contain stray gluten-containing kernels. Large food manufacturers and multinational cereal brands buy directly from industrial B2B grain processors equipped with optical color sorters that remove every stray wheat kernel to guarantee gluten-free safety, often bundling buckwheat with organic amaranth grain supply.
- B2B Food Processors and Noodle Mills command 54.8% of distribution channel value in 2026 because industrial buyers require optical color-sorting below 10 ppm gluten cross-contact.
- Multinational CPG and Beverage Groups hold 54.1% of customer scale in 2026, supported by large-scale grain processing infrastructure in East Asia and North America documented in the July 2026 USDA Beijing grain update CH2026-0085.
What are the drivers, restraints, and opportunities in the buckwheat market?
In the buckwheat market, low-glycemic gluten-free diet adoption and regenerative soil cover-cropping drive demand whereas heat-sensitive flower abortion and wheat cross-contact restrain milling supply and air-fried high-rutin Tartary buckwheat supports functional beverage growth.
- Driver: Celiac diagnosis rates and metabolic low-glycemic diets with corporate regenerative agriculture pledges expand demand for dehulled buckwheat groats and stone-milled flours.
- Restraint: High flower abortion above 30 degrees Celsius and insect-dependent cross-pollination with volunteer wheat contamination in shared grain elevators tighten certified gluten-free supply.
- Opportunity: Rutin-rich Tartary buckwheat tea roasting and air-fried low-fagopyrin functional snacks with xenia-bred high-rutin common buckwheat cultivars open high-margin nutraceutical tiers.
Growth Analysis and Future Potential: Qualitative Demand Catalysts
Consumer shift toward whole-grain, gluten-free foods that support blood-sugar control and lasting satiety is the primary force driving global buckwheat demand. A May 2025 randomized crossover clinical trial in Food Science & Nutrition across 20 healthy adults confirmed that replacing conventional wheat bread with buckwheat-enriched bread measurably lowered postprandial blood glucose and reduced appetite scores. At the same time, roasted Tartary buckwheat tea (soba-cha) is gaining popularity across Asia and North America as a nutty, caffeine-free herbal drink. Kerry Group preliminary 2025 results released in February 2026 highlighted a 3.5% gain in nutrition and food volume supported by health-focused grain and beverage reformulation.
Risk Assessment of the Buckwheat Market: Operational and Formulation Friction
Weather-sensitive crop yields and gluten cross-contamination in shared grain elevators represent the biggest challenges restraining the buckwheat market. A May 2026 multi-season field trial published in PLOS ONE demonstrated that sowing date and soil type accounted for 18% to 32% of buckwheat yield variance at p < 0.001, with common buckwheat suffering sharp yield drops under late-season heat and dry sandy soils compared to Tartary buckwheat. After harvest, three-angled buckwheat seeds easily trap stray wheat and barley kernels from previous crops, forcing millers to run expensive optical sorting passes to meet the 20 ppm gluten-free limit.
Commercial Opportunity Analysis: Formulation Differentiation and Value-Add Formats
Specialty grain breeders and millers are earning higher profit margins by developing high-yielding Tartary buckwheat varieties and extruded gluten-free noodle flours. In August 2026, an international consortium published a 16-accession Tartary buckwheat pangenome in Cell identifying 123,131 structural variations and the FtRNH and FtPLATZ3 genes that boost seed size and high-altitude harvest yields. On the processing side, a 2026 study in Foods showed that microwave-extruded and hydrothermally pre-treated Tartary buckwheat flour forms cohesive gluten-free noodle doughs with superior cooking stability. Millers offering certified gluten-free flours with guaranteed rutin levels are capturing premium supply contracts through 2036.
Buckwheat Market by Country (2026 to 2036)
FMI country modeling indicates that the United States leads buckwheat market expansion at a 5.3% CAGR from 2026 to 2036, followed by Poland at 5.1% and Canada at 5.0%. Germany advances at 4.8%, whereas Japan records 4.7% and France progresses at 4.6%.
Table 7: Country CAGR and Primary Growth Levers for the Buckwheat Market (CAGR percentage), 2026 to 2036
| Country | CAGR (2026 to 2036) | Primary Growth Lever |
|---|---|---|
| United States | 5.3% | Regenerative cover-crop contracting and Tartary buckwheat superfood and bakery launches |
| Poland | 5.1% | European Union leading kasha roasting and certified organic groat export milling |
| Canada | 5.0% | Manitoba and Ontario identity-preserved soba groat exports and gluten-free flaking |
| Germany | 4.8% | Bio-supermarket Reformhaus ancient-grain bakery mixes and organic muesli manufacturing |
| Japan | 4.7% | Premium domestic stone-milled juwari soba and RTD roasted Tartary soba-cha beverages |
| France | 4.6% | Protected Geographical Indication Blé Noir de Bretagne galette flour and organic creperies |
Source: Future Market Insights analysis
United States Buckwheat Market Outlook (2026 to 2036)
The United States leads national buckwheat expansion at a 5.3% CAGR through 2036 because corporate regenerative farming programs in the Midwest and consumer demand for Tartary buckwheat superfoods are growing together. Specialty mills in New York and Oregon with North Dakota process identity-preserved common and Tartary buckwheat into gluten-free pancake mixes and roasted herbal teas. In March 2025, ADM noted in its 2025 Protein Report that U.S. shoppers and food brands are actively seeking ancient grains and high-fiber plant proteins for everyday staples. Functional snack makers across the United States are also launching air-fried, high-rutin buckwheat granolas and crackers for natural grocery chains nationwide.
Key takeaway: In the United States, regenerative cover-crop grain contracting and high-rutin Tartary buckwheat snack and tea launches drive a leading 5.3% CAGR.
Poland Buckwheat Market Outlook (2026 to 2036)
Poland is projected to expand at a 5.1% CAGR between 2026 and 2036, anchored by its position as the European Union's largest buckwheat grower and steam-toasted kasha exporter. Unlike Western European countries that mostly import milled flour, grain mills in Poland process domestic harvests into roasted gryczana kasha and puffed gluten-free cakes for supermarket chains across Europe. Per the March 2026 USDA Warsaw grain report PL2026-0012, domestic mills and agricultural exporters across Lubelskie and Warmia-Masuria are upgrading cleaning and storage infrastructure to serve high-value European Union food and retail markets. Plant scientists in Poland also lead breeding research for stress-tolerant buckwheat varieties across Central Europe.
Key takeaway: In Poland, large-scale hydrothermal kasha processing and certified organic gluten-free groat exports across the EU sustain a 5.1% CAGR.
Canada Buckwheat Market Outlook (2026 to 2036)
Canada achieves a 5.0% CAGR from 2026 to 2036 by operating as a high-purity export supplier of large-seeded soba groats to Japan and allergen-free buckwheat flakes to cereal plants across North America. Farmers in Manitoba and Ontario with Quebec grow identity-preserved buckwheat varieties under cool northern summers that favor plump kernel filling. In June 2025, plant-based ingredient supplier Roquette expanded its North American and European gluten-free bakery and textured protein solutions to support clean-label grain blends and artisan breads. Grain-cleaning plants across Canada deploy multi-pass optical color sorters and gravity tables to guarantee below-10-ppm gluten purity for cross-border bakery and cereal customers across North America.
Key takeaway: In Canada, identity-preserved soba groat exports to Japan and allergen-free breakfast-cereal flaking support a 5.0% annual growth rate.
Germany Buckwheat Market Outlook (2026 to 2036)
Demand in Germany grows at a 4.8% CAGR over the 2026 to 2036 window, propelled by Europe's largest network of organic bio-supermarkets and industrial gluten-free bread bakeries. Shoppers in Germany regularly buy sprouted buckwheat flakes and Buchweizen bread mixes in both Reformhaus health shops and mainstream national grocery chains. Storefront surveys within USDA GAIN report GM2026-0003 published during January 2026 confirmed that national organic food demand reached a new record across over 2,200 organic retail stores and supermarket chains. Bakery-improver formulators across Germany blend fine buckwheat flour with natural hydrocolloids to bake sliced gluten-free sandwich loaves and rolls for continental supermarkets across Central Europe.
Key takeaway: In Germany, organic bio-supermarket muesli manufacturing and enzymatic gluten-free bread formulation underpin a 4.8% CAGR through 2036.
Japan Buckwheat Market Outlook (2026 to 2036)
Japan records a 4.7% CAGR through 2036 and remains the world's premier market for high-grade stone-milled soba flour and ready-to-drink roasted Tartary buckwheat tea. Because freshness and aroma command high price premiums in soba restaurants across Japan, domestic mills blend prized Hokkaido harvests with contract-grown groats from North America. Exhibition figures from USDA GAIN report JA2026-0017 released in October 2026 showed over 72,000 retail and foodservice buyers prioritizing authentic regional noodles and functional RTD teas across 3,000 trade pavilions at the Tokyo FOODEX showcase. Beverage bottlers across Tokyo and Osaka are expanding caffeine-free Tartary soba-cha tea across national convenience stores and vending networks throughout Japan.
Key takeaway: In Japan, stone-milled artisanal soba flour and RTD roasted Tartary buckwheat tea bottling sustain a 4.7% CAGR through 2036.
France Buckwheat Market Outlook (2026 to 2036)
France advances at a 4.6% annual rate between 2026 and 2036, propelled by traditional Breton galette creperies and rising supermarket demand for organic gluten-free biscuits. Stone mills in Brittany operate under Protected Geographical Indication (IGP) Farine de Blé Noir de Bretagne standards, grinding locally grown dark-hulled buckwheat for chilled supermarket galettes and restaurants. Food-industry data from the April 2025 USDA Paris ingredient report FR2025-0004 reveal that 19,000 culinary manufacturing companies across the republic are increasing domestic sourcing of traceable specialty grains for retail and foodservice channels. Organic farming cooperatives across Brittany and central France are signing multi-year grower contracts to expand regional mill supply.
Key takeaway: In France, IGP Brittany galette stone-milling and organic gluten-free biscuit manufacturing support a 4.6% annual growth rate.
Full report country CAGRs cover North America and Latin America with Western and Eastern Europe. Forecast tables also detail East Asia and South Asia and Pacific with the Middle East and Africa.
Who are the notable companies in the buckwheat market?
Bob's Red Mill Natural Foods, Inc. and Birkett Mills with Minn-Dak Growers Ltd., Archer Daniels Midland Company, Cargill, Incorporated and Kawanishi Milling Co., Ltd. are the notable companies in the buckwheat market.
Competitive positioning in the buckwheat industry separates dedicated buckwheat stone-millers and groat processors in North America and Japan from global regenerative agricultural grain originators.
- Dedicated Buckwheat Stone-Millers and Kasha Processors: Bob's Red Mill Natural Foods, Inc. with Birkett Mills and Kawanishi Milling Co., Ltd. operate specialized dehulling and stone-milling facilities with hydrothermal kasha lines under strict gluten-free and soba-grade controls.
- Identity-Preserved Specialty Grain Cleaners and Ingredient Millers: Minn-Dak Growers Ltd. contracts directly with Northern Plains growers to clean and mill certified gluten-free buckwheat groats and flours for industrial B2B food processors.
- Global Agricultural Grain Originators and Regenerative Supply Leaders: Archer Daniels Midland Company and Cargill, Incorporated manage multi-continent grain origination and regenerative cover-crop farmer programs with bulk ancient-grain ingredient supply for multinational CPGs.
Competitive Benchmarking: Buckwheat Market
Table 8: Competitive Benchmarking for the Buckwheat Market (qualitative capability ratings and geographic reach)
| Company | Precision Dehulling & Stone-Milling | Gluten-Free (<20 ppm) Optical Sorting | Regenerative & Identity-Preserved Sourcing | Geographic Reach |
|---|---|---|---|---|
| Bob's Red Mill Natural Foods, Inc. | High | High | High | United States and global retail and foodservice gluten-free stone-milled flours and groats |
| Birkett Mills | High | High | High | United States dedicated buckwheat miller producing Wolff's kasha, groats, and dark/light flours |
| Minn-Dak Growers Ltd. | High | High | High | United States and international B2B identity-preserved buckwheat groats, flour, and hull supply |
| Archer Daniels Midland Company | High | High | High | Global ancient-grain origination, regenerative cover-crop programs, and CPG milling network |
| Cargill, Incorporated | Medium | High | High | Global agricultural supply chain and rotational cover-crop origination for food manufacturers |
| Kawanishi Milling Co., Ltd. | High | High | High | Japan Hokkaido stone-milled juwari soba flour and hydrothermal buckwheat processing |
Scoring basis: Precision Dehulling & Stone-Milling evaluates mechanical impact hulling yields and low-temperature quartz stone grinding that preserve rutin and starch integrity, whereas Gluten-Free (<20 ppm) Optical Sorting rates dedicated allergen-free cleaning lines. Regenerative & Identity-Preserved Sourcing measures direct grower contracting and cultivar traceability.
Key Developments in the Buckwheat Market
- Food scientists reported in Foods in September 2026 that air frying Tartary buckwheat at 180 degrees Celsius retains 95.7% to 105.9% of bioactive rutin while reducing phototoxic fagopyrin F from 29.00 ug per gram to 13.30 ug per gram.
- Plant breeders at NARO and Kyoto University in Japan demonstrated in Breeding Science in June 2025 that pollinating common buckwheat with the high-rutin HR8 line (0.60 mg per gram) measurably raises seed rutin via xenia across 14 genetic loci.
- Archer Daniels Midland Company published its 2025 Protein Report in March 2025, detailing commercial CPG expansion into nutrient-dense ancient grains and fiber-fortified bakery matrices under regenerative sourcing.
- Flavonoid researchers published a comprehensive review in Food Chemistry X in April 2026 mapping hydrothermal steaming and microwave processing parameters that prevent rutinosidase bitterness in Tartary buckwheat products.
Key Players in the Buckwheat Market
Dedicated Buckwheat Stone-Millers and Kasha Processors
- Bob's Red Mill Natural Foods, Inc.
- Birkett Mills
- Kawanishi Milling Co., Ltd.
Identity-Preserved Specialty Grain Cleaners and Ingredient Millers
- Minn-Dak Growers Ltd.
Global Agricultural Grain Originators and Regenerative Supply Leaders
- Archer Daniels Midland Company
- Cargill, Incorporated
Buckwheat Market - Report Scope
Table 9: Report Scope for the Buckwheat Market (coverage fields and definitions), 2026 to 2036
| Coverage field | Report scope |
|---|---|
| Market breakdown | Product Form and Species with Cultivation, End Use, Distribution Channel and Customer Scale |
| Quantitative Units | USD Billion |
| Market Definition | Commercial B2B and retail-ingredient valuation of processed common buckwheat (Fagopyrum esculentum) and Tartary buckwheat (Fagopyrum tataricum) products including dehulled raw groats and toasted kasha with stone-milled soba/bakery flours, flakes, hulls and roasted tea granules. Excludes unprocessed farm-gate green forage and honey. |
| Regions Covered | North America and Latin America with Western Europe, Eastern Europe, East Asia, South Asia and Pacific and Middle East and Africa |
| Countries Covered | Japan and United States with France, Germany, Poland and Canada plus additional national markets |
| Key Companies Covered | Bob's Red Mill Natural Foods, Inc. and Birkett Mills with Minn-Dak Growers Ltd., Archer Daniels Midland Company, Cargill, Incorporated and Kawanishi Milling Co., Ltd. |
| Forecast Period | 2026 to 2036 |
| Approach | Primary and secondary research with top-down specialty grain baselines reconciled against bottom-up dehulled and milled buckwheat tonnage. |
Buckwheat Market - Research Methodology
Table 10: Research Methodology for the Buckwheat Market (research methods and approaches)
| Method | Approach |
|---|---|
| Primary Research | Structured interviews with buckwheat millers in North America, Poland, and Japan and soba noodle production managers with gluten-free bakery chemists and Tartary tea roasters to validate dehulling yields. |
| Secondary Research | Analysis of USDA FAS grain and trade reports and NARO Japan breeding publications with PubMed/PMC rutin and fagopyrin processing studies. |
| Market Sizing and Forecasting | Top-down global pseudocereal and gluten-free grain baselines reconciled against bottom-up commercial dehulled and milled buckwheat tonnage (1.58M to 1.75M MT in 2026) and average metric ton values from 2026 to 2036. |
| Country Forecasting Model | Econometric national projections weight domestic soba noodle consumption and Eastern European kasha processing with North America regenerative cover-crop acreage and gluten-free retail launches across six priority countries. |
| Operational Benchmark Traceability | Milled grain volume and processing line indicators in Tables 2, 3, and 4 trace to Foods rutin/fagopyrin assays and Food Chemistry X flavonoid retention ratios with Breeding Science cultivar yield data. |
| Data Triangulation and Validation | Valuation estimates isolate commercial dehulled groats, kasha, soba/galette flours, flakes, hulls, and roasted Tartary teas while strictly excluding unharvested green cover-crop biomass and monofloral buckwheat honey. |
Buckwheat Market by Segments
Buckwheat Market segmented by Product Form:
- Hulled Buckwheat Groats and Kasha
- Milled Buckwheat Soba and Galette Flour
- Buckwheat Flakes, Bran, and Hulls
- Roasted Tartary Buckwheat Tea Granules
Buckwheat Market segmented by Species:
- Common Buckwheat Fagopyrum esculentum
- Rutin-Rich Tartary Buckwheat Fagopyrum tataricum
Buckwheat Market segmented by Cultivation:
- Conventional
- Certified Organic
Buckwheat Market segmented by End Use:
- Soba Noodles, Pasta, and Bakery Products
- Breakfast Cereals, Porridges, and Snacks
- Functional Rutin Teas and Nutraceuticals
- Brewing, Distilling, and Hull Pillow Fillings
Buckwheat Market segmented by Distribution Channel:
- B2B Food Processors and Noodle Mills
- Supermarkets and Hypermarkets
- Specialty Organic and Health Grocers
Buckwheat Market segmented by Customer Scale:
- Multinational CPG and Beverage Groups
- Regional Co-Packers and Mid-Market Brands
- Artisanal and Foodservice Operators
Buckwheat Market by Region
- North America
- United States
- Canada
- Latin America
- Brazil
- Mexico
- Argentina
- Chile
- Western Europe
- Germany
- France
- United Kingdom
- Italy
- Spain
- Benelux
- Nordics
- Eastern Europe
- Poland
- Czech Republic
- Romania
- Hungary
- East Asia
- China
- Japan
- South Korea
- South Asia and Pacific
- India
- ASEAN
- Australia and New Zealand
- Middle East and Africa
- GCC Countries
- South Africa
- Türkiye
- Israel
Research Sources and Bibliography
- [1] Kim, J., Lee, S. A., & Kim, J. (2026, September 17). Effects of Household Processing on Rutin and Fagopyrin F in Common and Tartary Buckwheat. Foods, 15(18), 3284 (PMCID PMC13606827).
- [2] He, H. J., Li, G., Ou, X., Mahdi, A. A., & Obadi, M. (2026, April 19). Influence of processing on flavonoid retention, transformation, and bioavailability in Tartary buckwheat (Fagopyrum tataricum): a review. Food Chemistry: X, 35, 103872 (PMCID PMC13126036).
- [3] Otsuka, S., Hara, T., Ishiguro, K., Matsushima, K., Yasui, Y., & Matsui, K. (2025, June 18). Pollen parent affects rutin content of seeds of buckwheat (Fagopyrum esculentum). Breeding Science, 75(3), 179 to 186 (PMCID PMC12457789).
- [4] Oliveira, M. E. A. S., Carvalho, H. J. M., Martinez-Villaluenga, C., Takeiti, C. Y., & Clerici, M. T. P. S. (2026, April 24). Buckwheat (Fagopyrum spp.): Building Healthy Diets and Resilient Agrifood Systems. Journal of Agricultural and Food Chemistry, 74, 5c17847 (PubMed PMID 42031664).
- [5] Pinski, A., Mehdi, S. M. M., & Betekhtin, A. (2025, April 29). Molecular mechanisms underlying abiotic stress responses in buckwheat. Plant Science, 357, 112526 (PubMed PMID 40312013).
- [6] USDA Foreign Agricultural Service. (2026, March 25). Poland: Grain and Feed Annual. U.S. Department of Agriculture GAIN Report PL2026-0012.
- [7] Archer Daniels Midland Company. (2025, March 18). ADM's 2025 Protein Report: The Powerful Trends That Are Shaping Alternative Protein Innovation. ADM Corporate Newsroom.
- [8] Alibekova, Z., Bayisbayeva, M., Shamsudin, R., Bakhtybekova, A., Alibekov, R., & Aimenov, Z. (2026, May 11). Problems and Approaches in the Improvement of Gluten-Free Bread Texture: A Comprehensive Review. International Journal of Food Science, 2026, 5214023 (PMCID PMC13159086).
- [9] USDA Foreign Agricultural Service. (2026, October 20). Japan: FOODEX Japan 2026 Report. U.S. Department of Agriculture GAIN Report JA2026-0017.
- [10] Kerry Group. (2026, February 17). Kerry Group Preliminary Statement of Results for the year ended 31 December 2025. Kerry Group plc Media Releases.
- [11] Zhang, K., He, Y., Lin, H., He, J., Wang, Z., Li, W., & Zhou, M. (2026, August 20). Pangenome-guided breeding restores high-altitude adaptation and improves yield in Tartary buckwheat. Cell, 189(17), 5214 to 5231 (PubMed PMID 42580335).
- [12] Kim, Y. J., & Auh, J. H. (2025, June 8). Enhancing the functional properties of Tartary buckwheat (Fagopyrum tataricum) through heat treatment: implications for antioxidant and antidiabetic activities. Food Science and Biotechnology, 34(12), 2935 to 2946 (PMCID PMC12240896).
- [13] Hassona, M. M., Morsy, N. M., Hussein, A. M. S., & Abd El-Aal, H. A. (2026, May 14). The impact of environmental factors, sowing time, and soil conditions on the growth, yield, and resilience of Fagopyrum tataricum and Fagopyrum esculentum in Egyptian agroecosystems. PLOS ONE, 21(5), e0344039 (PMCID PMC13175345).
- [14] Wang, L., Chen, X., & Li, Y. (2026, May 12). Physicochemical Properties of Pre-Treatment Tartary Buckwheat Flour and Extruded Noodle Formulations. Foods, 15(10), 1975 (PMCID PMC13256933).
- [15] Khan, I., Shah, F., & Ahmad, Z. (2025, May 26). Effect of Buckwheat-Containing Bread on Postprandial Glycemia and Appetite in Healthy Adults. Food Science & Nutrition, 13(6), e70182 (PMCID PMC12106358).
- [16] Roquette Freres. (2025, June 17). Roquette Grows NUTRALYS Plant Protein Portfolio with Addition of New Textured Proteins and Gluten-Free Bakery Solutions. Roquette Corporate Press Releases.
- [17] USDA Foreign Agricultural Service. (2026, January 29). Germany: Large Retail Chains Support Record Year for German Organic Sales. U.S. Department of Agriculture GAIN Report GM2026-0003.
- [18] USDA Foreign Agricultural Service. (2025, April 2). France: Food Processing Ingredients Annual. U.S. Department of Agriculture GAIN Report FR2025-0004.
- [19] Zhang, Y., Liu, H., & Chen, J. (2026, August 14). Enhancing the Quality of Buckwheat Noodles Through the Addition of Hydrocolloids and Pre-Treated Common and Tartary Buckwheat Flours. Foods, 15(16), 2912 (PMCID PMC13565006).
- [20] USDA Foreign Agricultural Service. (2026, July 3). China: Grain and Feed Update. U.S. Department of Agriculture GAIN Report CH2026-0085.
This bibliography is provided for reader reference and is not exhaustive. The full report contains the complete reference list and detailed citations.
This Report Answers
- How large is the buckwheat market in 2026 and what is forecast for 2036?
- Which gluten-free bakery and soba noodle catalysts with Tartary tea demand support buckwheat growth?
- Why do Hulled Buckwheat Groats and Kasha lead the product form category?
- Why does Common Buckwheat Fagopyrum esculentum lead the species category globally?
- How do growth rates differ across the United States and Poland compared with Canada and Japan?
- Which leading companies operate dedicated gluten-free buckwheat stone-mills versus global grain origination?
- What limits summer pollination yields or causes gluten cross-contact and fagopyrin hurdles in the buckwheat market?
- What should CPG and noodle buyers evaluate when specifying dehulled groats and high-rutin Tartary buckwheat?
Table of Content
- Key Takeaways
- Market Size and CAGR
- Top Growth Driver
- Fastest Growing Segment
- Leading Region
- Key Companies
- Emerging Opportunities
- Executive Summary
- Global Market Outlook
- Demand-side Trends
- Supply-side Trends
- Technology Roadmap Analysis
- Analysis and Recommendations
- Analyst Perspective (What is happening? Why now? What should investors know?)
- Key Questions Answered
- How large is the market?
- What is the CAGR?
- What are key trends?
- Which region dominates?
- Who are the leaders?
Read More...
- Market Overview
- Market Coverage / Taxonomy
- Market Definition / Scope / Limitations
- Research Methodology
- Chapter Orientation
- Analytical Lens and Working Hypotheses
- Market Structure, Signals, and Trend Drivers
- Benchmarking and Cross-market Comparability
- Market Sizing, Forecasting, and Opportunity Mapping
- Research Design and Evidence Framework
- Desk Research Programme (Secondary Evidence)
- Expert Input and Fieldwork (Primary Evidence)
- Tooling, Models, and Reference Databases
- Data Engineering and Model Build
- Quality Assurance and Audit Trail
- Market Background
- Market Dynamics (Drivers, Restraints, Opportunity, Trends)
- Scenario Forecast (Optimistic, Likely, Conservative)
- Impact Analysis
- AI Impact
- Sustainability Impact
- Regulatory Impact
- Technology Impact
- Consumer / Buyer Analysis
- Purchase Drivers
- Adoption Barriers
- Buyer Journey
- Opportunity Map Analysis
- Product Life Cycle Analysis
- Supply Chain Analysis
- Investment Feasibility Matrix
- Value Chain Analysis
- PESTLE and Porter's Analysis
- Regulatory Landscape
- Regional Parent Market Outlook
- Production and Consumption Statistics
- Import and Export Statistics
- Global Market Analysis and Forecast, 2021 to 2036
- Historical Market Size Value (USD Billion) Analysis, 2021 to 2025
- Current and Future Market Size Value (USD Billion) Projections, 2026 to 2036
- Y-o-Y Growth Trend Analysis
- Absolute $ Opportunity Analysis
- Global Market Pricing Analysis, 2021 to 2036
- Global Market Analysis and Forecast, By Product Form, 2021 to 2036
- Introduction / Key Findings
- Historical Market Size Value (USD Billion) Analysis By Product Form, 2021 to 2025
- Current and Future Market Size Value (USD Billion) Analysis and Forecast By Product Form, 2026 to 2036
- Hulled Buckwheat Groats and Kasha
- Milled Buckwheat Soba and Galette Flour
- Buckwheat Flakes, Bran, and Hulls
- Roasted Tartary Buckwheat Tea Granules
- Y-o-Y Growth Trend Analysis By Product Form, 2021 to 2025
- Absolute $ Opportunity Analysis By Product Form, 2026 to 2036
- Global Market Analysis and Forecast, By Species, 2021 to 2036
- Introduction / Key Findings
- Historical Market Size Value (USD Billion) Analysis By Species, 2021 to 2025
- Current and Future Market Size Value (USD Billion) Analysis and Forecast By Species, 2026 to 2036
- Common Buckwheat Fagopyrum esculentum
- Rutin-Rich Tartary Buckwheat Fagopyrum tataricum
- Y-o-Y Growth Trend Analysis By Species, 2021 to 2025
- Absolute $ Opportunity Analysis By Species, 2026 to 2036
- Global Market Analysis and Forecast, By Cultivation, 2021 to 2036
- Introduction / Key Findings
- Historical Market Size Value (USD Billion) Analysis By Cultivation, 2021 to 2025
- Current and Future Market Size Value (USD Billion) Analysis and Forecast By Cultivation, 2026 to 2036
- Conventional
- Certified Organic
- Y-o-Y Growth Trend Analysis By Cultivation, 2021 to 2025
- Absolute $ Opportunity Analysis By Cultivation, 2026 to 2036
- Global Market Analysis and Forecast, By End Use, 2021 to 2036
- Introduction / Key Findings
- Historical Market Size Value (USD Billion) Analysis By End Use, 2021 to 2025
- Current and Future Market Size Value (USD Billion) Analysis and Forecast By End Use, 2026 to 2036
- Soba Noodles, Pasta, and Bakery Products
- Breakfast Cereals, Porridges, and Snacks
- Functional Rutin Teas and Nutraceuticals
- Brewing, Distilling, and Hull Pillow Fillings
- Y-o-Y Growth Trend Analysis By End Use, 2021 to 2025
- Absolute $ Opportunity Analysis By End Use, 2026 to 2036
- Global Market Analysis and Forecast, By Distribution Channel, 2021 to 2036
- Introduction / Key Findings
- Historical Market Size Value (USD Billion) Analysis By Distribution Channel, 2021 to 2025
- Current and Future Market Size Value (USD Billion) Analysis and Forecast By Distribution Channel, 2026 to 2036
- B2B Food Processors and Noodle Mills
- Supermarkets and Hypermarkets
- Specialty Organic and Health Grocers
- Y-o-Y Growth Trend Analysis By Distribution Channel, 2021 to 2025
- Absolute $ Opportunity Analysis By Distribution Channel, 2026 to 2036
- Global Market Analysis and Forecast, By Customer Scale, 2021 to 2036
- Introduction / Key Findings
- Historical Market Size Value (USD Billion) Analysis By Customer Scale, 2021 to 2025
- Current and Future Market Size Value (USD Billion) Analysis and Forecast By Customer Scale, 2026 to 2036
- Multinational CPG and Beverage Groups
- Regional Co-Packers and Mid-Market Brands
- Artisanal and Foodservice Operators
- Y-o-Y Growth Trend Analysis By Customer Scale, 2021 to 2025
- Absolute $ Opportunity Analysis By Customer Scale, 2026 to 2036
- Global Market Analysis and Forecast, By Region, 2021 to 2036
- Introduction
- Historical Market Size Value (USD Billion) Analysis By Region, 2021 to 2025
- Current Market Size Value (USD Billion) Analysis and Forecast By Region, 2026 to 2036
- North America
- Latin America
- Western Europe
- Eastern Europe
- East Asia
- South Asia and Pacific
- Middle East and Africa
- Market Attractiveness Analysis By Region
- North America Market Analysis and Forecast, By Country, 2021 to 2036
- Historical Market Size Value (USD Billion) Trend Analysis By Market Taxonomy, 2021 to 2025
- Market Size Value (USD Billion) Forecast By Market Taxonomy, 2026 to 2036
- By Country
- United States
- Canada
- By Product Form
- By Species
- By Cultivation
- By End Use
- By Distribution Channel
- By Customer Scale
- By Country
- Market Attractiveness Analysis
- By Country
- By Product Form
- By Species
- By Cultivation
- By End Use
- By Distribution Channel
- By Customer Scale
- Key Takeaways
- Latin America Market Analysis and Forecast, By Country
- Historical Market Size Value (USD Billion) Trend Analysis By Market Taxonomy, 2021 to 2025
- Market Size Value (USD Billion) Forecast By Market Taxonomy, 2026 to 2036
- By Country
- Brazil
- Mexico
- Argentina
- Chile
- By Product Form
- By Species
- By Cultivation
- By End Use
- By Distribution Channel
- By Customer Scale
- By Country
- Market Attractiveness Analysis
- By Country
- By Product Form
- By Species
- By Cultivation
- By End Use
- By Distribution Channel
- By Customer Scale
- Key Takeaways
- Western Europe Market Analysis and Forecast, By Country
- Historical Market Size Value (USD Billion) Trend Analysis By Market Taxonomy, 2021 to 2025
- Market Size Value (USD Billion) Forecast By Market Taxonomy, 2026 to 2036
- By Country
- Germany
- France
- United Kingdom
- Italy
- Spain
- Benelux
- Nordics
- By Product Form
- By Species
- By Cultivation
- By End Use
- By Distribution Channel
- By Customer Scale
- By Country
- Market Attractiveness Analysis
- By Country
- By Product Form
- By Species
- By Cultivation
- By End Use
- By Distribution Channel
- By Customer Scale
- Key Takeaways
- Eastern Europe Market Analysis and Forecast, By Country
- Historical Market Size Value (USD Billion) Trend Analysis By Market Taxonomy, 2021 to 2025
- Market Size Value (USD Billion) Forecast By Market Taxonomy, 2026 to 2036
- By Country
- Poland
- Czech Republic
- Romania
- Hungary
- By Product Form
- By Species
- By Cultivation
- By End Use
- By Distribution Channel
- By Customer Scale
- By Country
- Market Attractiveness Analysis
- By Country
- By Product Form
- By Species
- By Cultivation
- By End Use
- By Distribution Channel
- By Customer Scale
- Key Takeaways
- East Asia Market Analysis and Forecast, By Country
- Historical Market Size Value (USD Billion) Trend Analysis By Market Taxonomy, 2021 to 2025
- Market Size Value (USD Billion) Forecast By Market Taxonomy, 2026 to 2036
- By Country
- China
- Japan
- South Korea
- By Product Form
- By Species
- By Cultivation
- By End Use
- By Distribution Channel
- By Customer Scale
- By Country
- Market Attractiveness Analysis
- By Country
- By Product Form
- By Species
- By Cultivation
- By End Use
- By Distribution Channel
- By Customer Scale
- Key Takeaways
- South Asia and Pacific Market Analysis and Forecast, By Country
- Historical Market Size Value (USD Billion) Trend Analysis By Market Taxonomy, 2021 to 2025
- Market Size Value (USD Billion) Forecast By Market Taxonomy, 2026 to 2036
- By Country
- India
- ASEAN
- Australia and New Zealand
- By Product Form
- By Species
- By Cultivation
- By End Use
- By Distribution Channel
- By Customer Scale
- By Country
- Market Attractiveness Analysis
- By Country
- By Product Form
- By Species
- By Cultivation
- By End Use
- By Distribution Channel
- By Customer Scale
- Key Takeaways
- Middle East and Africa Market Analysis and Forecast, By Country
- Historical Market Size Value (USD Billion) Trend Analysis By Market Taxonomy, 2021 to 2025
- Market Size Value (USD Billion) Forecast By Market Taxonomy, 2026 to 2036
- By Country
- GCC Countries
- South Africa
- Türkiye
- Israel
- By Product Form
- By Species
- By Cultivation
- By End Use
- By Distribution Channel
- By Customer Scale
- By Country
- Market Attractiveness Analysis
- By Country
- By Product Form
- By Species
- By Cultivation
- By End Use
- By Distribution Channel
- By Customer Scale
- Key Takeaways
- Key Countries Market Analysis
- United States
- Pricing Analysis
- Market Share Analysis, 2025
- By Product Form
- By Species
- By Cultivation
- By End Use
- By Distribution Channel
- By Customer Scale
- Canada
- Pricing Analysis
- Market Share Analysis, 2025
- By Product Form
- By Species
- By Cultivation
- By End Use
- By Distribution Channel
- By Customer Scale
- Mexico
- Pricing Analysis
- Market Share Analysis, 2025
- By Product Form
- By Species
- By Cultivation
- By End Use
- By Distribution Channel
- By Customer Scale
- Brazil
- Pricing Analysis
- Market Share Analysis, 2025
- By Product Form
- By Species
- By Cultivation
- By End Use
- By Distribution Channel
- By Customer Scale
- Chile
- Pricing Analysis
- Market Share Analysis, 2025
- By Product Form
- By Species
- By Cultivation
- By End Use
- By Distribution Channel
- By Customer Scale
- Germany
- Pricing Analysis
- Market Share Analysis, 2025
- By Product Form
- By Species
- By Cultivation
- By End Use
- By Distribution Channel
- By Customer Scale
- United Kingdom
- Pricing Analysis
- Market Share Analysis, 2025
- By Product Form
- By Species
- By Cultivation
- By End Use
- By Distribution Channel
- By Customer Scale
- Italy
- Pricing Analysis
- Market Share Analysis, 2025
- By Product Form
- By Species
- By Cultivation
- By End Use
- By Distribution Channel
- By Customer Scale
- Spain
- Pricing Analysis
- Market Share Analysis, 2025
- By Product Form
- By Species
- By Cultivation
- By End Use
- By Distribution Channel
- By Customer Scale
- France
- Pricing Analysis
- Market Share Analysis, 2025
- By Product Form
- By Species
- By Cultivation
- By End Use
- By Distribution Channel
- By Customer Scale
- India
- Pricing Analysis
- Market Share Analysis, 2025
- By Product Form
- By Species
- By Cultivation
- By End Use
- By Distribution Channel
- By Customer Scale
- ASEAN
- Pricing Analysis
- Market Share Analysis, 2025
- By Product Form
- By Species
- By Cultivation
- By End Use
- By Distribution Channel
- By Customer Scale
- Australia and New Zealand
- Pricing Analysis
- Market Share Analysis, 2025
- By Product Form
- By Species
- By Cultivation
- By End Use
- By Distribution Channel
- By Customer Scale
- China
- Pricing Analysis
- Market Share Analysis, 2025
- By Product Form
- By Species
- By Cultivation
- By End Use
- By Distribution Channel
- By Customer Scale
- Japan
- Pricing Analysis
- Market Share Analysis, 2025
- By Product Form
- By Species
- By Cultivation
- By End Use
- By Distribution Channel
- By Customer Scale
- South Korea
- Pricing Analysis
- Market Share Analysis, 2025
- By Product Form
- By Species
- By Cultivation
- By End Use
- By Distribution Channel
- By Customer Scale
- Poland
- Pricing Analysis
- Market Share Analysis, 2025
- By Product Form
- By Species
- By Cultivation
- By End Use
- By Distribution Channel
- By Customer Scale
- Hungary
- Pricing Analysis
- Market Share Analysis, 2025
- By Product Form
- By Species
- By Cultivation
- By End Use
- By Distribution Channel
- By Customer Scale
- Türkiye
- Pricing Analysis
- Market Share Analysis, 2025
- By Product Form
- By Species
- By Cultivation
- By End Use
- By Distribution Channel
- By Customer Scale
- South Africa
- Pricing Analysis
- Market Share Analysis, 2025
- By Product Form
- By Species
- By Cultivation
- By End Use
- By Distribution Channel
- By Customer Scale
- United States
- Market Structure Analysis
- Competition Dashboard
- Competition Benchmarking
- Market Share Analysis of Top Players
- By Regional
- By Product Form
- By Species
- By Cultivation
- By End Use
- By Distribution Channel
- By Customer Scale
- Emerging Startups
- Innovation Benchmarking
- Competition Analysis
- Competition Deep Dive
- Bob's Red Mill Natural Foods, Inc.
- Overview
- Product Portfolio
- Profitability by Market Segments
- Sales Footprint
- Strategy Overview
- Marketing Strategy
- Product Strategy
- Channel Strategy
- Birkett Mills
- Minn-Dak Growers Ltd.
- Archer Daniels Midland Company
- Cargill, Incorporated
- Kawanishi Milling Co., Ltd.
- Bob's Red Mill Natural Foods, Inc.
- Case Studies
- Success Stories
- Recent Developments
- Competition Deep Dive
- Assumptions & Acronyms Used
List of Tables
- Table 1: Global Market Value (USD Billion) Forecast by Region, 2021 to 2036
- Table 2: Global Market Value (USD Billion) Forecast by Product Form, 2021 to 2036
- Table 3: Global Market Value (USD Billion) Forecast by Species, 2021 to 2036
- Table 4: Global Market Value (USD Billion) Forecast by Cultivation, 2021 to 2036
- Table 5: Global Market Value (USD Billion) Forecast by End Use, 2021 to 2036
- Table 6: Global Market Value (USD Billion) Forecast by Distribution Channel, 2021 to 2036
- Table 7: Global Market Value (USD Billion) Forecast by Customer Scale, 2021 to 2036
- Table 8: North America Market Value (USD Billion) Forecast by Country, 2021 to 2036
- Table 9: North America Market Value (USD Billion) Forecast by Product Form, 2021 to 2036
- Table 10: North America Market Value (USD Billion) Forecast by Species, 2021 to 2036
- Table 11: North America Market Value (USD Billion) Forecast by Cultivation, 2021 to 2036
- Table 12: North America Market Value (USD Billion) Forecast by End Use, 2021 to 2036
- Table 13: North America Market Value (USD Billion) Forecast by Distribution Channel, 2021 to 2036
- Table 14: North America Market Value (USD Billion) Forecast by Customer Scale, 2021 to 2036
- Table 15: Latin America Market Value (USD Billion) Forecast by Country, 2021 to 2036
- Table 16: Latin America Market Value (USD Billion) Forecast by Product Form, 2021 to 2036
- Table 17: Latin America Market Value (USD Billion) Forecast by Species, 2021 to 2036
- Table 18: Latin America Market Value (USD Billion) Forecast by Cultivation, 2021 to 2036
- Table 19: Latin America Market Value (USD Billion) Forecast by End Use, 2021 to 2036
- Table 20: Latin America Market Value (USD Billion) Forecast by Distribution Channel, 2021 to 2036
- Table 21: Latin America Market Value (USD Billion) Forecast by Customer Scale, 2021 to 2036
- Table 22: Western Europe Market Value (USD Billion) Forecast by Country, 2021 to 2036
- Table 23: Western Europe Market Value (USD Billion) Forecast by Product Form, 2021 to 2036
- Table 24: Western Europe Market Value (USD Billion) Forecast by Species, 2021 to 2036
- Table 25: Western Europe Market Value (USD Billion) Forecast by Cultivation, 2021 to 2036
- Table 26: Western Europe Market Value (USD Billion) Forecast by End Use, 2021 to 2036
- Table 27: Western Europe Market Value (USD Billion) Forecast by Distribution Channel, 2021 to 2036
- Table 28: Western Europe Market Value (USD Billion) Forecast by Customer Scale, 2021 to 2036
- Table 29: Eastern Europe Market Value (USD Billion) Forecast by Country, 2021 to 2036
- Table 30: Eastern Europe Market Value (USD Billion) Forecast by Product Form, 2021 to 2036
- Table 31: Eastern Europe Market Value (USD Billion) Forecast by Species, 2021 to 2036
- Table 32: Eastern Europe Market Value (USD Billion) Forecast by Cultivation, 2021 to 2036
- Table 33: Eastern Europe Market Value (USD Billion) Forecast by End Use, 2021 to 2036
- Table 34: Eastern Europe Market Value (USD Billion) Forecast by Distribution Channel, 2021 to 2036
- Table 35: Eastern Europe Market Value (USD Billion) Forecast by Customer Scale, 2021 to 2036
- Table 36: East Asia Market Value (USD Billion) Forecast by Country, 2021 to 2036
- Table 37: East Asia Market Value (USD Billion) Forecast by Product Form, 2021 to 2036
- Table 38: East Asia Market Value (USD Billion) Forecast by Species, 2021 to 2036
- Table 39: East Asia Market Value (USD Billion) Forecast by Cultivation, 2021 to 2036
- Table 40: East Asia Market Value (USD Billion) Forecast by End Use, 2021 to 2036
- Table 41: East Asia Market Value (USD Billion) Forecast by Distribution Channel, 2021 to 2036
- Table 42: East Asia Market Value (USD Billion) Forecast by Customer Scale, 2021 to 2036
- Table 43: South Asia and Pacific Market Value (USD Billion) Forecast by Country, 2021 to 2036
- Table 44: South Asia and Pacific Market Value (USD Billion) Forecast by Product Form, 2021 to 2036
- Table 45: South Asia and Pacific Market Value (USD Billion) Forecast by Species, 2021 to 2036
- Table 46: South Asia and Pacific Market Value (USD Billion) Forecast by Cultivation, 2021 to 2036
- Table 47: South Asia and Pacific Market Value (USD Billion) Forecast by End Use, 2021 to 2036
- Table 48: South Asia and Pacific Market Value (USD Billion) Forecast by Distribution Channel, 2021 to 2036
- Table 49: South Asia and Pacific Market Value (USD Billion) Forecast by Customer Scale, 2021 to 2036
- Table 50: Middle East and Africa Market Value (USD Billion) Forecast by Country, 2021 to 2036
- Table 51: Middle East and Africa Market Value (USD Billion) Forecast by Product Form, 2021 to 2036
- Table 52: Middle East and Africa Market Value (USD Billion) Forecast by Species, 2021 to 2036
- Table 53: Middle East and Africa Market Value (USD Billion) Forecast by Cultivation, 2021 to 2036
- Table 54: Middle East and Africa Market Value (USD Billion) Forecast by End Use, 2021 to 2036
- Table 55: Middle East and Africa Market Value (USD Billion) Forecast by Distribution Channel, 2021 to 2036
- Table 56: Middle East and Africa Market Value (USD Billion) Forecast by Customer Scale, 2021 to 2036
List of Figures
- Figure 1: Global Market Pricing Analysis
- Figure 2: Global Market Value (USD Billion) Forecast 2021-2036
- Figure 3: Global Market Value Share and BPS Analysis by Product Form, 2026 and 2036
- Figure 4: Global Market Y-o-Y Growth Comparison by Product Form, 2026-2036
- Figure 5: Global Market Attractiveness Analysis by Product Form
- Figure 6: Global Market Value Share and BPS Analysis by Species, 2026 and 2036
- Figure 7: Global Market Y-o-Y Growth Comparison by Species, 2026-2036
- Figure 8: Global Market Attractiveness Analysis by Species
- Figure 9: Global Market Value Share and BPS Analysis by Cultivation, 2026 and 2036
- Figure 10: Global Market Y-o-Y Growth Comparison by Cultivation, 2026-2036
- Figure 11: Global Market Attractiveness Analysis by Cultivation
- Figure 12: Global Market Value Share and BPS Analysis by End Use, 2026 and 2036
- Figure 13: Global Market Y-o-Y Growth Comparison by End Use, 2026-2036
- Figure 14: Global Market Attractiveness Analysis by End Use
- Figure 15: Global Market Value Share and BPS Analysis by Distribution Channel, 2026 and 2036
- Figure 16: Global Market Y-o-Y Growth Comparison by Distribution Channel, 2026-2036
- Figure 17: Global Market Attractiveness Analysis by Distribution Channel
- Figure 18: Global Market Value Share and BPS Analysis by Customer Scale, 2026 and 2036
- Figure 19: Global Market Y-o-Y Growth Comparison by Customer Scale, 2026-2036
- Figure 20: Global Market Attractiveness Analysis by Customer Scale
- Figure 21: Global Market Value (USD Billion) Share and BPS Analysis by Region, 2026 and 2036
- Figure 22: Global Market Y-o-Y Growth Comparison by Region, 2026-2036
- Figure 23: Global Market Attractiveness Analysis by Region
- Figure 24: North America Market Incremental Dollar Opportunity, 2026-2036
- Figure 25: Latin America Market Incremental Dollar Opportunity, 2026-2036
- Figure 26: Western Europe Market Incremental Dollar Opportunity, 2026-2036
- Figure 27: Eastern Europe Market Incremental Dollar Opportunity, 2026-2036
- Figure 28: East Asia Market Incremental Dollar Opportunity, 2026-2036
- Figure 29: South Asia and Pacific Market Incremental Dollar Opportunity, 2026-2036
- Figure 30: Middle East and Africa Market Incremental Dollar Opportunity, 2026-2036
- Figure 31: North America Market Value Share and BPS Analysis by Country, 2026 and 2036
- Figure 32: North America Market Value Share and BPS Analysis by Product Form, 2026 and 2036
- Figure 33: North America Market Y-o-Y Growth Comparison by Product Form, 2026-2036
- Figure 34: North America Market Attractiveness Analysis by Product Form
- Figure 35: North America Market Value Share and BPS Analysis by Species, 2026 and 2036
- Figure 36: North America Market Y-o-Y Growth Comparison by Species, 2026-2036
- Figure 37: North America Market Attractiveness Analysis by Species
- Figure 38: North America Market Value Share and BPS Analysis by Cultivation, 2026 and 2036
- Figure 39: North America Market Y-o-Y Growth Comparison by Cultivation, 2026-2036
- Figure 40: North America Market Attractiveness Analysis by Cultivation
- Figure 41: North America Market Value Share and BPS Analysis by End Use, 2026 and 2036
- Figure 42: North America Market Y-o-Y Growth Comparison by End Use, 2026-2036
- Figure 43: North America Market Attractiveness Analysis by End Use
- Figure 44: North America Market Value Share and BPS Analysis by Distribution Channel, 2026 and 2036
- Figure 45: North America Market Y-o-Y Growth Comparison by Distribution Channel, 2026-2036
- Figure 46: North America Market Attractiveness Analysis by Distribution Channel
- Figure 47: North America Market Value Share and BPS Analysis by Customer Scale, 2026 and 2036
- Figure 48: North America Market Y-o-Y Growth Comparison by Customer Scale, 2026-2036
- Figure 49: North America Market Attractiveness Analysis by Customer Scale
- Figure 50: Latin America Market Value Share and BPS Analysis by Country, 2026 and 2036
- Figure 51: Latin America Market Value Share and BPS Analysis by Product Form, 2026 and 2036
- Figure 52: Latin America Market Y-o-Y Growth Comparison by Product Form, 2026-2036
- Figure 53: Latin America Market Attractiveness Analysis by Product Form
- Figure 54: Latin America Market Value Share and BPS Analysis by Species, 2026 and 2036
- Figure 55: Latin America Market Y-o-Y Growth Comparison by Species, 2026-2036
- Figure 56: Latin America Market Attractiveness Analysis by Species
- Figure 57: Latin America Market Value Share and BPS Analysis by Cultivation, 2026 and 2036
- Figure 58: Latin America Market Y-o-Y Growth Comparison by Cultivation, 2026-2036
- Figure 59: Latin America Market Attractiveness Analysis by Cultivation
- Figure 60: Latin America Market Value Share and BPS Analysis by End Use, 2026 and 2036
- Figure 61: Latin America Market Y-o-Y Growth Comparison by End Use, 2026-2036
- Figure 62: Latin America Market Attractiveness Analysis by End Use
- Figure 63: Latin America Market Value Share and BPS Analysis by Distribution Channel, 2026 and 2036
- Figure 64: Latin America Market Y-o-Y Growth Comparison by Distribution Channel, 2026-2036
- Figure 65: Latin America Market Attractiveness Analysis by Distribution Channel
- Figure 66: Latin America Market Value Share and BPS Analysis by Customer Scale, 2026 and 2036
- Figure 67: Latin America Market Y-o-Y Growth Comparison by Customer Scale, 2026-2036
- Figure 68: Latin America Market Attractiveness Analysis by Customer Scale
- Figure 69: Western Europe Market Value Share and BPS Analysis by Country, 2026 and 2036
- Figure 70: Western Europe Market Value Share and BPS Analysis by Product Form, 2026 and 2036
- Figure 71: Western Europe Market Y-o-Y Growth Comparison by Product Form, 2026-2036
- Figure 72: Western Europe Market Attractiveness Analysis by Product Form
- Figure 73: Western Europe Market Value Share and BPS Analysis by Species, 2026 and 2036
- Figure 74: Western Europe Market Y-o-Y Growth Comparison by Species, 2026-2036
- Figure 75: Western Europe Market Attractiveness Analysis by Species
- Figure 76: Western Europe Market Value Share and BPS Analysis by Cultivation, 2026 and 2036
- Figure 77: Western Europe Market Y-o-Y Growth Comparison by Cultivation, 2026-2036
- Figure 78: Western Europe Market Attractiveness Analysis by Cultivation
- Figure 79: Western Europe Market Value Share and BPS Analysis by End Use, 2026 and 2036
- Figure 80: Western Europe Market Y-o-Y Growth Comparison by End Use, 2026-2036
- Figure 81: Western Europe Market Attractiveness Analysis by End Use
- Figure 82: Western Europe Market Value Share and BPS Analysis by Distribution Channel, 2026 and 2036
- Figure 83: Western Europe Market Y-o-Y Growth Comparison by Distribution Channel, 2026-2036
- Figure 84: Western Europe Market Attractiveness Analysis by Distribution Channel
- Figure 85: Western Europe Market Value Share and BPS Analysis by Customer Scale, 2026 and 2036
- Figure 86: Western Europe Market Y-o-Y Growth Comparison by Customer Scale, 2026-2036
- Figure 87: Western Europe Market Attractiveness Analysis by Customer Scale
- Figure 88: Eastern Europe Market Value Share and BPS Analysis by Country, 2026 and 2036
- Figure 89: Eastern Europe Market Value Share and BPS Analysis by Product Form, 2026 and 2036
- Figure 90: Eastern Europe Market Y-o-Y Growth Comparison by Product Form, 2026-2036
- Figure 91: Eastern Europe Market Attractiveness Analysis by Product Form
- Figure 92: Eastern Europe Market Value Share and BPS Analysis by Species, 2026 and 2036
- Figure 93: Eastern Europe Market Y-o-Y Growth Comparison by Species, 2026-2036
- Figure 94: Eastern Europe Market Attractiveness Analysis by Species
- Figure 95: Eastern Europe Market Value Share and BPS Analysis by Cultivation, 2026 and 2036
- Figure 96: Eastern Europe Market Y-o-Y Growth Comparison by Cultivation, 2026-2036
- Figure 97: Eastern Europe Market Attractiveness Analysis by Cultivation
- Figure 98: Eastern Europe Market Value Share and BPS Analysis by End Use, 2026 and 2036
- Figure 99: Eastern Europe Market Y-o-Y Growth Comparison by End Use, 2026-2036
- Figure 100: Eastern Europe Market Attractiveness Analysis by End Use
- Figure 101: Eastern Europe Market Value Share and BPS Analysis by Distribution Channel, 2026 and 2036
- Figure 102: Eastern Europe Market Y-o-Y Growth Comparison by Distribution Channel, 2026-2036
- Figure 103: Eastern Europe Market Attractiveness Analysis by Distribution Channel
- Figure 104: Eastern Europe Market Value Share and BPS Analysis by Customer Scale, 2026 and 2036
- Figure 105: Eastern Europe Market Y-o-Y Growth Comparison by Customer Scale, 2026-2036
- Figure 106: Eastern Europe Market Attractiveness Analysis by Customer Scale
- Figure 107: East Asia Market Value Share and BPS Analysis by Country, 2026 and 2036
- Figure 108: East Asia Market Value Share and BPS Analysis by Product Form, 2026 and 2036
- Figure 109: East Asia Market Y-o-Y Growth Comparison by Product Form, 2026-2036
- Figure 110: East Asia Market Attractiveness Analysis by Product Form
- Figure 111: East Asia Market Value Share and BPS Analysis by Species, 2026 and 2036
- Figure 112: East Asia Market Y-o-Y Growth Comparison by Species, 2026-2036
- Figure 113: East Asia Market Attractiveness Analysis by Species
- Figure 114: East Asia Market Value Share and BPS Analysis by Cultivation, 2026 and 2036
- Figure 115: East Asia Market Y-o-Y Growth Comparison by Cultivation, 2026-2036
- Figure 116: East Asia Market Attractiveness Analysis by Cultivation
- Figure 117: East Asia Market Value Share and BPS Analysis by End Use, 2026 and 2036
- Figure 118: East Asia Market Y-o-Y Growth Comparison by End Use, 2026-2036
- Figure 119: East Asia Market Attractiveness Analysis by End Use
- Figure 120: East Asia Market Value Share and BPS Analysis by Distribution Channel, 2026 and 2036
- Figure 121: East Asia Market Y-o-Y Growth Comparison by Distribution Channel, 2026-2036
- Figure 122: East Asia Market Attractiveness Analysis by Distribution Channel
- Figure 123: East Asia Market Value Share and BPS Analysis by Customer Scale, 2026 and 2036
- Figure 124: East Asia Market Y-o-Y Growth Comparison by Customer Scale, 2026-2036
- Figure 125: East Asia Market Attractiveness Analysis by Customer Scale
- Figure 126: South Asia and Pacific Market Value Share and BPS Analysis by Country, 2026 and 2036
- Figure 127: South Asia and Pacific Market Value Share and BPS Analysis by Product Form, 2026 and 2036
- Figure 128: South Asia and Pacific Market Y-o-Y Growth Comparison by Product Form, 2026-2036
- Figure 129: South Asia and Pacific Market Attractiveness Analysis by Product Form
- Figure 130: South Asia and Pacific Market Value Share and BPS Analysis by Species, 2026 and 2036
- Figure 131: South Asia and Pacific Market Y-o-Y Growth Comparison by Species, 2026-2036
- Figure 132: South Asia and Pacific Market Attractiveness Analysis by Species
- Figure 133: South Asia and Pacific Market Value Share and BPS Analysis by Cultivation, 2026 and 2036
- Figure 134: South Asia and Pacific Market Y-o-Y Growth Comparison by Cultivation, 2026-2036
- Figure 135: South Asia and Pacific Market Attractiveness Analysis by Cultivation
- Figure 136: South Asia and Pacific Market Value Share and BPS Analysis by End Use, 2026 and 2036
- Figure 137: South Asia and Pacific Market Y-o-Y Growth Comparison by End Use, 2026-2036
- Figure 138: South Asia and Pacific Market Attractiveness Analysis by End Use
- Figure 139: South Asia and Pacific Market Value Share and BPS Analysis by Distribution Channel, 2026 and 2036
- Figure 140: South Asia and Pacific Market Y-o-Y Growth Comparison by Distribution Channel, 2026-2036
- Figure 141: South Asia and Pacific Market Attractiveness Analysis by Distribution Channel
- Figure 142: South Asia and Pacific Market Value Share and BPS Analysis by Customer Scale, 2026 and 2036
- Figure 143: South Asia and Pacific Market Y-o-Y Growth Comparison by Customer Scale, 2026-2036
- Figure 144: South Asia and Pacific Market Attractiveness Analysis by Customer Scale
- Figure 145: Middle East and Africa Market Value Share and BPS Analysis by Country, 2026 and 2036
- Figure 146: Middle East and Africa Market Value Share and BPS Analysis by Product Form, 2026 and 2036
- Figure 147: Middle East and Africa Market Y-o-Y Growth Comparison by Product Form, 2026-2036
- Figure 148: Middle East and Africa Market Attractiveness Analysis by Product Form
- Figure 149: Middle East and Africa Market Value Share and BPS Analysis by Species, 2026 and 2036
- Figure 150: Middle East and Africa Market Y-o-Y Growth Comparison by Species, 2026-2036
- Figure 151: Middle East and Africa Market Attractiveness Analysis by Species
- Figure 152: Middle East and Africa Market Value Share and BPS Analysis by Cultivation, 2026 and 2036
- Figure 153: Middle East and Africa Market Y-o-Y Growth Comparison by Cultivation, 2026-2036
- Figure 154: Middle East and Africa Market Attractiveness Analysis by Cultivation
- Figure 155: Middle East and Africa Market Value Share and BPS Analysis by End Use, 2026 and 2036
- Figure 156: Middle East and Africa Market Y-o-Y Growth Comparison by End Use, 2026-2036
- Figure 157: Middle East and Africa Market Attractiveness Analysis by End Use
- Figure 158: Middle East and Africa Market Value Share and BPS Analysis by Distribution Channel, 2026 and 2036
- Figure 159: Middle East and Africa Market Y-o-Y Growth Comparison by Distribution Channel, 2026-2036
- Figure 160: Middle East and Africa Market Attractiveness Analysis by Distribution Channel
- Figure 161: Middle East and Africa Market Value Share and BPS Analysis by Customer Scale, 2026 and 2036
- Figure 162: Middle East and Africa Market Y-o-Y Growth Comparison by Customer Scale, 2026-2036
- Figure 163: Middle East and Africa Market Attractiveness Analysis by Customer Scale
- Figure 164: Global Market - Tier Structure Analysis
- Figure 165: Global Market - Company Share Analysis
Frequently Asked Questions
How big is the buckwheat market in 2026, and what is forecast for 2036?
FMI estimates that the global buckwheat market size stood at USD 1.9 billion in 2025 and reached USD 2.0 billion in 2026. Overall industry valuation is projected to reach USD 3.2 billion by 2036 as food processors and consumers adopt gluten-free pseudocereals and rutin-rich Tartary buckwheat products.
What is the CAGR for the buckwheat market from 2026 to 2036?
Global buckwheat demand is projected to climb at a 4.8% annual rate from 2026 through 2036, generating USD 1.2 billion in incremental market value.
Which product form segment leads the buckwheat market?
Hulled Buckwheat Groats and Kasha command 46.8% of 2026 product form demand since intact raw groats and toasted kasha resist lipid oxidation and supply both retail packs and flour mills.
Which species segment leads the buckwheat market?
Common Buckwheat Fagopyrum esculentum represents 78.4% of the species category in 2026 as larger achenes and mild flavor fit mainstream soba noodles and gluten-free baking mixes.
Which country has a notable growth outlook during the assessment period?
The United States leads national expansion projections at a 5.3% CAGR through 2036, driven by regenerative cover-crop grain contracting and functional Tartary buckwheat bakery and tea launches.
Who are the key players in the market?
Bob's Red Mill Natural Foods, Inc. and Birkett Mills with Minn-Dak Growers Ltd. and Archer Daniels Midland Company plus Cargill, Incorporated and Kawanishi Milling Co., Ltd. represent the leading millers profiled.
Preview the report firsthand - request a free sample
Get SampleGet the brochure for pricing and purchase details.
Get PDF
