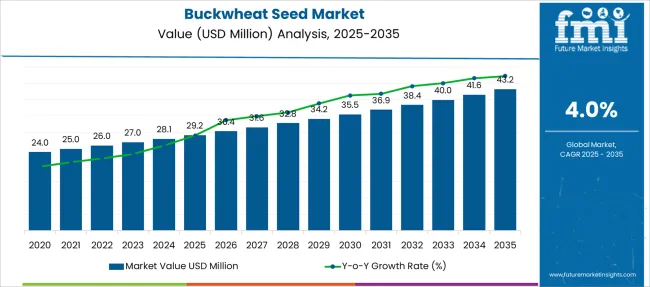
The global buckwheat seed market size is expected to reach USD 38.42 Million in 2032. The buckwheat seed market is growing rapidly.
As per FMI Analysts, the global Buckwheat seed market is estimated to be valued at USD 25.96 Million in 2022 and is projected to increase at a CAGR of 4.0% in the forecast period from 2022 to 2032.
Report Attribute | Details |
---|---|
Buckwheat Seed Market Estimated Base Year Value (2021) | USD 24.96 Million |
Buckwheat Seed Market Expected Market Value (2022) | USD 25.96 Million |
Buckwheat Seed Market Anticipated Forecast Value (2032) | USD 38.42 Million |
Buckwheat Seed Market Projected Growth Rate (2022 to 2032) | 4.0% CAGR |
Buckwheat seed is a pseudo cereal containing high antioxidant and antioxidant compounds, which help reduce cancer development. Buckwheat seed is also used in beverage formulation for preventing liver fattening and in animal feed to give proper nutrition to animals. Other than animal feed, buckwheat seed is also used in weight loss supplements. The diversified End User of buckwheat seed is projected to drive the growth of the buckwheat seed market over the forecast period.
A lot of deaths all over the world are caused by cardiovascular disease, which shows that consumers are at risk of cardiovascular disease. Therefore, consumers are moving toward low-fat foods and also toward other healthy sources of food, such as buckwheat seeds rich in fiber, complex carbohydrates, and less fat; this, in turn, is shifting the buckwheat seed market size.
In the cosmetic and personal care industry, buckwheat seed is growing in popularity due to the fact that consumers are experiencing skin problems and hair loss problems due to various factors such as aging, improper diet, and environmental factors from pollution and rise in temperatures, who are driving the demand for buckwheat seed consumers by increasing the business profit for manufacturers operating in the buckwheat seed market.
The growing agriculture industry increased awareness about the health benefits of vegetables, and expanding agricultural land in this region are the key factors driving the buckwheat seed market in this region. China and India are two countries that produce and consume the most vegetables in the region.
The world's largest vegetable seed market is China, and these factors could translate into the region dominating the global market. However, the European market will also prove to have considerable demand owing to the rapid development of breeding technologies that result in high-quality planting seeds, propelling the buckwheat seed market share.
Growing demand for hybrid seeds of tomato, lettuce, and sweet pepper is fueling the North American market in the foreseeable future. The vegetable planting seeds industry is heavily dependent on vegetables in the USA as well as Canada and Mexico.
As a result of a rise in the area under cultivation of vegetables and increasing awareness of vegetable consumption regularly, the market in the Middle East and Africa is growing. Turkey is also a key market for buckwheat seed in the region, supporting its sales through high demand for buckwheat seed in local and international markets.
The buckwheat seed market has received a lot of traction in the industry.
The growth of the buckwheat seed market is driven by the multiple End Users of buckwheat seed that are expected to drive the market over the forecast period. Buckwheat seed is a pseudo-cereal that contains polyphenols that can fight cancer. Buckwheat seed is also used in beverages that reduce liver fattening and in animal feed to ensure proper nutrition.
Consumer awareness of healthy food consumption and attention to protein, carbohydrate, and fat consumption is leading to an increase in buckwheat seed consumption today. This, in turn, leads to better business profits for manufacturers.
According to WHO (World Health Organization), 31% of all death all over the world is caused by cardiovascular disease. Since consumers have a high risk of cardiovascular disease, they are increasing their intake of low-fat foods. Consumers are also choosing food items such as buckwheat seed - a healthy food source containing fiber, complex carbohydrates, and less fat.
Increasing demand for buckwheat seeds has been experienced by cosmetic and personal care manufacturers since a variety of factors such as advancing age, improper diet, and environmental factors like pollution and rising temperature increase the risk of skin and hair problems facing consumers, resulting in high profitability for manufacturers of buckwheat seed.
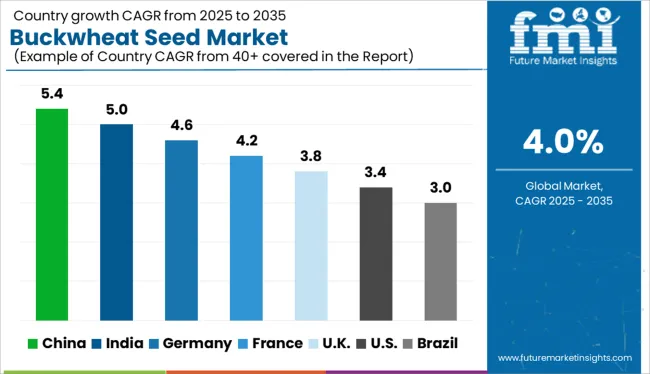
The Asia Pacific region currently holds the largest market share for buckwheat seeds, and this position is forecast to persist throughout the forecast period. The rapidly expanding agricultural industry, increasing awareness regarding the health benefits of buckwheat seeds, as well as the expanding area under horticultural crops are driving the buckwheat seed market strongly. China and India are among the key countries in the Asia Pacific region that report high levels of buckwheat seed production and consumption.
There are many factors that help to make China a leading market in the world, and these factors support the regional dominance of the global buckwheat seed market. The European market will have considerable demand due to rapid advancements in breeding technologies that result in high-quality seeds for vegetable plantings.
Market growth is forecasted for the foreseeable future in the North American market, as buckwheat seeds are high in demand in the USA, Canada, and Mexico.
Furthermore, hybrid seeds of tomato, lettuce, and sweet pepper are growing in popularity in the country, providing additional fuel to the market.
The increasing area under agricultural crops in the Middle East & Africa is contributing to the growth of the buckwheat seed market. An increase in middle-class populations in Africa also contributes to the expansion of the market. Turkey is a key market for buckwheat seeds in the region, with high demand both locally and abroad.
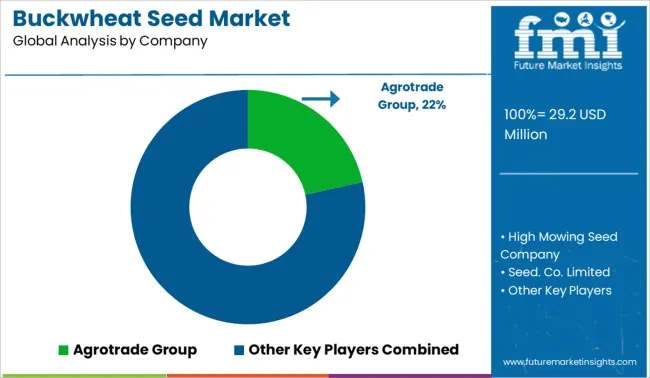
Some of the leading companies operating in the global buckwheat seed market include Agrotrade Group, High Mowing Seed Company, Seed Co. Limited, Kaveri Seed Company Limited, Pioneer Hi-Bred International, Inc., AB Company Seeds Ltd., Kingherbs Limited, Qingdao Sunrise Biotechnology Co., Ltd., Gansu Zhanhua Import & Export Co., Ltd. Ningxia Original Crops Co., Limited and others.
Companies in this field could bribe consumers by providing them with complimentary items with the product. They could even open up their own factory outlet in order to directly reach consumers. Manufacturers could also offer attractive discounts and offers on buckwheat seeds to attract consumers, thus enriching their business profits, therefore propelling the growth of the buckwheat seed market.
In addition to being used in animal feed for proper nutrition, buckwheat seed is also used in making weight loss supplements. These are all uses of buckwheat seed predicted to drive the growth of the buckwheat seed market over the forecast period thanks to the diversified End Users of buckwheat seed. Due to consumers' awareness of healthy foods and their increased awareness of protein, carbohydrate, and fat consumption, buckwheat seed consumption is increasing today. This leads to better business profits for the manufacturers, creating opportunities for the growth of the buckwheat seed market.
Report Attribute | Details |
---|---|
Growth Rate | CAGR of 4.0% from 2022 to 2032 |
Base Year for Estimation | 2021 |
Historical Data | 2015 to 2021 |
Forecast Period | 2022 to 2032 |
Quantitative Units | Revenue in USD Billion, Volume in Kilotons, and CAGR from 2022 to 2032 |
Report Coverage | Revenue Forecast, Volume Forecast, Company Ranking, Competitive Landscape, Growth Factors, Trends, and Pricing Analysis |
Segments Covered | Type of Source, By Type, End User, Distribution Channels |
Regions Covered | North America; Latin America; Europe; East Asia; South Asia; Oceania; Middle East and Africa |
Key Countries Profiled | USA, Canada, Brazil, Mexico, Germany, United Kingdom, France, Spain, Italy, Russia, Poland, Australia, New Zealand, China, India, Japan, South Korea, Thailand, Malaysia, Vietnam, Indonesia, GCC Countries, Turkey, South Africa, North Africa |
Key Companies Profiled | Agrotrade Group; High Mowing Seed Company; Seed. Co. Limited; Kaveri Seed Company Limited; Pioneer Hi-Bred International, Inc.; AB Company Seeds Ltd; Kingherbs Limited; Qingdao Sunrise Biotechnology Co., Ltd.; Gansu Zhanhua Import & Export Co., Ltd.; Ningxia Original Crops Co., Limited; Others. |
Customization | Available Upon Request |
Table 01: Global Market Volume (Units), by Source, 2017 to 2032
Table 02: Global Market Value (US$ Thousand), by Source, 2017 to 2032
Table 03: Global Market Volume (Units), by Type, 2017 to 2032
Table 04: Global Market Value (US$ Thousand), by Type, 2017 to 2032
Table 05: Global Market Volume (Units), by End User, 2017 to 2032
Table 06: Global Market Value (US$ Thousand), by End User, 2017 to 2032
Table 07: Global Market Volume (Units), by Distribution Channel, 2017 to 2032
Table 08: Global Market Value (US$ Thousand), by Distribution Channel, 2017 to 2032
Table 09: Global Market Volume (Units), by Region, 2017 to 2032
Table 10: Global Market Value (US$ Thousand), by Region, 2017 to 2032
Table 11: North America Market Volume (Units), by Source, 2017 to 2032
Table 12: North America Market Value (US$ Thousand), by Source, 2017 to 2032
Table 13: North America Market Volume (Units), by Type, 2017 to 2032
Table 14: North America Market Value (US$ Thousand), by Type, 2017 to 2032
Table 15: North America Market Volume (Units), by End User, 2017 to 2032
Table 16: North America Market Value (US$ Thousand), by End User, 2017 to 2032
Table 17: North America Market Volume (Units), by Distribution Channel, 2017 to 2032
Table 18: North America Market Value (US$ Thousand), by Distribution Channel, 2017 to 2032
Table 19: North America Market Volume (Units), by Country, 2017 to 2032
Table 20: North America Market Value (US$ Thousand), by Country, 2017 to 2032
Table 21: Europe Market Volume (Units), by Source, 2017 to 2032
Table 22: Europe Market Value (US$ Thousand), by Source, 2017 to 2032
Table 23: Europe Market Volume (Units), by Type, 2017 to 2032
Table 24: Europe Market Value (US$ Thousand), by Type, 2017 to 2032
Table 25: Europe Market Volume (Units), by End User, 2017 to 2032
Table 26: Europe Market Value (US$ Thousand), by End User, 2017 to 2032
Table 27: Europe Market Volume (Units), by Distribution Channel, 2017 to 2032
Table 28: Europe Market Value (US$ Thousand), by Distribution Channel, 2017 to 2032
Table 29: Europe Market Volume (Units), by Country, 2017 to 2032
Table 30: Europe Market Value (US$ Thousand), by Country, 2017 to 2032
Table 31: East Asia Market Volume (Units), by Source, 2017 to 2032
Table 32: East Asia Market Value (US$ Thousand), by Source, 2017 to 2032
Table 33: East Asia Market Volume (Units), by Type, 2017 to 2032
Table 34: East Asia Market Value (US$ Thousand), by Type, 2017 to 2032
Table 35: East Asia Market Volume (Units), by End User, 2017 to 2032
Table 36: East Asia Market Value (US$ Thousand), by End User, 2017 to 2032
Table 37: East Asia Market Volume (Units), by Distribution Channel, 2017 to 2032
Table 38: East Asia Market Value (US$ Thousand), by Distribution Channel, 2017 to 2032
Table 39: East Asia Market Volume (Units), by Country, 2017 to 2032
Table 40: East Asia Market Value (US$ Thousand), by Country, 2017 to 2032
Table 41: South Asia Market Volume (Units), by Source, 2017 to 2032
Table 42: South Asia Market Value (US$ Thousand), by Source, 2017 to 2032
Table 43: South Asia Market Volume (Units), by Type, 2017 to 2032
Table 44: South Asia Market Value (US$ Thousand), by Type, 2017 to 2032
Table 45: South Asia Market Volume (Units), by End User, 2017 to 2032
Table 46: South Asia Market Value (US$ Thousand), by End User, 2017 to 2032
Table 47: South Asia Market Volume (Units), by Distribution Channel, 2017 to 2032
Table 48: South Asia Market Value (US$ Thousand), by Distribution Channel, 2017 to 2032
Table 49: South Asia Market Volume (Units), by Country, 2017 to 2032
Table 50: South Asia Market Value (US$ Thousand), by Country, 2017 to 2032
Table 51: Latin America Market Volume (Units), by Source, 2017 to 2032
Table 52: Latin America Market Value (US$ Thousand), by Source, 2017 to 2032
Table 53: Latin America Market Volume (Units), by Type, 2017 to 2032
Table 54: Latin America Market Value (US$ Thousand), by Type, 2017 to 2032
Table 55: Latin America Market Volume (Units), by End User, 2017 to 2032
Table 56: Latin America Market Value (US$ Thousand), by End User, 2017 to 2032
Table 57: Latin America Market Volume (Units), by Distribution Channel, 2017 to 2032
Table 58: Latin America Market Value (US$ Thousand), by Distribution Channel, 2017 to 2032
Table 59: Latin America Market Volume (Units), by Country, 2017 to 2032
Table 60: Latin America Market Value (US$ Thousand), by Country, 2017 to 2032
Table 61: Middle East and Africa Market Volume (Units), by Source, 2017 to 2032
Table 62: Middle East and Africa Market Value (US$ Thousand), by Source, 2017 to 2032
Table 63: Middle East and Africa Market Volume (Units), by Type, 2017 to 2032
Table 64: Middle East and Africa Market Value (US$ Thousand), by Type, 2017 to 2032
Table 65: Middle East and Africa Market Volume (Units), by End User, 2017 to 2032
Table 66: Middle East and Africa Market Value (US$ Thousand), by End User, 2017 to 2032
Table 67: Middle East and Africa Market Volume (Units), by Distribution Channel, 2017 to 2032
Table 68: Middle East and Africa Market Value (US$ Thousand), by Distribution Channel, 2017 to 2032
Table 69: Middle East and Africa Market Volume (Units), by Country, 2017 to 2032
Table 70: Middle East and Africa Market Value (US$ Thousand), by Country, 2017 to 2032
Table 71: Oceania Market Volume (Units), by Source, 2017 to 2032
Table 72: Oceania Market Value (US$ Thousand), by Source, 2017 to 2032
Table 73: Oceania Market Volume (Units), by Type, 2017 to 2032
Table 74: Oceania Market Value (US$ Thousand), by Type, 2017 to 2032
Table 75: Oceania Market Volume (Units), by End User, 2017 to 2032
Table 76: Oceania Market Value (US$ Thousand), by End User, 2017 to 2032
Table 77: Oceania Market Volume (Units), by Distribution Channel, 2017 to 2032
Table 78: Oceania Market Value (US$ Thousand), by Distribution Channel, 2017 to 2032
Table 79: Oceania Market Volume (Units), by Country, 2017 to 2032
Table 80: Oceania Market Value (US$ Thousand), by Country, 2017 to 2032
Figure 01: Global Market Volume (Units), Value (US$ Thousand), and Y-o-Y Growth, 2017 to 2032
Figure 02: Global Absolute $ Historical Market (2017 to 2021) and Absolute $ Opportunity (2022 to 2032), US$ Thousand.
Figure 03: Global Absolute Historical Volume Market (2017 to 2021) and Absolute Volume Opportunity (2022 to 2032), Units
Figure 04: Global Market Value Y-o-Y Growth and Forecast, 2017 to 2032
Figure 05: Global Market Incremental $ Opportunity (US$ Thousand), 2022 to 2032
Figure 06: Global Market Share, By Source – 2022 to 2032
Figure 07: Global Market Y-o-Y Growth Projections, By Source – 2022 to 2032
Figure 08: Global Market Attractiveness Index, By Source – 2022 to 2032
Figure 09: Global Market Share, By Type – 2022 to 2032
Figure 10: Global Market Y-o-Y Growth Projections, By Type - 2022 to 2032
Figure 11: Global Market Attractiveness Index, By Type – 2022 to 2032
Figure 12: Global Market Share, By End User – 2022 to 2032
Figure 13: Global Market Y-o-Y Growth Projections, By End User – 2022 to 2032
Figure 14: Global Market Attractiveness Index, By End User – 2022 to 2032
Figure 15: Global Market Share, By Distribution Channel – 2022 to 2032
Figure 16: Global Market Y-o-Y Growth Projections, By Distribution Channel – 2022 to 2032
Figure 17: Global Market Attractiveness Index, By Distribution Channel – 2022 to 2032
Figure 18: Global Market Share, by Region – 2022 to 2032
Figure 19: Global Market Y-o-Y Growth Projections, by Region – 2022 to 2032
Figure 20: Global Market Attractiveness Index, by Region – 2022 to 2032
Figure 21: North America Market Value (US$ Thousand), Volume (Units) Forecast and Analysis, 2017 to 2032
Figure 22: Y-o-Y Growth Comparison of Market: North America Vs North America Countries Vs North America Average
Figure 23: North America Market Share, By Source – 2022 to 2032
Figure 24: North America Market Y-o-Y Growth Projections, By Source – 2022 to 2032
Figure 25: North America Market Attractiveness Index, By Source – 2022 to 2032
Figure 26: North America Market Share, By Type – 2022 to 2032
Figure 27: North America Market Y-o-Y Growth Projections, By Type – 2022 to 2032
Figure 28: North America Market Attractiveness Index, By Type – 2022 to 2032
Figure 29: North America Market Share, By End User – 2022 to 2032
Figure 30: North America Market Y-o-Y Growth Projections, By End User – 2022 to 2032
Figure 31: North America Market Attractiveness Index, By End User – 2022 to 2032
Figure 32: North America Market Share, By Distribution Channel – 2022 to 2032
Figure 33: North America Market Y-o-Y Growth Projections, By Distribution Channel – 2022 to 2032
Figure 34: North America Market Attractiveness Index, By Distribution Channel – 2022 to 2032
Figure 35: North America Market Share, By Country – 2022 to 2032
Figure 36: North America Market Y-o-Y Growth Projections, By Country – 2022 to 2032
Figure 37: North America Market Attractiveness Index, By Country – 2022 to 2032
Figure 38: Europe Market Value (US$ Thousand), Volume (Units) Forecast and Analysis, 2017 to 2032
Figure 39: Y-o-Y Growth Comparison of Market: Europe Vs Europe Countries Vs Europe Average
Figure 40: Europe Market Share, By Source – 2022 to 2032
Figure 41: Europe Market Y-o-Y Growth Projections, By Source – 2022 to 2032
Figure 42: Europe Market Attractiveness Index, By Source – 2022 to 2032
Figure 43: Europe Market Share, By Type – 2022 to 2032
Figure 44: Europe Market Y-o-Y Growth Projections, By Type – 2022 to 2032
Figure 45: Europe Market Attractiveness Index, By Type – 2022 to 2032
Figure 46: Europe Market Share, By End User – 2022 to 2032
Figure 47: Europe Market Y-o-Y Growth Projections, By End User – 2022 to 2032
Figure 48: Europe Market Attractiveness Index, By End User – 2022 to 2032
Figure 49: Europe Market Share, By Distribution Channel – 2022 to 2032
Figure 50: Europe Market Y-o-Y Growth Projections, By Distribution Channel – 2022 to 2032
Figure 51: Europe Market Attractiveness Index, By Distribution Channel – 2022 to 2032
Figure 52: Europe Market Share, By Country – 2022 to 2032
Figure 53: Europe Market Y-o-Y Growth Projections, By Country – 2022 to 2032
Figure 54: Europe Market Attractiveness Index, By Country – 2022 to 2032
Figure 55: East Asia Market Value (US$ Thousand), Volume (Units) Forecast and Analysis, 2017 to 2032
Figure 56: Y-o-Y Growth Comparison of Market: East Asia Vs East Asia Countries Vs East Asia Average
Figure 57: East Asia Market Share, By Source – 2022 to 2032
Figure 58: East Asia Market Y-o-Y Growth Projections, By Source – 2022 to 2032
Figure 59: East Asia Market Attractiveness Index, By Source – 2022 to 2032
Figure 60: East Asia Market Share, By Type – 2022 to 2032
Figure 61: East Asia Market Y-o-Y Growth Projections, By Type – 2022 to 2032
Figure 62: East Asia Market Attractiveness Index, By Type – 2022 to 2032
Figure 63: East Asia Market Share, By End User – 2022 to 2032
Figure 64: East Asia Market Y-o-Y Growth Projections, By End User – 2022 to 2032
Figure 65: East Asia Market Attractiveness Index, By End User – 2022 to 2032
Figure 66: East Asia Market Share, By Distribution Channel – 2022 to 2032
Figure 67: East Asia Market Y-o-Y Growth Projections, By Distribution Channel – 2022 to 2032
Figure 68: East Asia Market Attractiveness Index, By Distribution Channel – 2022 to 2032
Figure 69: East Asia Market Share, By Country – 2022 to 2032
Figure 70: East Asia Market Y-o-Y Growth Projections, By Country – 2022 to 2032
Figure 71: East Asia Market Attractiveness Index, By Country – 2022 to 2032
Figure 72: South Asia Market Value (US$ Thousand), Volume (Units) Forecast and Analysis, 2017 to 2032
Figure 73: Y-o-Y Growth Comparison of Market: South Asia Vs South Asia Countries Vs South Asia Average
Figure 74: South Asia Market Share, By Source – 2022 to 2032
Figure 75: South Asia Market Y-o-Y Growth Projections, By Source – 2022 to 2032
Figure 76: South Asia Market Attractiveness Index, By Source – 2022 to 2032
Figure 77: South Asia Market Share, By Type – 2022 to 2032
Figure 78: South Asia Market Y-o-Y Growth Projections, By Type – 2022 to 2032
Figure 79: South Asia Market Attractiveness Index, By Type – 2022 to 2032
Figure 80: South Asia Market Share, By End User – 2022 to 2032
Figure 81: South Asia Market Y-o-Y Growth Projections, By End User – 2022 to 2032
Figure 82: South Asia Market Attractiveness Index, By End User – 2022 to 2032
Figure 83: South Asia Market Share, By Distribution Channel – 2022 to 2032
Figure 84: South Asia Market Y-o-Y Growth Projections, By Distribution Channel – 2022 to 2032
Figure 85: South Asia Market Attractiveness Index, By Distribution Channel – 2022 to 2032
Figure 86: South Asia Market Share, By Country – 2022 to 2032
Figure 87: South Asia Market Y-o-Y Growth Projections, By Country – 2022 to 2032
Figure 88: South Asia Market Attractiveness Index, By Country – 2022 to 2032
Figure 89: Latin America Market Value (US$ Thousand), Volume (Units) Forecast and Analysis, 2017 to 2032
Figure 90: Y-o-Y Growth Comparison of Market: Latin America Vs Latin America Countries Vs Latin America Average
Figure 91: Latin America Market Share, By Source – 2022 to 2032
Figure 92: Latin America Market Y-o-Y Growth Projections, By Source – 2022 to 2032
Figure 93: Latin America Market Attractiveness Index, By Source – 2022 to 2032
Figure 94: Latin America Market Share, By Type – 2022 to 2032
Figure 95: Latin America Market Y-o-Y Growth Projections, By Type – 2022 to 2032
Figure 96: Latin America Market Attractiveness Index, By Type – 2022 to 2032
Figure 97: Latin America Market Share, By End User – 2022 to 2032
Figure 98: Latin America Market Y-o-Y Growth Projections, By End User – 2022 to 2032
Figure 99: Latin America Market Attractiveness Index, By End User – 2022 to 2032
Figure 100: Latin America Market Share, By Distribution Channel – 2022 to 2032
Figure 101: Latin America Market Y-o-Y Growth Projections, By Distribution Channel – 2022 to 2032
Figure 102: Latin America Market Attractiveness Index, By Distribution Channel – 2022 to 2032
Figure 103: Latin America Market Share, By Country – 2022 to 2032
Figure 104: Latin America Market Y-o-Y Growth Projections, By Country – 2022 to 2032
Figure 105: Latin America Market Attractiveness Index, By Country – 2022 to 2032
Figure 106: MEA Market Value (US$ Thousand), Volume (Units) Forecast and Analysis, 2017 to 2032
Figure 107: Y-o-Y Growth Comparison of Market: MEA Vs MEA Countries Vs MEA Average
Figure 108: MEA Market Share, By Source – 2022 to 2032
Figure 109: MEA Market Y-o-Y Growth Projections, By Source – 2022 to 2032
Figure 110: MEA Market Attractiveness Index, By Source – 2022 to 2032
Figure 111: MEA Market Share, By Type – 2022 to 2032
Figure 112: MEA Market Y-o-Y Growth Projections, By Type – 2022 to 2032
Figure 113: MEA Market Attractiveness Index, By Type – 2022 to 2032
Figure 114: MEA Market Share, By End User – 2022 to 2032
Figure 115: MEA Market Y-o-Y Growth Projections, By End User – 2022 to 2032
Figure 116: MEA Market Attractiveness Index, By End User – 2022 to 2032
Figure 117: MEA Market Share, By Distribution Channel – 2022 to 2032
Figure 118: MEA Market Y-o-Y Growth Projections, By Distribution Channel – 2022 to 2032
Figure 119: MEA Market Attractiveness Index, By Distribution Channel – 2022 to 2032
Figure 120: MEA Market Share, By Country – 2022 to 2032
Figure 121: MEA Market Y-o-Y Growth Projections, By Country – 2022 to 2032
Figure 122: MEA Market Attractiveness Index, By Country – 2022 to 2032
Figure 123: Oceania Market Value (US$ Thousand), Volume (Units) Forecast and Analysis, 2017 to 2032
Figure 124: Y-o-Y Growth Comparison of Market: Oceania Vs Oceania Countries Vs Oceania Average
Figure 125: Oceania Market Share, By Source – 2022 to 2032
Figure 126: Oceania Market Y-o-Y Growth Projections, By Source – 2022 to 2032
Figure 127: Oceania Market Attractiveness Index, By Source – 2022 to 2032
Figure 128: Oceania Market Share, By Type – 2022 to 2032
Figure 129: Oceania Market Y-o-Y Growth Projections, By Type – 2022 to 2032
Figure 130: Oceania Market Attractiveness Index, By Type – 2022 to 2032
Figure 131: Oceania Market Share, By End User – 2022 to 2032
Figure 132: Oceania Market Y-o-Y Growth Projections, By End User – 2022 to 2032
Figure 133: Oceania Market Attractiveness Index, By End User – 2022 to 2032
Figure 134: Oceania Market Share, By Distribution Channel – 2022 to 2032
Figure 135: Oceania Market Y-o-Y Growth Projections, By Distribution Channel – 2022 to 2032
Figure 136: Oceania Market Attractiveness Index, By Distribution Channel – 2022 to 2032
Figure 137: Oceania Market Share, By Country – 2022 to 2032
Figure 138: Oceania Market Y-o-Y Growth Projections, By Country – 2022 to 2032
Figure 139: Oceania Market Attractiveness Index, By Country – 2022 to 2032
Figure 140: United States Market share by Source, 2021
Figure 141: United States Market share by Type, 2021
Figure 142: United States Market Value (US$ Thousand) and Forecast 2022 to 2032
Figure 143: United States Market Share by Distribution Channel, 2021
Figure 144: Canada Market share by Source, 2021
Figure 145: Canada Market share by Type, 2021
Figure 146: Canada Market Value (US$ Thousand) and Forecast 2022 to 2032
Figure 147: Canada Market Share by Distribution Channel, 2021
Figure 148: Germany Market share by Source, 2021
Figure 149: Germany Market share by Type, 2021
Figure 150: Germany Market Value (US$ Thousand) and Forecast 2022 to 2032
Figure 151: Germany Market Share by Distribution Channel, 2021
Figure 152: United Kingdom Market share by Source, 2021
Figure 153: United Kingdom Market share by Type, 2021
Figure 154: United Kingdom Market Value (US$ Thousand) and Forecast 2022 to 2032
Figure 155: United Kingdom Market Share by Distribution Channel, 2021
Figure 156: France Market share by Source, 2021
Figure 157: France Market share by Type, 2021
Figure 158: France Market Value (US$ Thousand) and Forecast 2022 to 2032
Figure 159: France Market Share by Distribution Channel, 2021
Figure 160: Russia Market share by Source, 2021
Figure 161: Russia Market share by Type, 2021
Figure 162: Russia Market Value (US$ Thousand) and Forecast 2022 to 2032
Figure 163: Russia Market Share by Distribution Channel, 2021
Figure 164: Spain Market share by Source, 2021
Figure 165: Spain Market share by Type, 2021
Figure 166: Spain Market Value (US$ Thousand) and Forecast 2022 to 2032
Figure 167: Spain Market Share by Distribution Channel, 2021
Figure 168: Italy Market share by Source, 2021
Figure 169: Italy Market share by Type, 2021
Figure 170: Italy Market Value (US$ Thousand) and Forecast 2022 to 2032
Figure 171: Italy Market Share by Distribution Channel, 2021
Figure 172: China Market share by Source, 2021
Figure 173: China Market share by Type, 2021
Figure 174: China Market Value (US$ Thousand) and Forecast 2022 to 2032
Figure 175: China Market Share by Distribution Channel, 2021
Figure 176: Japan Market share by Source, 2021
Figure 177: Japan Market share by Type, 2021
Figure 178: Japan Market Value (US$ Thousand) and Forecast 2022 to 2032
Figure 179: Japan Market Share by Distribution Channel, 2021
Figure 180: South Korea Market share by Source, 2021
Figure 181: South Korea Market share by Type, 2021
Figure 182: South Korea Market Value (US$ Thousand) and Forecast 2022 to 2032
Figure 183: South Korea Market Share by Distribution Channel, 2021
Figure 184: India Market share by Source, 2021
Figure 185: India Market share by Type, 2021
Figure 186: India Market Value (US$ Thousand) and Forecast 2022 to 2032
Figure 187: India Market Share by Distribution Channel, 2021
Figure 188: Singapore Market share by Source, 2021
Figure 189: Singapore Market share by Type, 2021
Figure 190: Singapore Market Value (US$ Thousand) and Forecast 2022 to 2032
Figure 191: Singapore Market Share by Distribution Channel, 2021
Figure 192: Indonesia Market share by Source, 2021
Figure 193: Indonesia Market share by Type, 2021
Figure 194: Indonesia Market Value (US$ Thousand) and Forecast 2022 to 2032
Figure 195: Indonesia Market Share by Distribution Channel, 2021
Figure 196: Thailand Market share by Source, 2021
Figure 197: Thailand Market share by Type, 2021
Figure 198: Thailand Market Value (US$ Thousand) and Forecast 2022 to 2032
Figure 199: Thailand Market Share by Distribution Channel, 2021
Figure 200: Brazil Market share by Source, 2021
Figure 201: Brazil Market share by Type, 2021
Figure 202: Brazil Market Value (US$ Thousand) and Forecast 2022 to 2032
Figure 203: Brazil Market Share by Distribution Channel, 2021
Figure 204: Mexico Market share by Source, 2021
Figure 205: Mexico Market share by Type, 2021
Figure 206: Mexico Market Value (US$ Thousand) and Forecast 2022 to 2032
Figure 207: Mexico Market Share by Distribution Channel, 2021
Figure 208: Turkey Market share by Source, 2021
Figure 209: Turkey Market share by Type, 2021
Figure 210: Turkey Market Value (US$ Thousand) and Forecast 2022 to 2032
Figure 211: Turkey Market Share by Distribution Channel, 2021
Figure 212: GCC Countries Market share by Source, 2021
Figure 213: GCC Countries Market share by Type, 2021
Figure 214: GCC Countries Market Value (US$ Thousand) and Forecast 2022 to 2032
Figure 215: GCC Countries Market Share by Distribution Channel, 2021
Figure 216: South Africa Market share by Source, 2021
Figure 217: South Africa Market share by Type, 2021
Figure 218: South Africa Market Value (US$ Thousand) and Forecast 2022 to 2032
Figure 219: South Africa Market Share by Distribution Channel, 2021
Figure 220: Australia Market share by Source, 2021
Figure 221: Australia Market share by Type, 2021
Figure 222: Australia Market Value (US$ Thousand) and Forecast 2022 to 2032
Figure 223: Australia Market Share by Distribution Channel, 2021
Figure 224: New Zealand Market share by Source, 2021
Figure 225: New Zealand Market share by Type, 2021
Figure 226: New Zealand Market Value (US$ Thousand) and Forecast 2022 to 2032
Figure 227: New Zealand Market Share by Distribution Channel, 2021
The global buckwheat seed market is set to exceed USD 38.42 Million in 2032.
The USA is projected to lead the buckwheat seed market during the forecast period.
Agrotrade Group, High Mowing Seed Company, Seed Co. Limited, and others are some of the renowned companies in the buckwheat seed market.
Explore Similar Insights
Thank you!
You will receive an email from our Business Development Manager. Please be sure to check your SPAM/JUNK folder too.