The market is expected to increase from USD 4,656.9 Million in 2025 to USD 7,513.8 Million in 2035, at a CAGR of 4.9% in the forecasted period. Rising focus on clean drinking water, public hygiene and infection control especially in emerging economies is driving demand. Strict regulatory norms that require the treatment of water in industrial processes are driving growth in the commercial segment.
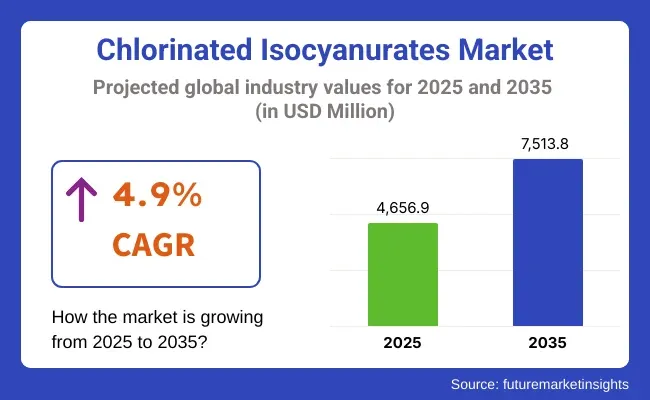
Chlorinated Isocyanurates Market, by Application (Disinfectant companies, Municipal facilities, etc.)The chlorinated isocyanuratesMarket is forecasted to present steady growth from 2025 to 2035 due to increasing demand for disinfection and sanitation for residential, industrial, and municipal applications.
Sodium dichloroisocyanurate (NaDCC) and its derivatives, as well as trichloroisocyanuric acid (TCCA), are the most common representatives of chlorine-based disinfectants based on chlorinated isocyanurates for water treatment, swimming pools, household cleaning, and food processing purposes. Due to their stability, high available chlorine content, extended shelf life and ease of handling, they are preferred over liquid chlorine products.
Chloroisocyanuric function very well as disinfecting agent as well as TCCA is characterized by higher chlorine content and suitability in diverse settings pertaining to water purification and sanitation purpose, which makes it the leading segment in chlorinated isocyanurates market.
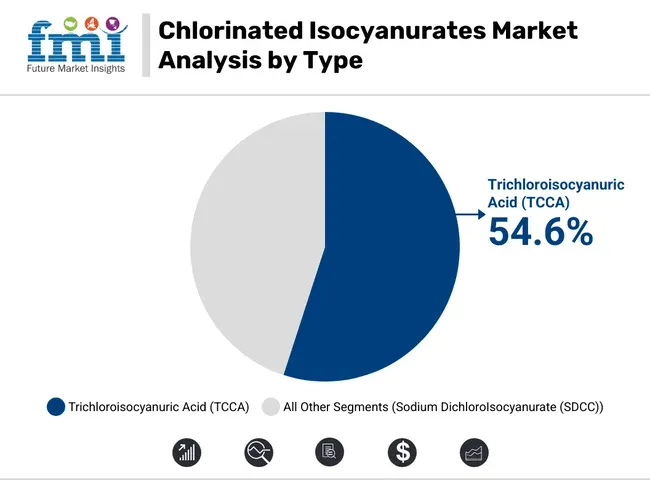
Due to its effective performance in maintaining the internal waters of a vessel and eradicating bacteria, algae, and other microorganisms, TCCA is extensively used in industrial and municipal sectors. It also offers stable and long-lasting release of chlorine, which makes it suitable for swimming pools, cooling towers and drinking water treatment.
TCCA is preferred by manufacturers due to its cost-effectiveness as well as convenience of storage and transport. Additionally, storage loss of chlorine for this highly stable compound is low, making it a flexible disinfectant for differing environmental circumstances. Its use in cleaning of irrigation systems, disinfection of the equipment, and as a key part of the process of killing free floating algae also bolsters its demand in agricultural settings.
Increasing importance of public hygiene, especially in the underdeveloped nations, is benefitting the overall market, and so is the increasing number of recreational water facilities. Such mounting recommendations come from the regulatory authorities and health departments for large-scale sanitation use of TCCA-based products, which is expected to bolster the market significantly for TCCA-based products.
Regarding application, disinfectants hold the largest share in the chlorinated isocyanurates market due to the growing emphasis on hygiene, sanitation, and infection control worldwide. Chlorinated isocyanurates, especially in granular or tablet form, can be utilized as excellent disinfectants for surfaces, water, and industrial equipment. They are indispensable in sectors like healthcare, hospitality, municipal water treatment, and food processing because of their broad-spectrum antimicrobial action.
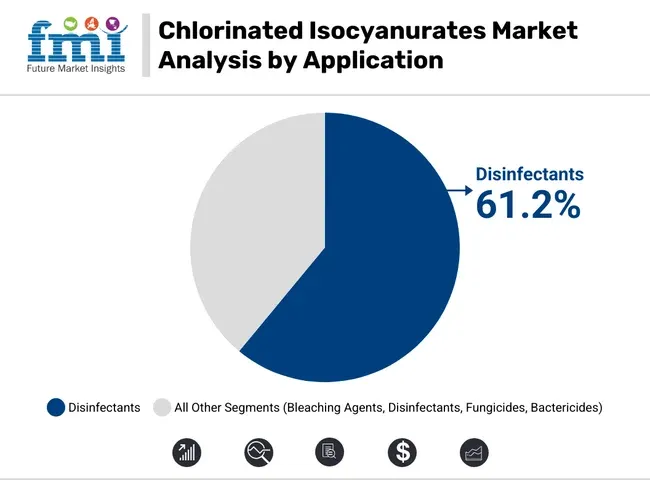
Facilities use chlorinated isocyanurates-based disinfectants to control outbreaks of bacterial and viral infections. These compounds are fast-acting at killing harmful microorganisms such as E. coli, salmonella and noroviruses, with no toxic residues. These disinfectants are used by public institutions like schools, offices and public transport areas for maintaining cleanliness standards.
Chlorinated isocyanurate-based disinfectants are also used in increased scale by consumers for home use like pool maintenance, bathroom sanitation and surface cleaning. Increasing awareness about personal hygiene and public safety, especially in the wake of global health crisis has translated into strong growth of disinfectant marketplace.
Innovative efforts by chemical manufacturers are focused on improving the safety profile and efficacy of chlorinated isocyanurate-derived disinfectant formulations. They specialize in the formulation of non-corrosive, fast-dissolving formulations that are easy to use, comply with relevant safety standards, and can be used on many different surfaces and in countless environments.
Environmental and Health Concerns Related to Chlorine By-products
The generation of trihalomethanes and haloacetic acids which are disinfection by-products (DBPs) which formed as a result of chlorine reacting with any organic material in the water, also leads to health concerns which is expected to hinder market growth significantly.
To meet these regulations, manufacturers and end users are legitimating monitoring and improved control of dosage levels for DBPs. Worse off, the misuse and even errant storage of chlorinated isocyanurates also poses fire risks and is a source for toxic emissions an issue for small municipal end-users.
Rising Demand for Water Sanitation in Emerging Economies
In developing markets such as Southeast Asia, Latin America, and Sub-Saharan Africa, the demand for clean drinking water and public hygiene presents a massive opportunity. NaDCC tablets are increasingly being applied in emergency water disinfection and household sanitation programs implemented by governments or NGOs18. Low cost, portable and with long shelf life, this tablets are best fit for rural and disaster-prone areas.
Furthermore, the growing investment in smart cities and industrial infrastructure is driving the growth of the effective and low-maintenance disinfectants. Facilities manufacturing products will compete for custom formulations, safer packaging and sustainable products.
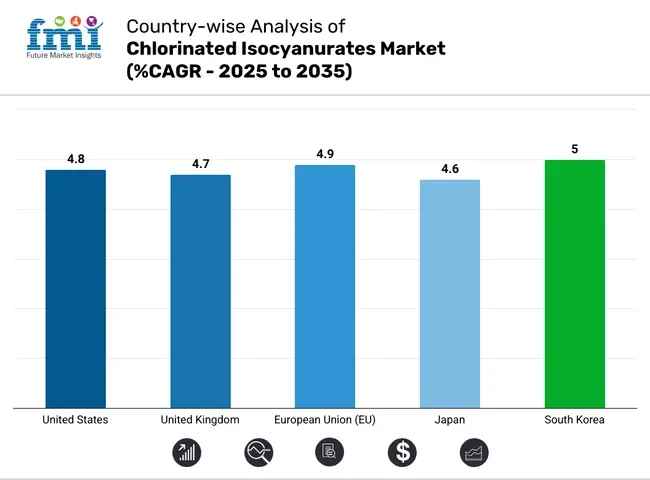
The United States chlorinated isocyanurates market is projected to grow at a CAGR of around 4.8% between 2025 and 2035. This demand is mainly attributed to the increasing usage in swimming pool sanitization and water treatment plants.
As people are paying more attention to public health and hygiene, public drinking water projects in municipalities are using chlorinated isocyanurates because they are efficient and effective disinfectants. With its long shelf-life and stable formulation, the product has become a preferred choice compared to traditional chlorine-based alternatives, particularly in commercial and residential pool applications nationwide.
| Country | CAGR (2025 to 2035) |
|---|---|
| United States | 4.8% |
The United Kingdom chlorinated isocyanurates market is projected to register a CAGR of 4.7% during the forecast period. Increased concerns regarding the safety of potable water and strong hygiene regulations regarding public swimming pools are driving growth.
Moreover, the industrial cleaning segment is inserting chlorinated isocyanurates into disinfecting agents because of the potent biocidal features. The United Kingdom's regulatory focus on efficient water treatment chemicals is also advancing the market.
| Country | CAGR (2025 to 2035) |
|---|---|
| United Kingdom | 4.7% |
The chlorinated isocyanuratess market in the European Union is projected to register a CAGR of 4.9% over the forecast period (2025 to 2035). The region’s commitment to bringing the quality in water supply, particularly in public utilities and recreation centres, recommends dependable usage of chlorine disinfectants.
There is a paradigm shift to sustainable chemical treatments that leave little residue and are safe in key countries such as Germany, France and Italy. In fact, with the growing trend of automated water monitoring systems in the EU indirectly create the demand for more standardized efficient disinfection chemicals.
| Region | CAGR (2025 to 2035) |
|---|---|
| European Union | 4.9% |
Japanese market for chlorinated isocyanurates is projected to grow at a CAGR of 4.6% over the period of 2025 to 2035. The market is being driven by increasing adoption in hygienic-sensitive sectors such as healthcare and food processing, where there is a high need for disinfection of surfaces and equipment. Suppressing the nation’s extremely high self-imposed standards regarding water purification processes and a strong appetite for reliable disinfection performance, chlorinated isocyanurates are a critical link in the treatment chain.
| Country | CAGR (2025 to 2035) |
|---|---|
| Japan | 4.6% |
The South Korea chlorinated isocyanurates market is projected to expand at a CAGR of 5.0% during the forecast period. Projects led by governments which facilitate access to clean water and sanitation in many markets are all contributing to its development.
The product is also growing in use for industrial cooling towers and wastewater disinfection, in addition to its traditional use in swimming pools and drinking water treatment, because of its cost savings and reliability when it comes to microbial control.
| Country | CAGR (2025 to 2035) |
|---|---|
| South Korea | 5.0% |
The Chlorinated Isocyanurates Market is highly competitive with production hubs concentrated in the Asia-Pacific region and increasing demands worldwide for water treatment, cleaning agents and industrial sanitizers. Key players are increasing production capabilities while enhancing their relative cost-effectiveness through vertical integration and process innovation and are capitalizing on growth via exports and renewed penetration in global markets.
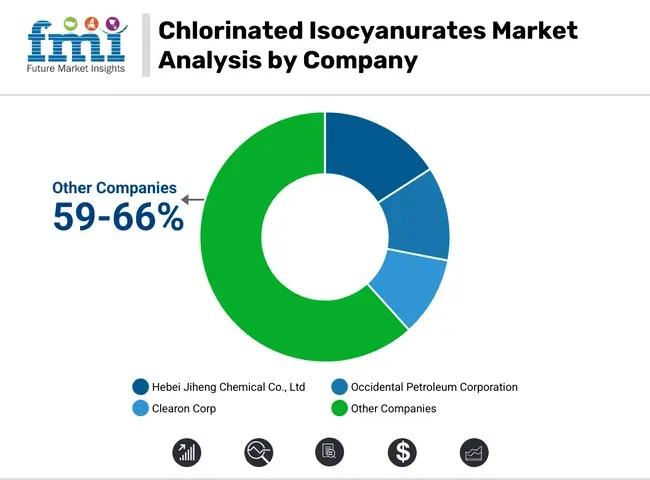
Hebei Jiheng Chemical Co., Ltd (14-17%)
Hebei Jiheng leads the market by leveraging large-scale manufacturing and cost-effective exports. The company focuses on maintaining consistent product quality and competitive pricing, especially for TCCA and SDIC applications in pool sanitation and municipal water treatment.
Occidental Petroleum Corporation (11-13%)
Occidental’s OxyChem division strengthens its position through integration of raw materials and chlorinated chemical expertise. The company focuses on USA domestic demand and maintains robust supply chains with safety-compliant storage and transport systems.
Clearon Corp (9-11%)
Clearon emphasizes high-performance chlorinated isocyanurates for institutional and residential applications. The company targets innovation in disinfection delivery formats such as tablets, powders, and granules, with compliance to USA EPA and global standards.
SHIKOKU CHEMICALS CORPORATION
Shikoku Chemicals invests in R&D to supply high-purity chlorinated compounds suitable for sensitive industries. The company’s strength lies in precise manufacturing standards and a growing focus on Southeast Asian and European specialty chemical markets.
Other Key Players (59-66% Combined)
These companies contribute to the market with varying degrees of regional focus and specialty-grade offerings:
The overall market size for the Chlorinated Isocyanurates Market was USD 4,656.9 Million in 2025.
The Chlorinated Isocyanurates Market is expected to reach USD 7,513.8 Million in 2035.
Increasing demand for disinfection and sanitation for residential, industrial, and municipal applications will drive the demand for the Chlorinated Isocyanurates Market.
The top 5 countries driving market growth are the USA, UK, Europe, Japan and South Korea.
The Disinfectants segment is expected to command a significant share over the assessment period.
Table 1: Global Chlorinated Isocyanurates Market Value (US$ Mn) Forecast by Region, 2017-2032
Table 2: Global Chlorinated Isocyanurates Market Volume (Tons) Forecast by Region, 2017-2032
Table 3: Global Chlorinated Isocyanurates Market Value (US$ Mn) Forecast by Product Type, 2017-2032
Table 4: Global Chlorinated Isocyanurates Market Volume (Tons) Forecast by Product Type, 2017-2032
Table 5: Global Chlorinated Isocyanurates Market Value (US$ Mn) Forecast by Application, 2017-2032
Table 6: Global Chlorinated Isocyanurates Market Volume (Tons) Forecast by Application, 2017-2032
Table 7: North America Chlorinated Isocyanurates Market Value (US$ Mn) Forecast by Country, 2017-2032
Table 8: North America Chlorinated Isocyanurates Market Volume (Tons) Forecast by Country, 2017-2032
Table 9: North America Chlorinated Isocyanurates Market Value (US$ Mn) Forecast by Product Type, 2017-2032
Table 10: North America Chlorinated Isocyanurates Market Volume (Tons) Forecast by Product Type, 2017-2032
Table 11: North America Chlorinated Isocyanurates Market Value (US$ Mn) Forecast by Application, 2017-2032
Table 12: North America Chlorinated Isocyanurates Market Volume (Tons) Forecast by Application, 2017-2032
Table 13: Latin America Chlorinated Isocyanurates Market Value (US$ Mn) Forecast by Country, 2017-2032
Table 14: Latin America Chlorinated Isocyanurates Market Volume (Tons) Forecast by Country, 2017-2032
Table 15: Latin America Chlorinated Isocyanurates Market Value (US$ Mn) Forecast by Product Type, 2017-2032
Table 16: Latin America Chlorinated Isocyanurates Market Volume (Tons) Forecast by Product Type, 2017-2032
Table 17: Latin America Chlorinated Isocyanurates Market Value (US$ Mn) Forecast by Application, 2017-2032
Table 18: Latin America Chlorinated Isocyanurates Market Volume (Tons) Forecast by Application, 2017-2032
Table 19: Europe Chlorinated Isocyanurates Market Value (US$ Mn) Forecast by Country, 2017-2032
Table 20: Europe Chlorinated Isocyanurates Market Volume (Tons) Forecast by Country, 2017-2032
Table 21: Europe Chlorinated Isocyanurates Market Value (US$ Mn) Forecast by Product Type, 2017-2032
Table 22: Europe Chlorinated Isocyanurates Market Volume (Tons) Forecast by Product Type, 2017-2032
Table 23: Europe Chlorinated Isocyanurates Market Value (US$ Mn) Forecast by Application, 2017-2032
Table 24: Europe Chlorinated Isocyanurates Market Volume (Tons) Forecast by Application, 2017-2032
Table 25: East Asia Chlorinated Isocyanurates Market Value (US$ Mn) Forecast by Country, 2017-2032
Table 26: East Asia Chlorinated Isocyanurates Market Volume (Tons) Forecast by Country, 2017-2032
Table 27: East Asia Chlorinated Isocyanurates Market Value (US$ Mn) Forecast by Product Type, 2017-2032
Table 28: East Asia Chlorinated Isocyanurates Market Volume (Tons) Forecast by Product Type, 2017-2032
Table 29: East Asia Chlorinated Isocyanurates Market Value (US$ Mn) Forecast by Application, 2017-2032
Table 30: East Asia Chlorinated Isocyanurates Market Volume (Tons) Forecast by Application, 2017-2032
Table 31: South Asia & Pacific Chlorinated Isocyanurates Market Value (US$ Mn) Forecast by Country, 2017-2032
Table 32: South Asia & Pacific Chlorinated Isocyanurates Market Volume (Tons) Forecast by Country, 2017-2032
Table 33: South Asia & Pacific Chlorinated Isocyanurates Market Value (US$ Mn) Forecast by Product Type, 2017-2032
Table 34: South Asia & Pacific Chlorinated Isocyanurates Market Volume (Tons) Forecast by Product Type, 2017-2032
Table 35: South Asia & Pacific Chlorinated Isocyanurates Market Value (US$ Mn) Forecast by Application, 2017-2032
Table 36: South Asia & Pacific Chlorinated Isocyanurates Market Volume (Tons) Forecast by Application, 2017-2032
Table 37: MEA Chlorinated Isocyanurates Market Value (US$ Mn) Forecast by Country, 2017-2032
Table 38: MEA Chlorinated Isocyanurates Market Volume (Tons) Forecast by Country, 2017-2032
Table 39: MEA Chlorinated Isocyanurates Market Value (US$ Mn) Forecast by Product Type, 2017-2032
Table 40: MEA Chlorinated Isocyanurates Market Volume (Tons) Forecast by Product Type, 2017-2032
Table 41: MEA Chlorinated Isocyanurates Market Value (US$ Mn) Forecast by Application, 2017-2032
Table 42: MEA Chlorinated Isocyanurates Market Volume (Tons) Forecast by Application, 2017-2032
Figure 1: Global Chlorinated Isocyanurates Market Value (US$ Mn) by Product Type, 2022-2032
Figure 2: Global Chlorinated Isocyanurates Market Value (US$ Mn) by Application, 2022-2032
Figure 3: Global Chlorinated Isocyanurates Market Value (US$ Mn) by Region, 2022-2032
Figure 4: Global Chlorinated Isocyanurates Market Value (US$ Mn) Analysis by Region, 2017-2032
Figure 5: Global Chlorinated Isocyanurates Market Volume (Tons) Analysis by Region, 2017-2032
Figure 6: Global Chlorinated Isocyanurates Market Value Share (%) and BPS Analysis by Region, 2022-2032
Figure 7: Global Chlorinated Isocyanurates Market Y-o-Y Growth (%) Projections by Region, 2022-2032
Figure 8: Global Chlorinated Isocyanurates Market Value (US$ Mn) Analysis by Product Type, 2017-2032
Figure 9: Global Chlorinated Isocyanurates Market Volume (Tons) Analysis by Product Type, 2017-2032
Figure 10: Global Chlorinated Isocyanurates Market Value Share (%) and BPS Analysis by Product Type, 2022-2032
Figure 11: Global Chlorinated Isocyanurates Market Y-o-Y Growth (%) Projections by Product Type, 2022-2032
Figure 12: Global Chlorinated Isocyanurates Market Value (US$ Mn) Analysis by Application, 2017-2032
Figure 13: Global Chlorinated Isocyanurates Market Volume (Tons) Analysis by Application, 2017-2032
Figure 14: Global Chlorinated Isocyanurates Market Value Share (%) and BPS Analysis by Application, 2022-2032
Figure 15: Global Chlorinated Isocyanurates Market Y-o-Y Growth (%) Projections by Application, 2022-2032
Figure 16: Global Chlorinated Isocyanurates Market Attractiveness by Product Type, 2022-2032
Figure 17: Global Chlorinated Isocyanurates Market Attractiveness by Application, 2022-2032
Figure 18: Global Chlorinated Isocyanurates Market Attractiveness by Region, 2022-2032
Figure 19: North America Chlorinated Isocyanurates Market Value (US$ Mn) by Product Type, 2022-2032
Figure 20: North America Chlorinated Isocyanurates Market Value (US$ Mn) by Application, 2022-2032
Figure 21: North America Chlorinated Isocyanurates Market Value (US$ Mn) by Country, 2022-2032
Figure 22: North America Chlorinated Isocyanurates Market Value (US$ Mn) Analysis by Country, 2017-2032
Figure 23: North America Chlorinated Isocyanurates Market Volume (Tons) Analysis by Country, 2017-2032
Figure 24: North America Chlorinated Isocyanurates Market Value Share (%) and BPS Analysis by Country, 2022-2032
Figure 25: North America Chlorinated Isocyanurates Market Y-o-Y Growth (%) Projections by Country, 2022-2032
Figure 26: North America Chlorinated Isocyanurates Market Value (US$ Mn) Analysis by Product Type, 2017-2032
Figure 27: North America Chlorinated Isocyanurates Market Volume (Tons) Analysis by Product Type, 2017-2032
Figure 28: North America Chlorinated Isocyanurates Market Value Share (%) and BPS Analysis by Product Type, 2022-2032
Figure 29: North America Chlorinated Isocyanurates Market Y-o-Y Growth (%) Projections by Product Type, 2022-2032
Figure 30: North America Chlorinated Isocyanurates Market Value (US$ Mn) Analysis by Application, 2017-2032
Figure 31: North America Chlorinated Isocyanurates Market Volume (Tons) Analysis by Application, 2017-2032
Figure 32: North America Chlorinated Isocyanurates Market Value Share (%) and BPS Analysis by Application, 2022-2032
Figure 33: North America Chlorinated Isocyanurates Market Y-o-Y Growth (%) Projections by Application, 2022-2032
Figure 34: North America Chlorinated Isocyanurates Market Attractiveness by Product Type, 2022-2032
Figure 35: North America Chlorinated Isocyanurates Market Attractiveness by Application, 2022-2032
Figure 36: North America Chlorinated Isocyanurates Market Attractiveness by Country, 2022-2032
Figure 37: Latin America Chlorinated Isocyanurates Market Value (US$ Mn) by Product Type, 2022-2032
Figure 38: Latin America Chlorinated Isocyanurates Market Value (US$ Mn) by Application, 2022-2032
Figure 39: Latin America Chlorinated Isocyanurates Market Value (US$ Mn) by Country, 2022-2032
Figure 40: Latin America Chlorinated Isocyanurates Market Value (US$ Mn) Analysis by Country, 2017-2032
Figure 41: Latin America Chlorinated Isocyanurates Market Volume (Tons) Analysis by Country, 2017-2032
Figure 42: Latin America Chlorinated Isocyanurates Market Value Share (%) and BPS Analysis by Country, 2022-2032
Figure 43: Latin America Chlorinated Isocyanurates Market Y-o-Y Growth (%) Projections by Country, 2022-2032
Figure 44: Latin America Chlorinated Isocyanurates Market Value (US$ Mn) Analysis by Product Type, 2017-2032
Figure 45: Latin America Chlorinated Isocyanurates Market Volume (Tons) Analysis by Product Type, 2017-2032
Figure 46: Latin America Chlorinated Isocyanurates Market Value Share (%) and BPS Analysis by Product Type, 2022-2032
Figure 47: Latin America Chlorinated Isocyanurates Market Y-o-Y Growth (%) Projections by Product Type, 2022-2032
Figure 48: Latin America Chlorinated Isocyanurates Market Value (US$ Mn) Analysis by Application, 2017-2032
Figure 49: Latin America Chlorinated Isocyanurates Market Volume (Tons) Analysis by Application, 2017-2032
Figure 50: Latin America Chlorinated Isocyanurates Market Value Share (%) and BPS Analysis by Application, 2022-2032
Figure 51: Latin America Chlorinated Isocyanurates Market Y-o-Y Growth (%) Projections by Application, 2022-2032
Figure 52: Latin America Chlorinated Isocyanurates Market Attractiveness by Product Type, 2022-2032
Figure 53: Latin America Chlorinated Isocyanurates Market Attractiveness by Application, 2022-2032
Figure 54: Latin America Chlorinated Isocyanurates Market Attractiveness by Country, 2022-2032
Figure 55: Europe Chlorinated Isocyanurates Market Value (US$ Mn) by Product Type, 2022-2032
Figure 56: Europe Chlorinated Isocyanurates Market Value (US$ Mn) by Application, 2022-2032
Figure 57: Europe Chlorinated Isocyanurates Market Value (US$ Mn) by Country, 2022-2032
Figure 58: Europe Chlorinated Isocyanurates Market Value (US$ Mn) Analysis by Country, 2017-2032
Figure 59: Europe Chlorinated Isocyanurates Market Volume (Tons) Analysis by Country, 2017-2032
Figure 60: Europe Chlorinated Isocyanurates Market Value Share (%) and BPS Analysis by Country, 2022-2032
Figure 61: Europe Chlorinated Isocyanurates Market Y-o-Y Growth (%) Projections by Country, 2022-2032
Figure 62: Europe Chlorinated Isocyanurates Market Value (US$ Mn) Analysis by Product Type, 2017-2032
Figure 63: Europe Chlorinated Isocyanurates Market Volume (Tons) Analysis by Product Type, 2017-2032
Figure 64: Europe Chlorinated Isocyanurates Market Value Share (%) and BPS Analysis by Product Type, 2022-2032
Figure 65: Europe Chlorinated Isocyanurates Market Y-o-Y Growth (%) Projections by Product Type, 2022-2032
Figure 66: Europe Chlorinated Isocyanurates Market Value (US$ Mn) Analysis by Application, 2017-2032
Figure 67: Europe Chlorinated Isocyanurates Market Volume (Tons) Analysis by Application, 2017-2032
Figure 68: Europe Chlorinated Isocyanurates Market Value Share (%) and BPS Analysis by Application, 2022-2032
Figure 69: Europe Chlorinated Isocyanurates Market Y-o-Y Growth (%) Projections by Application, 2022-2032
Figure 70: Europe Chlorinated Isocyanurates Market Attractiveness by Product Type, 2022-2032
Figure 71: Europe Chlorinated Isocyanurates Market Attractiveness by Application, 2022-2032
Figure 72: Europe Chlorinated Isocyanurates Market Attractiveness by Country, 2022-2032
Figure 73: East Asia Chlorinated Isocyanurates Market Value (US$ Mn) by Product Type, 2022-2032
Figure 74: East Asia Chlorinated Isocyanurates Market Value (US$ Mn) by Application, 2022-2032
Figure 75: East Asia Chlorinated Isocyanurates Market Value (US$ Mn) by Country, 2022-2032
Figure 76: East Asia Chlorinated Isocyanurates Market Value (US$ Mn) Analysis by Country, 2017-2032
Figure 77: East Asia Chlorinated Isocyanurates Market Volume (Tons) Analysis by Country, 2017-2032
Figure 78: East Asia Chlorinated Isocyanurates Market Value Share (%) and BPS Analysis by Country, 2022-2032
Figure 79: East Asia Chlorinated Isocyanurates Market Y-o-Y Growth (%) Projections by Country, 2022-2032
Figure 80: East Asia Chlorinated Isocyanurates Market Value (US$ Mn) Analysis by Product Type, 2017-2032
Figure 81: East Asia Chlorinated Isocyanurates Market Volume (Tons) Analysis by Product Type, 2017-2032
Figure 82: East Asia Chlorinated Isocyanurates Market Value Share (%) and BPS Analysis by Product Type, 2022-2032
Figure 83: East Asia Chlorinated Isocyanurates Market Y-o-Y Growth (%) Projections by Product Type, 2022-2032
Figure 84: East Asia Chlorinated Isocyanurates Market Value (US$ Mn) Analysis by Application, 2017-2032
Figure 85: East Asia Chlorinated Isocyanurates Market Volume (Tons) Analysis by Application, 2017-2032
Figure 86: East Asia Chlorinated Isocyanurates Market Value Share (%) and BPS Analysis by Application, 2022-2032
Figure 87: East Asia Chlorinated Isocyanurates Market Y-o-Y Growth (%) Projections by Application, 2022-2032
Figure 88: East Asia Chlorinated Isocyanurates Market Attractiveness by Product Type, 2022-2032
Figure 89: East Asia Chlorinated Isocyanurates Market Attractiveness by Application, 2022-2032
Figure 90: East Asia Chlorinated Isocyanurates Market Attractiveness by Country, 2022-2032
Figure 91: South Asia & Pacific Chlorinated Isocyanurates Market Value (US$ Mn) by Product Type, 2022-2032
Figure 92: South Asia & Pacific Chlorinated Isocyanurates Market Value (US$ Mn) by Application, 2022-2032
Figure 93: South Asia & Pacific Chlorinated Isocyanurates Market Value (US$ Mn) by Country, 2022-2032
Figure 94: South Asia & Pacific Chlorinated Isocyanurates Market Value (US$ Mn) Analysis by Country, 2017-2032
Figure 95: South Asia & Pacific Chlorinated Isocyanurates Market Volume (Tons) Analysis by Country, 2017-2032
Figure 96: South Asia & Pacific Chlorinated Isocyanurates Market Value Share (%) and BPS Analysis by Country, 2022-2032
Figure 97: South Asia & Pacific Chlorinated Isocyanurates Market Y-o-Y Growth (%) Projections by Country, 2022-2032
Figure 98: South Asia & Pacific Chlorinated Isocyanurates Market Value (US$ Mn) Analysis by Product Type, 2017-2032
Figure 99: South Asia & Pacific Chlorinated Isocyanurates Market Volume (Tons) Analysis by Product Type, 2017-2032
Figure 100: South Asia & Pacific Chlorinated Isocyanurates Market Value Share (%) and BPS Analysis by Product Type, 2022-2032
Figure 101: South Asia & Pacific Chlorinated Isocyanurates Market Y-o-Y Growth (%) Projections by Product Type, 2022-2032
Figure 102: South Asia & Pacific Chlorinated Isocyanurates Market Value (US$ Mn) Analysis by Application, 2017-2032
Figure 103: South Asia & Pacific Chlorinated Isocyanurates Market Volume (Tons) Analysis by Application, 2017-2032
Figure 104: South Asia & Pacific Chlorinated Isocyanurates Market Value Share (%) and BPS Analysis by Application, 2022-2032
Figure 105: South Asia & Pacific Chlorinated Isocyanurates Market Y-o-Y Growth (%) Projections by Application, 2022-2032
Figure 106: South Asia & Pacific Chlorinated Isocyanurates Market Attractiveness by Product Type, 2022-2032
Figure 107: South Asia & Pacific Chlorinated Isocyanurates Market Attractiveness by Application, 2022-2032
Figure 108: South Asia & Pacific Chlorinated Isocyanurates Market Attractiveness by Country, 2022-2032
Figure 109: MEA Chlorinated Isocyanurates Market Value (US$ Mn) by Product Type, 2022-2032
Figure 110: MEA Chlorinated Isocyanurates Market Value (US$ Mn) by Application, 2022-2032
Figure 111: MEA Chlorinated Isocyanurates Market Value (US$ Mn) by Country, 2022-2032
Figure 112: MEA Chlorinated Isocyanurates Market Value (US$ Mn) Analysis by Country, 2017-2032
Figure 113: MEA Chlorinated Isocyanurates Market Volume (Tons) Analysis by Country, 2017-2032
Figure 114: MEA Chlorinated Isocyanurates Market Value Share (%) and BPS Analysis by Country, 2022-2032
Figure 115: MEA Chlorinated Isocyanurates Market Y-o-Y Growth (%) Projections by Country, 2022-2032
Figure 116: MEA Chlorinated Isocyanurates Market Value (US$ Mn) Analysis by Product Type, 2017-2032
Figure 117: MEA Chlorinated Isocyanurates Market Volume (Tons) Analysis by Product Type, 2017-2032
Figure 118: MEA Chlorinated Isocyanurates Market Value Share (%) and BPS Analysis by Product Type, 2022-2032
Figure 119: MEA Chlorinated Isocyanurates Market Y-o-Y Growth (%) Projections by Product Type, 2022-2032
Figure 120: MEA Chlorinated Isocyanurates Market Value (US$ Mn) Analysis by Application, 2017-2032
Figure 121: MEA Chlorinated Isocyanurates Market Volume (Tons) Analysis by Application, 2017-2032
Figure 122: MEA Chlorinated Isocyanurates Market Value Share (%) and BPS Analysis by Application, 2022-2032
Figure 123: MEA Chlorinated Isocyanurates Market Y-o-Y Growth (%) Projections by Application, 2022-2032
Figure 124: MEA Chlorinated Isocyanurates Market Attractiveness by Product Type, 2022-2032
Figure 125: MEA Chlorinated Isocyanurates Market Attractiveness by Application, 2022-2032
Figure 126: MEA Chlorinated Isocyanurates Market Attractiveness by Country, 2022-2032


Full Research Suite comprises of:
Market outlook & trends analysis
Interviews & case studies
Strategic recommendations
Vendor profiles & capabilities analysis
5-year forecasts
8 regions and 60+ country-level data splits
Market segment data splits
12 months of continuous data updates
DELIVERED AS:
PDF EXCEL ONLINE
Chlorinated Methane Market Size and Share Forecast Outlook 2025 to 2035
Chlorinated Paraffin Market Size and Share Forecast Outlook 2025 to 2035
Chlorinated Polyethylene Resins and Elastomers (CPE) Market Size, Growth, and Forecast for 2025 to 2035
Chlorinated Polyethylene Market Growth - Trends & Forecast 2024 to 2034

Thank you!
You will receive an email from our Business Development Manager. Please be sure to check your SPAM/JUNK folder too.
Chat With
MaRIA