Reports

- Global Locations -

Headquarters

Future Market Insights, Inc.

Christiana Corporate, 200
Continental Drive, Suite 401,
Newark, Delaware - 19713,
United States

T: +1-845-579-5705

Americas

Future Market Insights, Inc.

616 Corporate Way, Suite 2-9018,
Valley Cottage, NY 10989, United States

T: +1-347-918-3531

MEA

Future Market Insights

1602-6 Jumeirah Bay X2 Tower, Plot No: JLT-PH2-X2A,
Jumeirah Lakes Towers, Dubai,
United Arab Emirates

Europe

Future Market Insights

3rd Floor, 207 Regent Street,
W1B 3HH London
United Kingdom

T: + 44 (0) 20 8123 9659
D: +44 (0) 20 3287 4268

Asia Pacific

Future Market Insights

IndiaLand Global Tech Park, Unit UG-1, Behind Grand HighStreet, Phase 1, Hinjawadi, MH, Pune – 411057, India

Clip-On Headphones Market (2022 to 2032)

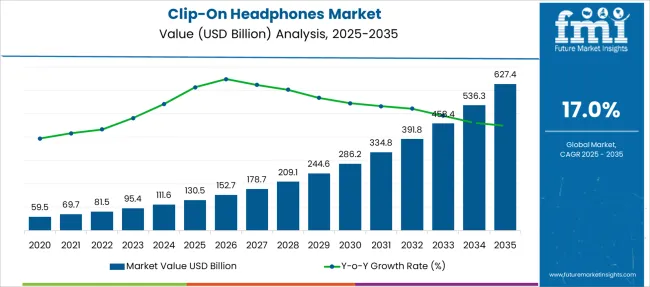
The clip-on headphones market is projected to register a CAGR of 17% during the forecast period, up from US$ 70 Billion in 2021 to reach a valuation of US$ 392 Billion by 2032.

The clip-on headphones market is anticipated to show promising growth prospects during the forecast period as a result of growing competition. New competitors are offering a variety of options at reasonable pricing to fulfill the demand for clip-on headphones making them more accessible to customers in the global clip-on headphones market. The business models, major strategies, and respective clip-on headphones market shares of some of the most notable companies in this sector are all examined in depth in this clip-on headphones market report.

The comprehensive analysis includes sales of clip-on headphones statistics in terms of revenues, segment-by-segment data, region-by-region data, and country-by-country data, as well as an in-depth commentary on the main affecting variables. This report is one of the most thorough studies available, including all aspects of the growing demand for the clip-on headphones industry.

Report Attribute Details
Estimated Base Year Value (2021) US$ 70 Billion
Expected Market Value (2022) US$ 81.5 Billion
Anticipated Forecast Value (2032) US$ 392 Billion
Projected Growth Rate (2022 to 2032) 17% CAGR

Sales of clip-on headphones are expected to rise significantly. In addition to this, sales of clip-on headphones are rising on account for US$ 153 Billion by 2026. Increasing sales of clip-on headphones are also projected to contribute to the growth of the clip-on headphones market share.

Everyone in the current world wears headphones on a regular basis, particularly the younger generation, who spend the majority of their time listening to music or conversing over headphones. Even when working or traveling, many wear headphones.

However, long-term use of portable audio devices and the insertion of headphones into the ear canal can result in hearing loss, infection, and a variety of other health issues. According to the World Health Organization, the usage of such audio gadgets puts billions of teens and young people in danger of hearing loss.

People are switching from in-ear-canal headphones to clip-on headphones to overcome these challenges and prevent pain as well as the risk of infection. Demand for Clip-on headphones is a result of concern for protecting the user from microorganisms that might cause illness while still providing a pleasant listening experience.

Some headphones feature large earbuds that put a lot of pressure on the ears, which can make the user uncomfortable while using them. Sales of clip-on headphones are increasing due to being an ideal fit for consumers who are always on the move yet still want to listen to music. The demand for clip-on headphones is intended to lean against the ear hooks and stay on the user's ears even while they are engaged in strenuous activities such as running, exercising, or participating in sports.

Manufacturers in the clip-on headphones market get a big platform from which to serve the whole demand for clip-on headphones. The worldwide sales of clip-on headphones are seeing increased competition. With growing competition, new competitors are offering a variety of options at reasonable pricing, fulfilling the demand for clip-on headphones more accessible to customers.

Don't pay for what you don't need

Customize your report by selecting specific countries or regions and save 30%!

What are the Key Drivers to the Clip-On Headphones Market Share

Consumers nowadays expect headphones that are stylish, fashionable, and can be used with a variety of devices such as smartphones, computers, portable music players, and other electronic gadgets. Also, in the near future, demand for clip-on headphones which provide uninterrupted sound and strong connections will influence the growth in the sales of the clip-on headphones market.

The quickly expanding habit of listening to music while walking, running, traveling, or at the gym has provided an opportunity for manufacturers to build advanced-featured headphones that can withstand rigorous and tough use.

The expansion of the demand for clip-on headphones in the market will be fueled by an increase in brand fidelity, which is one of the crucial aspects of customer decisions throughout the projected period. However, sales of clip-on headphones, increasing headphone complexity, rising headphone costs, and the detrimental impact of headphones on health are some of the issues that may limit the worldwide clip-on headphones market growth.

Consumer demand for clip-on headphones with customizable functions, as well as a desire to buy high-quality, attractive headphones at a reasonable price, has created a big opportunity for manufacturers to produce revolutionary sales of clip-on headphones.
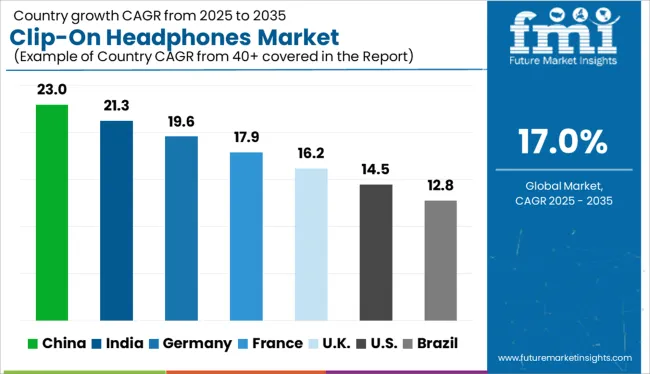
Which is the Leading Region in the Clip-On Headphones Market

During the projected period, the sales of the clip-on headphones market are expected to develop significantly across all regions. North America, Europe, Latin America, East Asia, South Asia, Oceania, the Middle East, and Africa are the seven major regions that directly contribute to the sales of clip-on headphones.

Because of the regular launch of novel products, the existence of a large number of companies in the regions, and the strong demand for wireless headphones with many functions, Europe is likely to be the leading market in the global clip-on headphones market, followed by North America.

Due to the availability of prospective customers as well as an increase in per capita expenditure on electronic devices by consumers, the clip-on headphones market in South Asia and East Asia is predicted to grow at a solid CAGR over the forecast period. Due to the entrance of notable brands in the industry, the Middle East and Africa are projected to provide great opportunities in the global clip-on headphones market in the future years.
Sneha Verghese
Sneha Verghese

Principal Consultant

Talk to Analyst

Find your sweet spots for generating winning opportunities in this market.

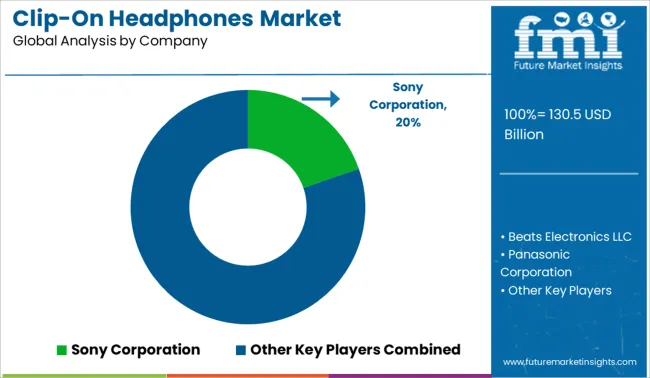
Who are the Key Players in the Clip-On Headphones Market

The report consists of key players, contributing to the clip-on headphones market share. It also consists of organic and inorganic growth strategies adopted by market players to improve their market positions. This exclusive report analyzes the competitive landscape and clip-on headphones market share acquired by players to strengthen their market position.

Koninklijke Philips N.V., Koss Corporation, Panasonic Corporation, Bang & Olufsen, Avantree, Beats Electronics LLC, Sony Corporation, MPOW, Creative Technology Ltd., Letscom, Audio-Technica Corporation, The Best Industries PRO Company, Maxell Holdings, Ltd., Victor Company of Japan, Ltd., and others are some of the major players in the global clip-on headphones market.

Recent developments in the Clip-On Headphones Market:

  • Apple launched AirPods Max in December 2020, a new wireless headset that combines the magic of AirPods with an over-ear design and high-fidelity sound.
  • With the arrival of the Harman Kardon Onyx Studio 7 in January 2021, HARMAN KARDON continues to extend its award-winning Onyx Series. For the most demanding audiophiles, the newest Bluetooth speaker boasts outstanding stereo performance sound and an elegant industrial style.
  • Bose launched the new Bose Athletic Open Earphones in January 2021, which are completely wireless sports earbuds that do not go into or cover the ears. Instead, they use Bose OpenAudio technology in conjunction with a unique design to keep the user engaged with music, connected to calls, and aware of their surroundings.
  • Sonos Roam, the ultra-portable smart speaker designed to offer terrific music at home and on any trip, was released in March 2021. The new speakers can connect to a Sonos system through WiFi at home and instantly switch to Bluetooth while they're out and about.
  • Sony debuted its X-Series speaker line in April 2021. Sony's X-Balanced Speaker Units are used in all of the speakers. By expanding the size of the speaker, the non-circular diaphragm produces greater sound pressure and less distorted sound.

Scope of Report

Report Attribute Details
Growth rate CAGR of 17% from 2022 to 2032
The base year for estimation 2021
Historical data 2015 to 2020
Forecast period 2022 to 2032
Quantitative units Revenue in USD billion, volume in kilotons, and CAGR from 2022 to 2032
Report Coverage Revenue forecast, volume forecast, company ranking, competitive landscape, growth factors, and trends, Pricing Analysis
Segments Covered Technology. Headset type, application, price range, sales channel, region
Regional scope North America; Western Europe, Eastern Europe, Middle East, Africa, ASEAN, South Asia, Rest of Asia, Australia, and New Zealand
Country scope USA; Canada; Mexico; Germany; United Kingdom; France; Italy; Spain; Russia; Belgium; Poland; Czech Republic; China; India; Japan; Australia; Brazil; Argentina; Colombia; Saudi Arabia; United Arab Emirates(UAE); Iran; South Africa
Key companies profiled Koninklijke Philips N.V., Koss Corporation, Panasonic Corporation, Bang & Olufsen, Avantree, Beats Electronics LLC, Sony Corporation, MPOW, Creative Technology Ltd., Letscom, Audio-Technica Corporation, The Best Industries PRO Company, Maxell Holdings, Ltd., Victor Company of Japan, Ltd., and others
Customization scope Free report customization (equivalent to up to 8 analysts' working days) with purchase. Addition or alteration to country, regional & segment scope.
Pricing and purchase options Avail of customized purchase options to meet your exact research needs.

Get the data you need at a Fraction of the cost

Personalize your report by choosing insights you need
and save 40%!

Key Segments For Clip-On Headphones Market

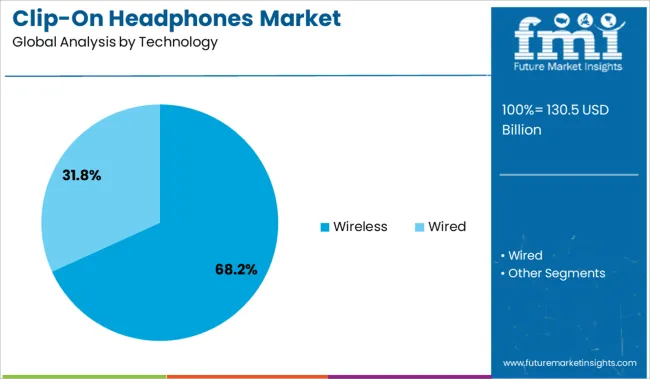
On The Basis Of Technology, The Global Clip-On Headphones Market Has Been Segmented As:

  • Wired
  • Wireless

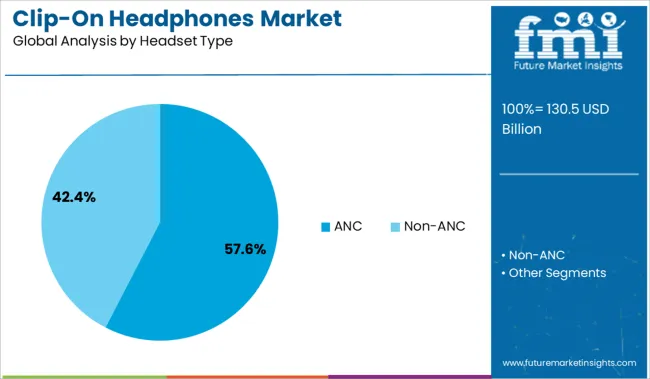
On The Basis Of Headset Type, The Global Clip-On Headphones Market Has Been Segmented As:

  • ANC
  • Non-ANC

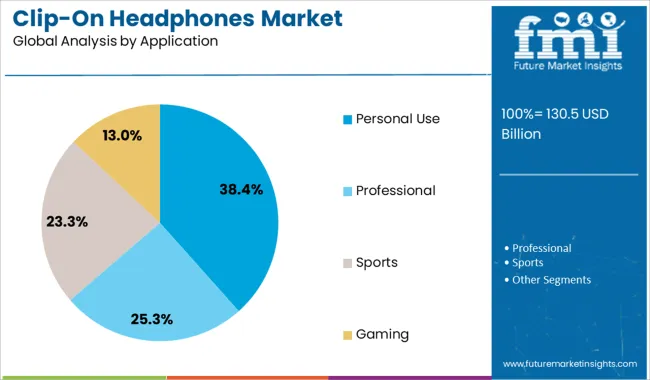
On The Basis Of Application, The Global Clip-On Headphones Market Has Been Segmented As:

  • Personal Use
  • Professional
  • Sports
  • Gaming

On The Basis Of The Price Range, The Global Clip-On Headphones Market Has Been Segmented As:

  • Economy
  • Mid-Range
  • Premium

On The Basis Of The Sales Channel, The Global Clip-On Headphones Market Has Been Segmented As:

  • Direct
  • Indirect
  • Supermarkets/Hypermarkets
  • Multi-Brand Stores
  • Exclusive Stores/Franchises
  • Independent Small Stores
  • E-Retailers
  • Other

On The Basis Of The Region, The Global Clip-On Headphones Market Has Been Segmented As:

  • North America (USA, Canada)
  • Latin America (Mexico, Brazil)
  • Europe (Germany, United Kingdom, France, Italy, Spain, Poland, Russia)
  • East Asia (China, Japan, South Korea)
  • South Asia (India, Thailand, Malaysia, Vietnam, Indonesia)
  • Oceania (Australia, New Zealand)
  • Middle East & Africa (GCC Countries, Turkey, Northern Africa, South Africa)

Frequently Asked Questions

What is the Growth Outlook for the Clip-On Headphones Market?

The clip-on headphones market is predicted to register a CAGR of 17% during the forecast period.

Who are the Key Players in the Clip-On Headphones Market?

Key players holding substantial clip-on headphones market share include Koninklijke Philips N.V., Koss Corporation, Panasonic Corporation, Bang & Olufsen, Avantree, Beats Electronics LLC, Sony Corporation, MPOW, Creative Technology Ltd., and others.

What is the Future of the Clip-On Headphones Market?

As per the analysis, the clip-on headphones market share is likely to be US$ 153 Billion by 2026.

Which is the Key Driver in the Clip-On Headphones Market?

Demand for clip-on headphones is likely to rise due to the consumption of customized clip-on headphones, as well as a desire to acquire high-quality, stylish headphones at a reasonable price, which has generated a huge potential for producers.

Table of Content

1. Executive Summary | Clip-On Headphones Market

    1.1. Global Market Outlook

    1.2. Demand-side Trends

    1.3. Supply-side Trends

    1.4. Technology Roadmap Analysis

    1.5. Analysis and Recommendations

2. Market Overview

    2.1. Market Coverage / Taxonomy

    2.2. Market Definition / Scope / Limitations

3. Market Background

    3.1. Market Dynamics

        3.1.1. Drivers

        3.1.2. Restraints

        3.1.3. Opportunity

        3.1.4. Trends

    3.2. Scenario Forecast

        3.2.1. Demand in Optimistic Scenario

        3.2.2. Demand in Likely Scenario

        3.2.3. Demand in Conservative Scenario

    3.3. Opportunity Map Analysis

    3.4. Investment Feasibility Matrix

    3.5. PESTLE and Porter’s Analysis

    3.6. Regulatory Landscape

        3.6.1. By Key Regions

        3.6.2. By Key Countries

4. Global Market Analysis 2017 to 2021 and Forecast, 2022 to 2032

    4.1. Historical Market Size Value (US$ Million) & VolumeAnalysis, 2017 to 2021

    4.2. Current and Future Market Size Value (US$ Million) & VolumeProjections, 2022 to 2032

        4.2.1. Y-o-Y Growth Trend Analysis

        4.2.2. Absolute $ Opportunity Analysis

5. Global Market Analysis 2017 to 2021 and Forecast 2022 to 2032, By Technology

    5.1. Introduction / Key Findings

    5.2. Historical Market Size Value (US$ Million) & VolumeAnalysis By Technology, 2017 to 2021

    5.3. Current and Future Market Size Value (US$ Million) & VolumeAnalysis and Forecast By Technology, 2022 to 2032

        5.3.1. Wired

        5.3.2. Wireless

    5.4. Y-o-Y Growth Trend Analysis By Technology, 2017 to 2021

    5.5. Absolute $ Opportunity Analysis By Technology, 2022 to 2032

6. Global Market Analysis 2017 to 2021 and Forecast 2022 to 2032, By Headset Type

    6.1. Introduction / Key Findings

    6.2. Historical Market Size Value (US$ Million) & VolumeAnalysis By Headset Type, 2017 to 2021

    6.3. Current and Future Market Size Value (US$ Million) & VolumeAnalysis and Forecast By Headset Type, 2022 to 2032

        6.3.1. ANC

        6.3.2. Non-ANC

    6.4. Y-o-Y Growth Trend Analysis By Headset Type, 2017 to 2021

    6.5. Absolute $ Opportunity Analysis By Headset Type, 2022 to 2032

7. Global Market Analysis 2017 to 2021 and Forecast 2022 to 2032, By Application

    7.1. Introduction / Key Findings

    7.2. Historical Market Size Value (US$ Million) & VolumeAnalysis By Application, 2017 to 2021

    7.3. Current and Future Market Size Value (US$ Million) & VolumeAnalysis and Forecast By Application, 2022 to 2032

        7.3.1. Personal Use

        7.3.2. Professional

        7.3.3. Sports

        7.3.4. Gaming

    7.4. Y-o-Y Growth Trend Analysis By Application, 2017 to 2021

    7.5. Absolute $ Opportunity Analysis By Application, 2022 to 2032

8. Global Market Analysis 2017 to 2021 and Forecast 2022 to 2032, By Price Range

    8.1. Introduction / Key Findings

    8.2. Historical Market Size Value (US$ Million) & VolumeAnalysis By Price Range, 2017 to 2021

    8.3. Current and Future Market Size Value (US$ Million) & VolumeAnalysis and Forecast By Price Range, 2022 to 2032

        8.3.1. Economy

        8.3.2. Mid-Range

        8.3.3. Premium

    8.4. Y-o-Y Growth Trend Analysis By Price Range, 2017 to 2021

    8.5. Absolute $ Opportunity Analysis By Price Range, 2022 to 2032

9. Global Market Analysis 2017 to 2021 and Forecast 2022 to 2032, By Sales Channel

    9.1. Introduction / Key Findings

    9.2. Historical Market Size Value (US$ Million) & VolumeAnalysis By Sales Channel, 2017 to 2021

    9.3. Current and Future Market Size Value (US$ Million) & VolumeAnalysis and Forecast By Sales Channel, 2022 to 2032

        9.3.1. Supermarkets/Hypermarkets

        9.3.2. Multi-Brand Stores

        9.3.3. Independent Small Stores

        9.3.4. Online

        9.3.5. Others

    9.4. Y-o-Y Growth Trend Analysis By Sales Channel, 2017 to 2021

    9.5. Absolute $ Opportunity Analysis By Sales Channel, 2022 to 2032

10. Global Market Analysis 2017 to 2021 and Forecast 2022 to 2032, By Region

    10.1. Introduction

    10.2. Historical Market Size Value (US$ Million) & VolumeAnalysis By Region, 2017 to 2021

    10.3. Current Market Size Value (US$ Million) & VolumeAnalysis and Forecast By Region, 2022 to 2032

        10.3.1. North America

        10.3.2. Latin America

        10.3.3. Europe

        10.3.4. East Asia

        10.3.5. South Asia

        10.3.6. Oceania

        10.3.7. Middle East and Africa

    10.4. Market Attractiveness Analysis By Region

11. North America Market Analysis 2017 to 2021 and Forecast 2022 to 2032, By Country

    11.1. Historical Market Size Value (US$ Million) & VolumeTrend Analysis By Market Taxonomy, 2017 to 2021

    11.2. Market Size Value (US$ Million) & VolumeForecast By Market Taxonomy, 2022 to 2032

        11.2.1. By Country

            11.2.1.1. USA

            11.2.1.2. Canada

        11.2.2. By Technology

        11.2.3. By Headset Type

        11.2.4. By Application

        11.2.5. By Price Range

        11.2.6. By Sales Channel

    11.3. Market Attractiveness Analysis

        11.3.1. By Country

        11.3.2. By Technology

        11.3.3. By Headset Type

        11.3.4. By Application

        11.3.5. By Price Range

        11.3.6. By Sales Channel

    11.4. Key Takeaways

12. Latin America Market Analysis 2017 to 2021 and Forecast 2022 to 2032, By Country

    12.1. Historical Market Size Value (US$ Million) & VolumeTrend Analysis By Market Taxonomy, 2017 to 2021

    12.2. Market Size Value (US$ Million) & VolumeForecast By Market Taxonomy, 2022 to 2032

        12.2.1. By Country

            12.2.1.1. Brazil

            12.2.1.2. Mexico

            12.2.1.3. Rest of Latin America

        12.2.2. By Technology

        12.2.3. By Headset Type

        12.2.4. By Application

        12.2.5. By Price Range

        12.2.6. By Sales Channel

    12.3. Market Attractiveness Analysis

        12.3.1. By Country

        12.3.2. By Technology

        12.3.3. By Headset Type

        12.3.4. By Application

        12.3.5. By Price Range

        12.3.6. By Sales Channel

    12.4. Key Takeaways

13. Europe Market Analysis 2017 to 2021 and Forecast 2022 to 2032, By Country

    13.1. Historical Market Size Value (US$ Million) & VolumeTrend Analysis By Market Taxonomy, 2017 to 2021

    13.2. Market Size Value (US$ Million) & VolumeForecast By Market Taxonomy, 2022 to 2032

        13.2.1. By Country

            13.2.1.1. Germany

            13.2.1.2. Italy

            13.2.1.3. France

            13.2.1.4. United Kingdom

            13.2.1.5. Spain

            13.2.1.6. Russia

            13.2.1.7. BENELUX

            13.2.1.8. Rest of Europe

        13.2.2. By Technology

        13.2.3. By Headset Type

        13.2.4. By Application

        13.2.5. By Price Range

        13.2.6. By Sales Channel

    13.3. Market Attractiveness Analysis

        13.3.1. By Country

        13.3.2. By Technology

        13.3.3. By Headset Type

        13.3.4. By Application

        13.3.5. By Price Range

        13.3.6. By Sales Channel

    13.4. Key Takeaways

14. East Asia Market Analysis 2017 to 2021 and Forecast 2022 to 2032, By Country

    14.1. Historical Market Size Value (US$ Million) & VolumeTrend Analysis By Market Taxonomy, 2017 to 2021

    14.2. Market Size Value (US$ Million) & VolumeForecast By Market Taxonomy, 2022 to 2032

        14.2.1. By Country

            14.2.1.1. China

            14.2.1.2. Japan

            14.2.1.3. South Korea

        14.2.2. By Technology

        14.2.3. By Headset Type

        14.2.4. By Application

        14.2.5. By Price Range

        14.2.6. By Sales Channel

    14.3. Market Attractiveness Analysis

        14.3.1. By Country

        14.3.2. By Technology

        14.3.3. By Headset Type

        14.3.4. By Application

        14.3.5. By Price Range

        14.3.6. By Sales Channel

    14.4. Key Takeaways

15. South Asia Market Analysis 2017 to 2021 and Forecast 2022 to 2032, By Country

    15.1. Historical Market Size Value (US$ Million) & VolumeTrend Analysis By Market Taxonomy, 2017 to 2021

    15.2. Market Size Value (US$ Million) & VolumeForecast By Market Taxonomy, 2022 to 2032

        15.2.1. By Country

            15.2.1.1. India

            15.2.1.2. Thailand

            15.2.1.3. Malaysia

            15.2.1.4. Indonesia

            15.2.1.5. Rest of South Asia

        15.2.2. By Technology

        15.2.3. By Headset Type

        15.2.4. By Application

        15.2.5. By Price Range

        15.2.6. By Sales Channel

    15.3. Market Attractiveness Analysis

        15.3.1. By Country

        15.3.2. By Technology

        15.3.3. By Headset Type

        15.3.4. By Application

        15.3.5. By Price Range

        15.3.6. By Sales Channel

    15.4. Key Takeaways

16. Oceania Market Analysis 2017 to 2021 and Forecast 2022 to 2032, By Country

    16.1. Historical Market Size Value (US$ Million) & VolumeTrend Analysis By Market Taxonomy, 2017 to 2021

    16.2. Market Size Value (US$ Million) & VolumeForecast By Market Taxonomy, 2022 to 2032

        16.2.1. By Country

            16.2.1.1. Australia

            16.2.1.2. New Zealand

        16.2.2. By Technology

        16.2.3. By Headset Type

        16.2.4. By Application

        16.2.5. By Price Range

        16.2.6. By Sales Channel

    16.3. Market Attractiveness Analysis

        16.3.1. By Country

        16.3.2. By Technology

        16.3.3. By Headset Type

        16.3.4. By Application

        16.3.5. By Price Range

        16.3.6. By Sales Channel

    16.4. Key Takeaways

17. Middle East and Africa Market Analysis 2017 to 2021 and Forecast 2022 to 2032, By Country

    17.1. Historical Market Size Value (US$ Million) & VolumeTrend Analysis By Market Taxonomy, 2017 to 2021

    17.2. Market Size Value (US$ Million) & VolumeForecast By Market Taxonomy, 2022 to 2032

        17.2.1. By Country

            17.2.1.1. GCC Countries

            17.2.1.2. Turkey

            17.2.1.3. Israel

            17.2.1.4. South Africa

            17.2.1.5. Egypt

            17.2.1.6. Rest of Middle East and Africa

        17.2.2. By Technology

        17.2.3. By Headset Type

        17.2.4. By Application

        17.2.5. By Price Range

        17.2.6. By Sales Channel

    17.3. Market Attractiveness Analysis

        17.3.1. By Country

        17.3.2. By Technology

        17.3.3. By Headset Type

        17.3.4. By Application

        17.3.5. By Price Range

        17.3.6. By Sales Channel

    17.4. Key Takeaways

18. Key Countries Market Analysis

    18.1. USA

        18.1.1. Pricing Analysis

        18.1.2. Market Share Analysis, 2021

            18.1.2.1. By Technology

            18.1.2.2. By Headset Type

            18.1.2.3. By Application

            18.1.2.4. By Price Range

            18.1.2.5. By Sales Channel

    18.2. Canada

        18.2.1. Pricing Analysis

        18.2.2. Market Share Analysis, 2021

            18.2.2.1. By Technology

            18.2.2.2. By Headset Type

            18.2.2.3. By Application

            18.2.2.4. By Price Range

            18.2.2.5. By Sales Channel

    18.3. Brazil

        18.3.1. Pricing Analysis

        18.3.2. Market Share Analysis, 2021

            18.3.2.1. By Technology

            18.3.2.2. By Headset Type

            18.3.2.3. By Application

            18.3.2.4. By Price Range

            18.3.2.5. By Sales Channel

    18.4. Mexico

        18.4.1. Pricing Analysis

        18.4.2. Market Share Analysis, 2021

            18.4.2.1. By Technology

            18.4.2.2. By Headset Type

            18.4.2.3. By Application

            18.4.2.4. By Price Range

            18.4.2.5. By Sales Channel

    18.5. Argentina

        18.5.1. Pricing Analysis

        18.5.2. Market Share Analysis, 2021

            18.5.2.1. By Technology

            18.5.2.2. By Headset Type

            18.5.2.3. By Application

            18.5.2.4. By Price Range

            18.5.2.5. By Sales Channel

    18.6. Germany

        18.6.1. Pricing Analysis

        18.6.2. Market Share Analysis, 2021

            18.6.2.1. By Technology

            18.6.2.2. By Headset Type

            18.6.2.3. By Application

            18.6.2.4. By Price Range

            18.6.2.5. By Sales Channel

    18.7. Italy18.7.1. Pricing Analysis

        18.7.1. Market Share Analysis, 2021

            18.7.1.1. By Technology

            18.7.1.2. By Headset Type

            18.7.1.3. By Application

            18.7.1.4. By Price Range

            18.7.1.5. By Sales Channel

    18.8. France

        18.8.1. Pricing Analysis

        18.8.2. Market Share Analysis, 2021

            18.8.2.1. By Technology

            18.8.2.2. By Headset Type

            18.8.2.3. By Application

            18.8.2.4. By Price Range

            18.8.2.5. By Sales Channel

    18.9. United Kingdom

        18.9.1. Pricing Analysis

        18.9.2. Market Share Analysis, 2021

            18.9.2.1. By Technology

            18.9.2.2. By Headset Type

            18.9.2.3. By Application

            18.9.2.4. By Price Range

            18.9.2.5. By Sales Channel

    18.10. Spain

        18.10.1. Pricing Analysis

        18.10.2. Market Share Analysis, 2021

            18.10.2.1. By Technology

            18.10.2.2. By Headset Type

            18.10.2.3. By Application

            18.10.2.4. By Price Range

            18.10.2.5. By Sales Channel

    18.11. Russia

        18.11.1. Pricing Analysis

        18.11.2. Market Share Analysis, 2021

            18.11.2.1. By Technology

            18.11.2.2. By Headset Type

            18.11.2.3. By Application

            18.11.2.4. By Price Range

            18.11.2.5. By Sales Channel

    18.12. BENELUX

        18.12.1. Pricing Analysis

        18.12.2. Market Share Analysis, 2021

            18.12.2.1. By Technology

            18.12.2.2. By Headset Type

            18.12.2.3. By Application

            18.12.2.4. By Price Range

            18.12.2.5. By Sales Channel

    18.13. China

        18.13.1. Pricing Analysis

        18.13.2. Market Share Analysis, 2021

            18.13.2.1. By Technology

            18.13.2.2. By Headset Type

            18.13.2.3. By Application

            18.13.2.4. By Price Range

            18.13.2.5. By Sales Channel

    18.14. Japan

        18.14.1. Pricing Analysis

        18.14.2. Market Share Analysis, 2021

            18.14.2.1. By Technology

            18.14.2.2. By Headset Type

            18.14.2.3. By Application

            18.14.2.4. By Price Range

            18.14.2.5. By Sales Channel

    18.15. South Korea

        18.15.1. Pricing Analysis

        18.15.2. Market Share Analysis, 2021

            18.15.2.1. By Technology

            18.15.2.2. By Headset Type

            18.15.2.3. By Application

            18.15.2.4. By Price Range

            18.15.2.5. By Sales Channel

    18.16. India

        18.16.1. Pricing Analysis

        18.16.2. Market Share Analysis, 2021

            18.16.2.1. By Technology

            18.16.2.2. By Headset Type

            18.16.2.3. By Application

            18.16.2.4. By Price Range

            18.16.2.5. By Sales Channel

    18.17. GCC Countries

        18.17.1. Pricing Analysis

        18.17.2. Market Share Analysis, 2021

            18.17.2.1. By Technology

            18.17.2.2. By Headset Type

            18.17.2.3. By Application

            18.17.2.4. By Price Range

            18.17.2.5. By Sales Channel

    18.18. Turkey

        18.18.1. Pricing Analysis

        18.18.2. Market Share Analysis, 2021

            18.18.2.1. By Technology

            18.18.2.2. By Headset Type

            18.18.2.3. By Application

            18.18.2.4. By Price Range

            18.18.2.5. By Sales Channel

    18.19. Israel

        18.19.1. Pricing Analysis

        18.19.2. Market Share Analysis, 2021

            18.19.2.1. By Technology

            18.19.2.2. By Headset Type

            18.19.2.3. By Application

            18.19.2.4. By Price Range

            18.19.2.5. By Sales Channel

    18.20. South Africa

        18.20.1. Pricing Analysis

        18.20.2. Market Share Analysis, 2021

            18.20.2.1. By Technology

            18.20.2.2. By Headset Type

            18.20.2.3. By Application

            18.20.2.4. By Price Range

            18.20.2.5. By Sales Channel

    18.21. Egypt

        18.21.1. Pricing Analysis

        18.21.2. Market Share Analysis, 2021

            18.21.2.1. By Technology

            18.21.2.2. By Headset Type

            18.21.2.3. By Application

            18.21.2.4. By Price Range

            18.21.2.5. By Sales Channel

19. Market Structure Analysis

    19.1. Competition Dashboard

    19.2. Competition Benchmarking

    19.3. Market Share Analysis of Top Players

        19.3.1. By Regional

        19.3.2. By Technology

        19.3.3. By Headset Type

        19.3.4. By Application

        19.3.5. By Price Range

        19.3.6. By Sales Channel

20. Competition Analysis

    20.1. Competition Deep Dive

        20.1.1. Koninklijke Philips N.V.,

            20.1.1.1. Overview

            20.1.1.2. Product Portfolio

            20.1.1.3. Profitability by Market Segment

            20.1.1.4. Sales Footprint

            20.1.1.5. Strategy Overview

                20.1.1.5.1. Marketing Strategy

                20.1.1.5.2. Product Strategy

        20.1.2. Koss Corporation

            20.1.2.1. Overview

            20.1.2.2. Product Portfolio

            20.1.2.3. Profitability by Market Segment

            20.1.2.4. Sales Footprint

            20.1.2.5. Strategy Overview

                20.1.2.5.1. Marketing Strategy

                20.1.2.5.2. Product Strategy

        20.1.3. Panasonic Corporation

            20.1.3.1. Overview

            20.1.3.2. Product Portfolio

            20.1.3.3. Profitability by Market Segment

            20.1.3.4. Sales Footprint

            20.1.3.5. Strategy Overview

                20.1.3.5.1. Marketing Strategy

                20.1.3.5.2. Product Strategy

        20.1.4. Bang & Olufsen

            20.1.4.1. Overview

            20.1.4.2. Product Portfolio

            20.1.4.3. Profitability by Market Segment

            20.1.4.4. Sales Footprint

            20.1.4.5. Strategy Overview

                20.1.4.5.1. Marketing Strategy

                20.1.4.5.2. Product Strategy

        20.1.5. Avantree

            20.1.5.1. Overview

            20.1.5.2. Product Portfolio

            20.1.5.3. Profitability by Market Segment

            20.1.5.4. Sales Footprint

            20.1.5.5. Strategy Overview

                20.1.5.5.1. Marketing Strategy

                20.1.5.5.2. Product Strategy

        20.1.6. Beats Electronics LLC

            20.1.6.1. Overview

            20.1.6.2. Product Portfolio

            20.1.6.3. Profitability by Market Segment

            20.1.6.4. Sales Footprint

            20.1.6.5. Strategy Overview

                20.1.6.5.1. Marketing Strategy

                20.1.6.5.2. Product Strategy

        20.1.7. Sony Corporation

            20.1.7.1. Overview

            20.1.7.2. Product Portfolio

            20.1.7.3. Profitability by Market Segment

            20.1.7.4. Sales Footprint

            20.1.7.5. Strategy Overview

                20.1.7.5.1. Marketing Strategy

                20.1.7.5.2. Product Strategy

        20.1.8. MPOW

            20.1.8.1. Overview

            20.1.8.2. Product Portfolio

            20.1.8.3. Profitability by Market Segment

            20.1.8.4. Sales Footprint

            20.1.8.5. Strategy Overview

                20.1.8.5.1. Marketing Strategy

                20.1.8.5.2. Product Strategy

        20.1.9. Creative Technology Ltd.

            20.1.9.1. Overview

            20.1.9.2. Product Portfolio

            20.1.9.3. Profitability by Market Segment

            20.1.9.4. Sales Footprint

            20.1.9.5. Strategy Overview

                20.1.9.5.1. Marketing Strategy

                20.1.9.5.2. Product Strategy

        20.1.10. Letscom

            20.1.10.1. Overview

            20.1.10.2. Product Portfolio

            20.1.10.3. Profitability by Market Segment

            20.1.10.4. Sales Footprint

            20.1.10.5. Strategy Overview

                20.1.10.5.1. Marketing Strategy

                20.1.10.5.2. Product Strategy

        20.1.11. Audio-Technica Corporation

            20.1.11.1. Overview

            20.1.11.2. Product Portfolio

            20.1.11.3. Profitability by Market Segment

            20.1.11.4. Sales Footprint

            20.1.11.5. Strategy Overview

                20.1.11.5.1. Marketing Strategy

                20.1.11.5.2. Product Strategy

        20.1.12. The Best Industries PRO Company

            20.1.12.1. Overview

            20.1.12.2. Product Portfolio

            20.1.12.3. Profitability by Market Segment

            20.1.12.4. Sales Footprint

            20.1.12.5. Strategy Overview

                20.1.12.5.1. Marketing Strategy

                20.1.12.5.2. Product Strategy

        20.1.13. Maxell Holdings, Ltd.

            20.1.13.1. Overview

            20.1.13.2. Product Portfolio

            20.1.13.3. Profitability by Market Segment

            20.1.13.4. Sales Footprint

            20.1.13.5. Strategy Overview

                20.1.13.5.1. Marketing Strategy

                20.1.13.5.2. Product Strategy

        20.1.14. Victor Company of Japan, Ltd.

            20.1.14.1. Overview

            20.1.14.2. Product Portfolio

            20.1.14.3. Profitability by Market Segment

            20.1.14.4. Sales Footprint

            20.1.14.5. Strategy Overview

                20.1.14.5.1. Marketing Strategy

                20.1.14.5.2. Product Strategy

21. Assumptions & Acronyms Used

22. Research Methodology

List of Tables

Table 1: Global Market Value (US$ Million) Forecast by Region, 2017 to 2032

Table 2: Global Market Volume Forecast by Region, 2017 to 2032

Table 3: Global Market Value (US$ Million) Forecast by Technology, 2017 to 2032

Table 4: Global Market Volume Forecast by Technology, 2017 to 2032

Table 5: Global Market Value (US$ Million) Forecast by Headset Type, 2017 to 2032

Table 6: Global Market Volume Forecast by Headset Type, 2017 to 2032

Table 7: Global Market Value (US$ Million) Forecast by Application, 2017 to 2032

Table 8: Global Market Volume Forecast by Application, 2017 to 2032

Table 9: Global Market Value (US$ Million) Forecast by Price Range, 2017 to 2032

Table 10: Global Market Volume Forecast by Price Range, 2017 to 2032

Table 11: Global Market Value (US$ Million) Forecast by Sales Channel, 2017 to 2032

Table 12: Global Market Volume Forecast by Sales Channel, 2017 to 2032

Table 13: North America Market Value (US$ Million) Forecast by Country, 2017 to 2032

Table 14: North America Market Volume Forecast by Country, 2017 to 2032

Table 15: North America Market Value (US$ Million) Forecast by Technology, 2017 to 2032

Table 16: North America Market Volume Forecast by Technology, 2017 to 2032

Table 17: North America Market Value (US$ Million) Forecast by Headset Type, 2017 to 2032

Table 18: North America Market Volume Forecast by Headset Type, 2017 to 2032

Table 19: North America Market Value (US$ Million) Forecast by Application, 2017 to 2032

Table 20: North America Market Volume Forecast by Application, 2017 to 2032

Table 21: North America Market Value (US$ Million) Forecast by Price Range, 2017 to 2032

Table 22: North America Market Volume Forecast by Price Range, 2017 to 2032

Table 23: North America Market Value (US$ Million) Forecast by Sales Channel, 2017 to 2032

Table 24: North America Market Volume Forecast by Sales Channel, 2017 to 2032

Table 25: Latin America Market Value (US$ Million) Forecast by Country, 2017 to 2032

Table 26: Latin America Market Volume Forecast by Country, 2017 to 2032

Table 27: Latin America Market Value (US$ Million) Forecast by Technology, 2017 to 2032

Table 28: Latin America Market Volume Forecast by Technology, 2017 to 2032

Table 29: Latin America Market Value (US$ Million) Forecast by Headset Type, 2017 to 2032

Table 30: Latin America Market Volume Forecast by Headset Type, 2017 to 2032

Table 31: Latin America Market Value (US$ Million) Forecast by Application, 2017 to 2032

Table 32: Latin America Market Volume Forecast by Application, 2017 to 2032

Table 33: Latin America Market Value (US$ Million) Forecast by Price Range, 2017 to 2032

Table 34: Latin America Market Volume Forecast by Price Range, 2017 to 2032

Table 35: Latin America Market Value (US$ Million) Forecast by Sales Channel, 2017 to 2032

Table 36: Latin America Market Volume Forecast by Sales Channel, 2017 to 2032

Table 37: Europe Market Value (US$ Million) Forecast by Country, 2017 to 2032

Table 38: Europe Market Volume Forecast by Country, 2017 to 2032

Table 39: Europe Market Value (US$ Million) Forecast by Technology, 2017 to 2032

Table 40: Europe Market Volume Forecast by Technology, 2017 to 2032

Table 41: Europe Market Value (US$ Million) Forecast by Headset Type, 2017 to 2032

Table 42: Europe Market Volume Forecast by Headset Type, 2017 to 2032

Table 43: Europe Market Value (US$ Million) Forecast by Application, 2017 to 2032

Table 44: Europe Market Volume Forecast by Application, 2017 to 2032

Table 45: Europe Market Value (US$ Million) Forecast by Price Range, 2017 to 2032

Table 46: Europe Market Volume Forecast by Price Range, 2017 to 2032

Table 47: Europe Market Value (US$ Million) Forecast by Sales Channel, 2017 to 2032

Table 48: Europe Market Volume Forecast by Sales Channel, 2017 to 2032

Table 49: East Asia Market Value (US$ Million) Forecast by Country, 2017 to 2032

Table 50: East Asia Market Volume Forecast by Country, 2017 to 2032

Table 51: East Asia Market Value (US$ Million) Forecast by Technology, 2017 to 2032

Table 52: East Asia Market Volume Forecast by Technology, 2017 to 2032

Table 53: East Asia Market Value (US$ Million) Forecast by Headset Type, 2017 to 2032

Table 54: East Asia Market Volume Forecast by Headset Type, 2017 to 2032

Table 55: East Asia Market Value (US$ Million) Forecast by Application, 2017 to 2032

Table 56: East Asia Market Volume Forecast by Application, 2017 to 2032

Table 57: East Asia Market Value (US$ Million) Forecast by Price Range, 2017 to 2032

Table 58: East Asia Market Volume Forecast by Price Range, 2017 to 2032

Table 59: East Asia Market Value (US$ Million) Forecast by Sales Channel, 2017 to 2032

Table 60: East Asia Market Volume Forecast by Sales Channel, 2017 to 2032

Table 61: South Asia Market Value (US$ Million) Forecast by Country, 2017 to 2032

Table 62: South Asia Market Volume Forecast by Country, 2017 to 2032

Table 63: South Asia Market Value (US$ Million) Forecast by Technology, 2017 to 2032

Table 64: South Asia Market Volume Forecast by Technology, 2017 to 2032

Table 65: South Asia Market Value (US$ Million) Forecast by Headset Type, 2017 to 2032

Table 66: South Asia Market Volume Forecast by Headset Type, 2017 to 2032

Table 67: South Asia Market Value (US$ Million) Forecast by Application, 2017 to 2032

Table 68: South Asia Market Volume Forecast by Application, 2017 to 2032

Table 69: South Asia Market Value (US$ Million) Forecast by Price Range, 2017 to 2032

Table 70: South Asia Market Volume Forecast by Price Range, 2017 to 2032

Table 71: South Asia Market Value (US$ Million) Forecast by Sales Channel, 2017 to 2032

Table 72: South Asia Market Volume Forecast by Sales Channel, 2017 to 2032

Table 73: Oceania Market Value (US$ Million) Forecast by Country, 2017 to 2032

Table 74: Oceania Market Volume Forecast by Country, 2017 to 2032

Table 75: Oceania Market Value (US$ Million) Forecast by Technology, 2017 to 2032

Table 76: Oceania Market Volume Forecast by Technology, 2017 to 2032

Table 77: Oceania Market Value (US$ Million) Forecast by Headset Type, 2017 to 2032

Table 78: Oceania Market Volume Forecast by Headset Type, 2017 to 2032

Table 79: Oceania Market Value (US$ Million) Forecast by Application, 2017 to 2032

Table 80: Oceania Market Volume Forecast by Application, 2017 to 2032

Table 81: Oceania Market Value (US$ Million) Forecast by Price Range, 2017 to 2032

Table 82: Oceania Market Volume Forecast by Price Range, 2017 to 2032

Table 83: Oceania Market Value (US$ Million) Forecast by Sales Channel, 2017 to 2032

Table 84: Oceania Market Volume Forecast by Sales Channel, 2017 to 2032

Table 85: MEA Market Value (US$ Million) Forecast by Country, 2017 to 2032

Table 86: MEA Market Volume Forecast by Country, 2017 to 2032

Table 87: MEA Market Value (US$ Million) Forecast by Technology, 2017 to 2032

Table 88: MEA Market Volume Forecast by Technology, 2017 to 2032

Table 89: MEA Market Value (US$ Million) Forecast by Headset Type, 2017 to 2032

Table 90: MEA Market Volume Forecast by Headset Type, 2017 to 2032

Table 91: MEA Market Value (US$ Million) Forecast by Application, 2017 to 2032

Table 92: MEA Market Volume Forecast by Application, 2017 to 2032

Table 93: MEA Market Value (US$ Million) Forecast by Price Range, 2017 to 2032

Table 94: MEA Market Volume Forecast by Price Range, 2017 to 2032

Table 95: MEA Market Value (US$ Million) Forecast by Sales Channel, 2017 to 2032

Table 96: MEA Market Volume Forecast by Sales Channel, 2017 to 2032

List of Charts

Figure 1: Global Market Value (US$ Million) by Technology, 2022 to 2032

Figure 2: Global Market Value (US$ Million) by Headset Type, 2022 to 2032

Figure 3: Global Market Value (US$ Million) by Application, 2022 to 2032

Figure 4: Global Market Value (US$ Million) by Price Range, 2022 to 2032

Figure 5: Global Market Value (US$ Million) by Sales Channel, 2022 to 2032

Figure 6: Global Market Value (US$ Million) by Region, 2022 to 2032

Figure 7: Global Market Value (US$ Million) Analysis by Region, 2017 to 2032

Figure 8: Global Market Volume Analysis by Region, 2017 to 2032

Figure 9: Global Market Value Share (%) and BPS Analysis by Region, 2022 to 2032

Figure 10: Global Market Y-o-Y Growth (%) Projections by Region, 2022 to 2032

Figure 11: Global Market Value (US$ Million) Analysis by Technology, 2017 to 2032

Figure 12: Global Market Volume Analysis by Technology, 2017 to 2032

Figure 13: Global Market Value Share (%) and BPS Analysis by Technology, 2022 to 2032

Figure 14: Global Market Y-o-Y Growth (%) Projections by Technology, 2022 to 2032

Figure 15: Global Market Value (US$ Million) Analysis by Headset Type, 2017 to 2032

Figure 16: Global Market Volume Analysis by Headset Type, 2017 to 2032

Figure 17: Global Market Value Share (%) and BPS Analysis by Headset Type, 2022 to 2032

Figure 18: Global Market Y-o-Y Growth (%) Projections by Headset Type, 2022 to 2032

Figure 19: Global Market Value (US$ Million) Analysis by Application, 2017 to 2032

Figure 20: Global Market Volume Analysis by Application, 2017 to 2032

Figure 21: Global Market Value Share (%) and BPS Analysis by Application, 2022 to 2032

Figure 22: Global Market Y-o-Y Growth (%) Projections by Application, 2022 to 2032

Figure 23: Global Market Value (US$ Million) Analysis by Price Range, 2017 to 2032

Figure 24: Global Market Volume Analysis by Price Range, 2017 to 2032

Figure 25: Global Market Value Share (%) and BPS Analysis by Price Range, 2022 to 2032

Figure 26: Global Market Y-o-Y Growth (%) Projections by Price Range, 2022 to 2032

Figure 27: Global Market Value (US$ Million) Analysis by Sales Channel, 2017 to 2032

Figure 28: Global Market Volume Analysis by Sales Channel, 2017 to 2032

Figure 29: Global Market Value Share (%) and BPS Analysis by Sales Channel, 2022 to 2032

Figure 30: Global Market Y-o-Y Growth (%) Projections by Sales Channel, 2022 to 2032

Figure 31: Global Market Attractiveness by Technology, 2022 to 2032

Figure 32: Global Market Attractiveness by Headset Type, 2022 to 2032

Figure 33: Global Market Attractiveness by Application, 2022 to 2032

Figure 34: Global Market Attractiveness by Price Range, 2022 to 2032

Figure 35: Global Market Attractiveness by Sales Channel, 2022 to 2032

Figure 36: Global Market Attractiveness by Region, 2022 to 2032

Figure 37: North America Market Value (US$ Million) by Technology, 2022 to 2032

Figure 38: North America Market Value (US$ Million) by Headset Type, 2022 to 2032

Figure 39: North America Market Value (US$ Million) by Application, 2022 to 2032

Figure 40: North America Market Value (US$ Million) by Price Range, 2022 to 2032

Figure 41: North America Market Value (US$ Million) by Sales Channel, 2022 to 2032

Figure 42: North America Market Value (US$ Million) by Country, 2022 to 2032

Figure 43: North America Market Value (US$ Million) Analysis by Country, 2017 to 2032

Figure 44: North America Market Volume Analysis by Country, 2017 to 2032

Figure 45: North America Market Value Share (%) and BPS Analysis by Country, 2022 to 2032

Figure 46: North America Market Y-o-Y Growth (%) Projections by Country, 2022 to 2032

Figure 47: North America Market Value (US$ Million) Analysis by Technology, 2017 to 2032

Figure 48: North America Market Volume Analysis by Technology, 2017 to 2032

Figure 49: North America Market Value Share (%) and BPS Analysis by Technology, 2022 to 2032

Figure 50: North America Market Y-o-Y Growth (%) Projections by Technology, 2022 to 2032

Figure 51: North America Market Value (US$ Million) Analysis by Headset Type, 2017 to 2032

Figure 52: North America Market Volume Analysis by Headset Type, 2017 to 2032

Figure 53: North America Market Value Share (%) and BPS Analysis by Headset Type, 2022 to 2032

Figure 54: North America Market Y-o-Y Growth (%) Projections by Headset Type, 2022 to 2032

Figure 55: North America Market Value (US$ Million) Analysis by Application, 2017 to 2032

Figure 56: North America Market Volume Analysis by Application, 2017 to 2032

Figure 57: North America Market Value Share (%) and BPS Analysis by Application, 2022 to 2032

Figure 58: North America Market Y-o-Y Growth (%) Projections by Application, 2022 to 2032

Figure 59: North America Market Value (US$ Million) Analysis by Price Range, 2017 to 2032

Figure 60: North America Market Volume Analysis by Price Range, 2017 to 2032

Figure 61: North America Market Value Share (%) and BPS Analysis by Price Range, 2022 to 2032

Figure 62: North America Market Y-o-Y Growth (%) Projections by Price Range, 2022 to 2032

Figure 63: North America Market Value (US$ Million) Analysis by Sales Channel, 2017 to 2032

Figure 64: North America Market Volume Analysis by Sales Channel, 2017 to 2032

Figure 65: North America Market Value Share (%) and BPS Analysis by Sales Channel, 2022 to 2032

Figure 66: North America Market Y-o-Y Growth (%) Projections by Sales Channel, 2022 to 2032

Figure 67: North America Market Attractiveness by Technology, 2022 to 2032

Figure 68: North America Market Attractiveness by Headset Type, 2022 to 2032

Figure 69: North America Market Attractiveness by Application, 2022 to 2032

Figure 70: North America Market Attractiveness by Price Range, 2022 to 2032

Figure 71: North America Market Attractiveness by Sales Channel, 2022 to 2032

Figure 72: North America Market Attractiveness by Country, 2022 to 2032

Figure 73: Latin America Market Value (US$ Million) by Technology, 2022 to 2032

Figure 74: Latin America Market Value (US$ Million) by Headset Type, 2022 to 2032

Figure 75: Latin America Market Value (US$ Million) by Application, 2022 to 2032

Figure 76: Latin America Market Value (US$ Million) by Price Range, 2022 to 2032

Figure 77: Latin America Market Value (US$ Million) by Sales Channel, 2022 to 2032

Figure 78: Latin America Market Value (US$ Million) by Country, 2022 to 2032

Figure 79: Latin America Market Value (US$ Million) Analysis by Country, 2017 to 2032

Figure 80: Latin America Market Volume Analysis by Country, 2017 to 2032

Figure 81: Latin America Market Value Share (%) and BPS Analysis by Country, 2022 to 2032

Figure 82: Latin America Market Y-o-Y Growth (%) Projections by Country, 2022 to 2032

Figure 83: Latin America Market Value (US$ Million) Analysis by Technology, 2017 to 2032

Figure 84: Latin America Market Volume Analysis by Technology, 2017 to 2032

Figure 85: Latin America Market Value Share (%) and BPS Analysis by Technology, 2022 to 2032

Figure 86: Latin America Market Y-o-Y Growth (%) Projections by Technology, 2022 to 2032

Figure 87: Latin America Market Value (US$ Million) Analysis by Headset Type, 2017 to 2032

Figure 88: Latin America Market Volume Analysis by Headset Type, 2017 to 2032

Figure 89: Latin America Market Value Share (%) and BPS Analysis by Headset Type, 2022 to 2032

Figure 90: Latin America Market Y-o-Y Growth (%) Projections by Headset Type, 2022 to 2032

Figure 91: Latin America Market Value (US$ Million) Analysis by Application, 2017 to 2032

Figure 92: Latin America Market Volume Analysis by Application, 2017 to 2032

Figure 93: Latin America Market Value Share (%) and BPS Analysis by Application, 2022 to 2032

Figure 94: Latin America Market Y-o-Y Growth (%) Projections by Application, 2022 to 2032

Figure 95: Latin America Market Value (US$ Million) Analysis by Price Range, 2017 to 2032

Figure 96: Latin America Market Volume Analysis by Price Range, 2017 to 2032

Figure 97: Latin America Market Value Share (%) and BPS Analysis by Price Range, 2022 to 2032

Figure 98: Latin America Market Y-o-Y Growth (%) Projections by Price Range, 2022 to 2032

Figure 99: Latin America Market Value (US$ Million) Analysis by Sales Channel, 2017 to 2032

Figure 100: Latin America Market Volume Analysis by Sales Channel, 2017 to 2032

Figure 101: Latin America Market Value Share (%) and BPS Analysis by Sales Channel, 2022 to 2032

Figure 102: Latin America Market Y-o-Y Growth (%) Projections by Sales Channel, 2022 to 2032

Figure 103: Latin America Market Attractiveness by Technology, 2022 to 2032

Figure 104: Latin America Market Attractiveness by Headset Type, 2022 to 2032

Figure 105: Latin America Market Attractiveness by Application, 2022 to 2032

Figure 106: Latin America Market Attractiveness by Price Range, 2022 to 2032

Figure 107: Latin America Market Attractiveness by Sales Channel, 2022 to 2032

Figure 108: Latin America Market Attractiveness by Country, 2022 to 2032

Figure 109: Europe Market Value (US$ Million) by Technology, 2022 to 2032

Figure 110: Europe Market Value (US$ Million) by Headset Type, 2022 to 2032

Figure 111: Europe Market Value (US$ Million) by Application, 2022 to 2032

Figure 112: Europe Market Value (US$ Million) by Price Range, 2022 to 2032

Figure 113: Europe Market Value (US$ Million) by Sales Channel, 2022 to 2032

Figure 114: Europe Market Value (US$ Million) by Country, 2022 to 2032

Figure 115: Europe Market Value (US$ Million) Analysis by Country, 2017 to 2032

Figure 116: Europe Market Volume Analysis by Country, 2017 to 2032

Figure 117: Europe Market Value Share (%) and BPS Analysis by Country, 2022 to 2032

Figure 118: Europe Market Y-o-Y Growth (%) Projections by Country, 2022 to 2032

Figure 119: Europe Market Value (US$ Million) Analysis by Technology, 2017 to 2032

Figure 120: Europe Market Volume Analysis by Technology, 2017 to 2032

Figure 121: Europe Market Value Share (%) and BPS Analysis by Technology, 2022 to 2032

Figure 122: Europe Market Y-o-Y Growth (%) Projections by Technology, 2022 to 2032

Figure 123: Europe Market Value (US$ Million) Analysis by Headset Type, 2017 to 2032

Figure 124: Europe Market Volume Analysis by Headset Type, 2017 to 2032

Figure 125: Europe Market Value Share (%) and BPS Analysis by Headset Type, 2022 to 2032

Figure 126: Europe Market Y-o-Y Growth (%) Projections by Headset Type, 2022 to 2032

Figure 127: Europe Market Value (US$ Million) Analysis by Application, 2017 to 2032

Figure 128: Europe Market Volume Analysis by Application, 2017 to 2032

Figure 129: Europe Market Value Share (%) and BPS Analysis by Application, 2022 to 2032

Figure 130: Europe Market Y-o-Y Growth (%) Projections by Application, 2022 to 2032

Figure 131: Europe Market Value (US$ Million) Analysis by Price Range, 2017 to 2032

Figure 132: Europe Market Volume Analysis by Price Range, 2017 to 2032

Figure 133: Europe Market Value Share (%) and BPS Analysis by Price Range, 2022 to 2032

Figure 134: Europe Market Y-o-Y Growth (%) Projections by Price Range, 2022 to 2032

Figure 135: Europe Market Value (US$ Million) Analysis by Sales Channel, 2017 to 2032

Figure 136: Europe Market Volume Analysis by Sales Channel, 2017 to 2032

Figure 137: Europe Market Value Share (%) and BPS Analysis by Sales Channel, 2022 to 2032

Figure 138: Europe Market Y-o-Y Growth (%) Projections by Sales Channel, 2022 to 2032

Figure 139: Europe Market Attractiveness by Technology, 2022 to 2032

Figure 140: Europe Market Attractiveness by Headset Type, 2022 to 2032

Figure 141: Europe Market Attractiveness by Application, 2022 to 2032

Figure 142: Europe Market Attractiveness by Price Range, 2022 to 2032

Figure 143: Europe Market Attractiveness by Sales Channel, 2022 to 2032

Figure 144: Europe Market Attractiveness by Country, 2022 to 2032

Figure 145: East Asia Market Value (US$ Million) by Technology, 2022 to 2032

Figure 146: East Asia Market Value (US$ Million) by Headset Type, 2022 to 2032

Figure 147: East Asia Market Value (US$ Million) by Application, 2022 to 2032

Figure 148: East Asia Market Value (US$ Million) by Price Range, 2022 to 2032

Figure 149: East Asia Market Value (US$ Million) by Sales Channel, 2022 to 2032

Figure 150: East Asia Market Value (US$ Million) by Country, 2022 to 2032

Figure 151: East Asia Market Value (US$ Million) Analysis by Country, 2017 to 2032

Figure 152: East Asia Market Volume Analysis by Country, 2017 to 2032

Figure 153: East Asia Market Value Share (%) and BPS Analysis by Country, 2022 to 2032

Figure 154: East Asia Market Y-o-Y Growth (%) Projections by Country, 2022 to 2032

Figure 155: East Asia Market Value (US$ Million) Analysis by Technology, 2017 to 2032

Figure 156: East Asia Market Volume Analysis by Technology, 2017 to 2032

Figure 157: East Asia Market Value Share (%) and BPS Analysis by Technology, 2022 to 2032

Figure 158: East Asia Market Y-o-Y Growth (%) Projections by Technology, 2022 to 2032

Figure 159: East Asia Market Value (US$ Million) Analysis by Headset Type, 2017 to 2032

Figure 160: East Asia Market Volume Analysis by Headset Type, 2017 to 2032

Figure 161: East Asia Market Value Share (%) and BPS Analysis by Headset Type, 2022 to 2032

Figure 162: East Asia Market Y-o-Y Growth (%) Projections by Headset Type, 2022 to 2032

Figure 163: East Asia Market Value (US$ Million) Analysis by Application, 2017 to 2032

Figure 164: East Asia Market Volume Analysis by Application, 2017 to 2032

Figure 165: East Asia Market Value Share (%) and BPS Analysis by Application, 2022 to 2032

Figure 166: East Asia Market Y-o-Y Growth (%) Projections by Application, 2022 to 2032

Figure 167: East Asia Market Value (US$ Million) Analysis by Price Range, 2017 to 2032

Figure 168: East Asia Market Volume Analysis by Price Range, 2017 to 2032

Figure 169: East Asia Market Value Share (%) and BPS Analysis by Price Range, 2022 to 2032

Figure 170: East Asia Market Y-o-Y Growth (%) Projections by Price Range, 2022 to 2032

Figure 171: East Asia Market Value (US$ Million) Analysis by Sales Channel, 2017 to 2032

Figure 172: East Asia Market Volume Analysis by Sales Channel, 2017 to 2032

Figure 173: East Asia Market Value Share (%) and BPS Analysis by Sales Channel, 2022 to 2032

Figure 174: East Asia Market Y-o-Y Growth (%) Projections by Sales Channel, 2022 to 2032

Figure 175: East Asia Market Attractiveness by Technology, 2022 to 2032

Figure 176: East Asia Market Attractiveness by Headset Type, 2022 to 2032

Figure 177: East Asia Market Attractiveness by Application, 2022 to 2032

Figure 178: East Asia Market Attractiveness by Price Range, 2022 to 2032

Figure 179: East Asia Market Attractiveness by Sales Channel, 2022 to 2032

Figure 180: East Asia Market Attractiveness by Country, 2022 to 2032

Figure 181: South Asia Market Value (US$ Million) by Technology, 2022 to 2032

Figure 182: South Asia Market Value (US$ Million) by Headset Type, 2022 to 2032

Figure 183: South Asia Market Value (US$ Million) by Application, 2022 to 2032

Figure 184: South Asia Market Value (US$ Million) by Price Range, 2022 to 2032

Figure 185: South Asia Market Value (US$ Million) by Sales Channel, 2022 to 2032

Figure 186: South Asia Market Value (US$ Million) by Country, 2022 to 2032

Figure 187: South Asia Market Value (US$ Million) Analysis by Country, 2017 to 2032

Figure 188: South Asia Market Volume Analysis by Country, 2017 to 2032

Figure 189: South Asia Market Value Share (%) and BPS Analysis by Country, 2022 to 2032

Figure 190: South Asia Market Y-o-Y Growth (%) Projections by Country, 2022 to 2032

Figure 191: South Asia Market Value (US$ Million) Analysis by Technology, 2017 to 2032

Figure 192: South Asia Market Volume Analysis by Technology, 2017 to 2032

Figure 193: South Asia Market Value Share (%) and BPS Analysis by Technology, 2022 to 2032

Figure 194: South Asia Market Y-o-Y Growth (%) Projections by Technology, 2022 to 2032

Figure 195: South Asia Market Value (US$ Million) Analysis by Headset Type, 2017 to 2032

Figure 196: South Asia Market Volume Analysis by Headset Type, 2017 to 2032

Figure 197: South Asia Market Value Share (%) and BPS Analysis by Headset Type, 2022 to 2032

Figure 198: South Asia Market Y-o-Y Growth (%) Projections by Headset Type, 2022 to 2032

Figure 199: South Asia Market Value (US$ Million) Analysis by Application, 2017 to 2032

Figure 200: South Asia Market Volume Analysis by Application, 2017 to 2032

Figure 201: South Asia Market Value Share (%) and BPS Analysis by Application, 2022 to 2032

Figure 202: South Asia Market Y-o-Y Growth (%) Projections by Application, 2022 to 2032

Figure 203: South Asia Market Value (US$ Million) Analysis by Price Range, 2017 to 2032

Figure 204: South Asia Market Volume Analysis by Price Range, 2017 to 2032

Figure 205: South Asia Market Value Share (%) and BPS Analysis by Price Range, 2022 to 2032

Figure 206: South Asia Market Y-o-Y Growth (%) Projections by Price Range, 2022 to 2032

Figure 207: South Asia Market Value (US$ Million) Analysis by Sales Channel, 2017 to 2032

Figure 208: South Asia Market Volume Analysis by Sales Channel, 2017 to 2032

Figure 209: South Asia Market Value Share (%) and BPS Analysis by Sales Channel, 2022 to 2032

Figure 210: South Asia Market Y-o-Y Growth (%) Projections by Sales Channel, 2022 to 2032

Figure 211: South Asia Market Attractiveness by Technology, 2022 to 2032

Figure 212: South Asia Market Attractiveness by Headset Type, 2022 to 2032

Figure 213: South Asia Market Attractiveness by Application, 2022 to 2032

Figure 214: South Asia Market Attractiveness by Price Range, 2022 to 2032

Figure 215: South Asia Market Attractiveness by Sales Channel, 2022 to 2032

Figure 216: South Asia Market Attractiveness by Country, 2022 to 2032

Figure 217: Oceania Market Value (US$ Million) by Technology, 2022 to 2032

Figure 218: Oceania Market Value (US$ Million) by Headset Type, 2022 to 2032

Figure 219: Oceania Market Value (US$ Million) by Application, 2022 to 2032

Figure 220: Oceania Market Value (US$ Million) by Price Range, 2022 to 2032

Figure 221: Oceania Market Value (US$ Million) by Sales Channel, 2022 to 2032

Figure 222: Oceania Market Value (US$ Million) by Country, 2022 to 2032

Figure 223: Oceania Market Value (US$ Million) Analysis by Country, 2017 to 2032

Figure 224: Oceania Market Volume Analysis by Country, 2017 to 2032

Figure 225: Oceania Market Value Share (%) and BPS Analysis by Country, 2022 to 2032

Figure 226: Oceania Market Y-o-Y Growth (%) Projections by Country, 2022 to 2032

Figure 227: Oceania Market Value (US$ Million) Analysis by Technology, 2017 to 2032

Figure 228: Oceania Market Volume Analysis by Technology, 2017 to 2032

Figure 229: Oceania Market Value Share (%) and BPS Analysis by Technology, 2022 to 2032

Figure 230: Oceania Market Y-o-Y Growth (%) Projections by Technology, 2022 to 2032

Figure 231: Oceania Market Value (US$ Million) Analysis by Headset Type, 2017 to 2032

Figure 232: Oceania Market Volume Analysis by Headset Type, 2017 to 2032

Figure 233: Oceania Market Value Share (%) and BPS Analysis by Headset Type, 2022 to 2032

Figure 234: Oceania Market Y-o-Y Growth (%) Projections by Headset Type, 2022 to 2032

Figure 235: Oceania Market Value (US$ Million) Analysis by Application, 2017 to 2032

Figure 236: Oceania Market Volume Analysis by Application, 2017 to 2032

Figure 237: Oceania Market Value Share (%) and BPS Analysis by Application, 2022 to 2032

Figure 238: Oceania Market Y-o-Y Growth (%) Projections by Application, 2022 to 2032

Figure 239: Oceania Market Value (US$ Million) Analysis by Price Range, 2017 to 2032

Figure 240: Oceania Market Volume Analysis by Price Range, 2017 to 2032

Figure 241: Oceania Market Value Share (%) and BPS Analysis by Price Range, 2022 to 2032

Figure 242: Oceania Market Y-o-Y Growth (%) Projections by Price Range, 2022 to 2032

Figure 243: Oceania Market Value (US$ Million) Analysis by Sales Channel, 2017 to 2032

Figure 244: Oceania Market Volume Analysis by Sales Channel, 2017 to 2032

Figure 245: Oceania Market Value Share (%) and BPS Analysis by Sales Channel, 2022 to 2032

Figure 246: Oceania Market Y-o-Y Growth (%) Projections by Sales Channel, 2022 to 2032

Figure 247: Oceania Market Attractiveness by Technology, 2022 to 2032

Figure 248: Oceania Market Attractiveness by Headset Type, 2022 to 2032

Figure 249: Oceania Market Attractiveness by Application, 2022 to 2032

Figure 250: Oceania Market Attractiveness by Price Range, 2022 to 2032

Figure 251: Oceania Market Attractiveness by Sales Channel, 2022 to 2032

Figure 252: Oceania Market Attractiveness by Country, 2022 to 2032

Figure 253: MEA Market Value (US$ Million) by Technology, 2022 to 2032

Figure 254: MEA Market Value (US$ Million) by Headset Type, 2022 to 2032

Figure 255: MEA Market Value (US$ Million) by Application, 2022 to 2032

Figure 256: MEA Market Value (US$ Million) by Price Range, 2022 to 2032

Figure 257: MEA Market Value (US$ Million) by Sales Channel, 2022 to 2032

Figure 258: MEA Market Value (US$ Million) by Country, 2022 to 2032

Figure 259: MEA Market Value (US$ Million) Analysis by Country, 2017 to 2032

Figure 260: MEA Market Volume Analysis by Country, 2017 to 2032

Figure 261: MEA Market Value Share (%) and BPS Analysis by Country, 2022 to 2032

Figure 262: MEA Market Y-o-Y Growth (%) Projections by Country, 2022 to 2032

Figure 263: MEA Market Value (US$ Million) Analysis by Technology, 2017 to 2032

Figure 264: MEA Market Volume Analysis by Technology, 2017 to 2032

Figure 265: MEA Market Value Share (%) and BPS Analysis by Technology, 2022 to 2032

Figure 266: MEA Market Y-o-Y Growth (%) Projections by Technology, 2022 to 2032

Figure 267: MEA Market Value (US$ Million) Analysis by Headset Type, 2017 to 2032

Figure 268: MEA Market Volume Analysis by Headset Type, 2017 to 2032

Figure 269: MEA Market Value Share (%) and BPS Analysis by Headset Type, 2022 to 2032

Figure 270: MEA Market Y-o-Y Growth (%) Projections by Headset Type, 2022 to 2032

Figure 271: MEA Market Value (US$ Million) Analysis by Application, 2017 to 2032

Figure 272: MEA Market Volume Analysis by Application, 2017 to 2032

Figure 273: MEA Market Value Share (%) and BPS Analysis by Application, 2022 to 2032

Figure 274: MEA Market Y-o-Y Growth (%) Projections by Application, 2022 to 2032

Figure 275: MEA Market Value (US$ Million) Analysis by Price Range, 2017 to 2032

Figure 276: MEA Market Volume Analysis by Price Range, 2017 to 2032

Figure 277: MEA Market Value Share (%) and BPS Analysis by Price Range, 2022 to 2032

Figure 278: MEA Market Y-o-Y Growth (%) Projections by Price Range, 2022 to 2032

Figure 279: MEA Market Value (US$ Million) Analysis by Sales Channel, 2017 to 2032

Figure 280: MEA Market Volume Analysis by Sales Channel, 2017 to 2032

Figure 281: MEA Market Value Share (%) and BPS Analysis by Sales Channel, 2022 to 2032

Figure 282: MEA Market Y-o-Y Growth (%) Projections by Sales Channel, 2022 to 2032

Figure 283: MEA Market Attractiveness by Technology, 2022 to 2032

Figure 284: MEA Market Attractiveness by Headset Type, 2022 to 2032

Figure 285: MEA Market Attractiveness by Application, 2022 to 2032

Figure 286: MEA Market Attractiveness by Price Range, 2022 to 2032

Figure 287: MEA Market Attractiveness by Sales Channel, 2022 to 2032

Figure 288: MEA Market Attractiveness by Country, 2022 to 2032

Explore Consumer Product Insights

View Reports

Clip-On Headphones Market