Coagulants Market Size and Share Forecast Outlook 2025 to 2035

The global coagulants market is worth USD 3.9 billion in 2025 and is expected to reach USD 6.1 billion by 2035, reflecting a CAGR of 5.7%.
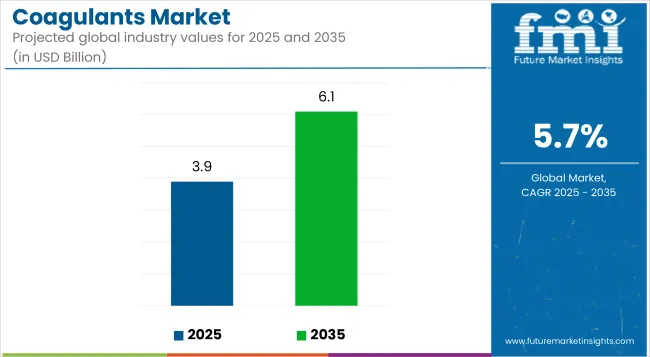
Quick Stats for Coagulants Market

  • Market Value (2025): USD 3.9 billion
  • Forecast Value (2035): USD 6.1 billion
  • Forecast CAGR: 5.7%
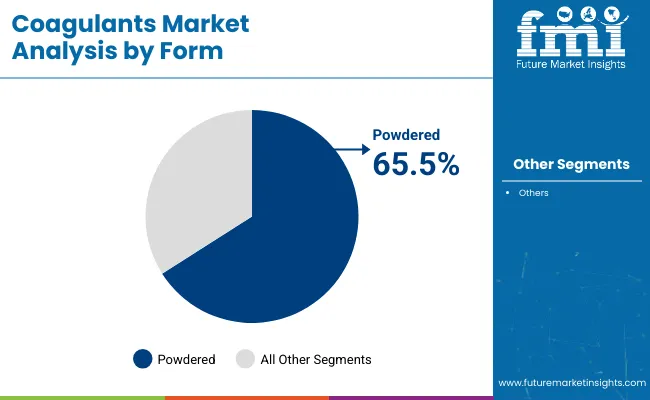
  • Form Leader in 2025: Powder Coagulants (65.5% Market Share)
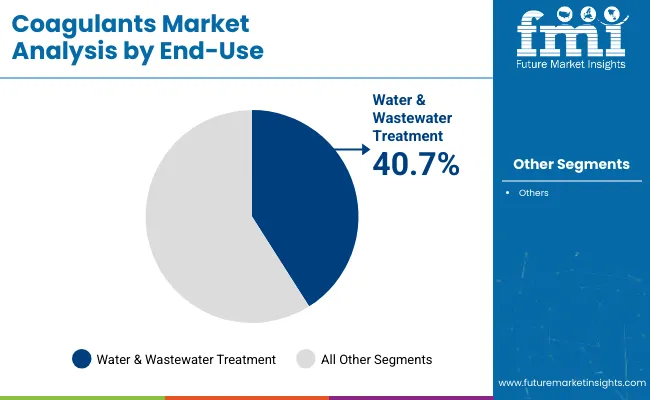
  • Top End-Use Segment: Water & Wastewater Treatment (40.7% Market Share)
  • Key Growth Region: Asia Pacific (fastest-growing market in Japan with 8.5% CAGR)

Coagulants Market

Metric Values
Estimated Size (2025E) USD 3.9 billion
Projected Value (2035F) USD 6.1 billion
CAGR (2025 to 2035) 5.7%

Factors driving this expansion include increased demand for clean water, rising urban populations, and stricter environmental regulations worldwide. Rapid industrialization in emerging economies, along with the growing need for efficient wastewater treatment technologies, is further accelerating market growth.

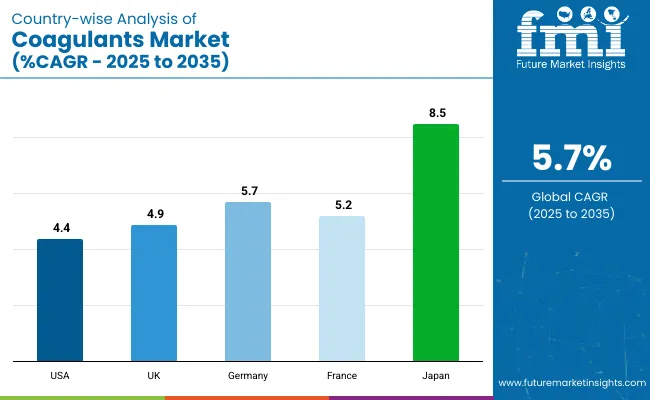
The USA is anticipated to hold the largest market share by 2035, growing at a CAGR of 4.4%, driven by its oil and gas industry expansion. Japan is expected to register the fastest growth at a prominent CAGR of 8.5%.

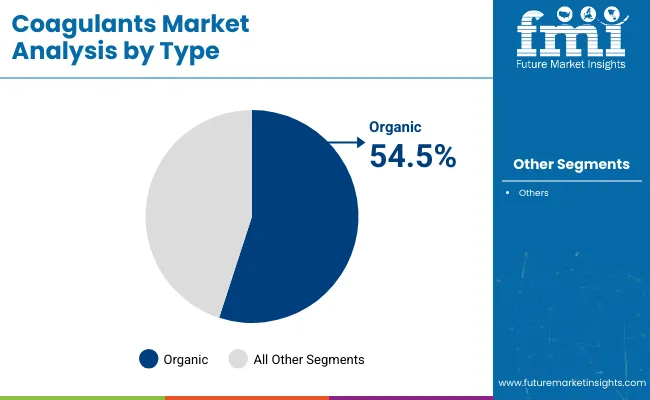
Germany and France are forecasted to grow at significant rates, with respective CAGRs of 5.7% and 5.2%, driven by rising urban populations and increased government focus on water quality. The powder form of coagulants is projected to hold 65.5% of the market share, while organic coagulants by type segment accounts for a share of 54.5% in 2025.

The market holds a significant share within the broader water treatment and specialty chemical sectors. It is estimated to account for approximately 18-22% of the Water treatment chemicals market, given its essential role in primary treatment stages. Within the wastewater treatment market, coagulants contribute nearly 15-18%, as they are fundamental in industrial and municipal effluent processing.

In the specialty chemicals market, coagulants represent a more niche portion, contributing around 5-7%. Within the industrial water management market, their share ranges from 10-12%, especially in sectors like oil & gas and pulp & paper that demand continuous water purification processes.

Coagulants Market Analysis by Top Investment Segments

The global coagulants market is segmented by type, end-use, form, and region. By type, it is segmented intoorganic, inorganic, and organic-inorganic blends. Byend-use, it includes water & wastewater treatment, pulp and paper, oil & gas, agriculture and others (includes textiles, food processing, chemical manufacturing). By form, it is segmented into powder and liquid. By region, it covers North America, Latin America, Western Europe, Eastern Europe, East Asia, South Asia,the Pacific, the Middle East and Africa.

By Type, Organic Coagulants Account for 54.5% of the Market Share

Organic coagulants are projected to lead the coagulant type segment with a 54.5% market share in 2025, driven by their biodegradable properties and lower sludge production. Among them, PolyDADMACs are widely used in municipal and industrial water treatment due to their high charge density and effectiveness across a broad pH range.
  • Organic coagulants offer higher efficiency at lower dosages
  • Polyamines and PolyDADMACs are favored for their rapid flocculation capability
  • Organic options reduce environmental load and disposal costs
  • Regulatory pressure is accelerating the shift from inorganic to organic

Coagulants Market By Type

By End-Use, Water & Wastewater Treatment Accounts for 40.7% of the Market Share

Water & wastewater treatment is expected to maintain dominance with a 40.7% share in 2025, underpinned by rising urbanization and municipal infrastructure investments. Coagulants are essential in removing solids, heavy metals, and organic pollutants, particularly in densely populated countries like India and China. The increasing stringency of effluent discharge standards and the need to reuse treated water are key contributors to sustained demand in this segment.
  • Urban growth drives demand for municipal water purification
  • Government programs in Asia are prioritizing clean water access
  • Industrial effluent management adds further application scope
  • Public-private partnerships support infrastructure upgrades

Coagulants Market By End Use

By Form, Powdered Coagulants Account for 65.5% of the Market Share

Powdered coagulants are projected to account for 65.5% of the market in 2025, thanks to their stability, ease of transportation, and superior shelf life. Their versatility in dosing and faster dissolution rate makes them suitable for both batch and continuous operations across industries. They are especially preferred in remote or infrastructure-poor regions where liquid handling systems are limited.
  • Lower transportation and storage costs compared to liquids
  • Effective across wide pH and temperature ranges
  • Ideal for emergency or mobile water treatment setups
  • Reduces sludge volume and operational costs

Coagulants Market By Form

Top Coagulants Market Dynamics

Recent Trends in the Coagulants Market

  • Increasing adoption of organic and bio-based coagulants to meet sustainability goals.
  • Rising use of nanotechnology and hybrid coagulant formulations for targeted contaminant removal.
  • Growth in customized coagulant solutions tailored to specific industrial applications.
  • Expanding application of powdered coagulants in remote and mobile water treatment setups.

Key Challenges Impacting Market Growth
  • High cost of eco-friendly coagulants compared to traditional alternatives.
  • Stringent regulatory frameworks are delaying product approvals and regional entry.
  • Limited awareness and technical expertise in low-income regions.
  • Challenges in sludge disposal and secondary pollution from treatment residues.

Analyzing Top Countries Manufacturing, Using and Supplying Coagulants

Country Wise Analysis Of Coagulants Market

Among the top five countries, Japan is projected to witness the fastest growth in the coagulants market with a CAGR of 8.5% from 2025 to 2035, driven by advanced wastewater recycling and AI-based treatment systems.

Germany and France follow with CAGRs of 5.7% and 5.2%, respectively, supported by strong environmental regulations and innovations in coagulant formulations. The United Kingdom is expected to expand at a CAGR of 4.9%, driven by aging infrastructure upgrades. The United States, despite its market size, will grow at a relatively modest CAGR of 4.4%, primarily influenced by its oil & gas sector needs.

The report covers an in-depth analysis of 40+ countries; five top-performing OECD countries are highlighted below.

United States Coagulants Market Analysis

The USA coagulants revenue is projected to grow at a CAGR of 4.4% from 2025 to 2035, driven by the increasing need for effective wastewater treatment in the oil & gas sector. As one of the world’s top oil producers, the country generates vast volumes of produced water that require advanced separation and purification technologies. Demand for organic coagulants is increasing due to their environmental compatibility and performance benefits.

  • Expansion in oil & gas production increases wastewater treatment demand.
  • Shift toward organic coagulants to reduce environmental risks.
  • Advanced infrastructure enables large-scale coagulant adoption.

Coagulants Demand Analysis in the United Kingdom

The coagulants market in the UK is expected to expand at a moderate CAGR of 4.9% during the forecast period, bolstered by stringent water quality regulations and the country’s emphasis on sustainable water treatment.

The UK’s aging water infrastructure requires frequent upgrades, pushing demand for high-efficiency coagulants. Industrial sectors like food processing and pharmaceuticals are key contributors to wastewater volumes.

  • Aging infrastructure drives innovation in treatment technologies.
  • Industrial users seek sustainable and compliant solutions.
  • Government policies incentivize advanced water treatment.

Germany Coagulants Sales Analysis

The revenue from coagulants in Germany is forecasted to rise at a CAGR of 5.7% between 2025 and 2035. Advanced coagulants, especially those based on nanotechnology and hybrid organic-inorganic blends, are seeing rapid adoption.

Germany’s strong environmental regulations and its leadership in industrial water treatment make it a hotspot for innovation. Power generation and municipal utilities are the leading application areas, especially in regions facing persistent groundwater contamination.

  • Nanotechnology-enhanced coagulants are gaining momentum.
  • Strict environmental laws accelerate product innovation.
  • High share of sales from municipal and industrial sectors.

Coagulants Demand Analysis in France

The sales of coagulants in France are projected to experience a steady CAGR of 5.2% over the 2025-2035 period, supported by rising environmental consciousness and government mandates on pollution control. The country is investing in decentralized water treatment facilities, particularly in rural areas, to improve access to clean water. The demand for organic coagulants is increasing, especially in the agriculture and food processing sectors.

  • Rural infrastructure upgrades drive regional adoption.
  • Organic formulations are favored in the agriculture and food sectors.
  • Strong focus on collaborative R&D in water treatment.

Japan Coagulants Industry Analysis

The coagulants industry in Japan is estimated to register a robust CAGR of 8.5% from 2025 to 2035, driven by urban density, industrial complexity, and limited freshwater availability. Advanced wastewater recycling technologies are heavily deployed in metropolitan areas. Japan is investing in AI-integrated water treatment systems, where coagulants play a vital role in smart dosing and flocculation processes.

  • Urban wastewater recycling propels coagulant usage.
  • High-tech water systems require precise coagulant formulations.
  • R&D fosters the development of sludge-reducing products.

Leading Coagulants Suppliers

The global market is moderately fragmented, with a mix of multinational corporations and regional specialists shaping competitive dynamics. Prominent suppliers such as BASF SE, SNF Group, Solenis, and Kemira lead the industry, leveraging economies of scale, product innovation, and integrated service models. These Tier-1 companies maintain dominance by investing in R&D, offering customized formulations, and building robust supply chains to serve both municipal and industrial customers globally.

Strategic initiatives among leading players include pricing competitiveness in emerging markets, sustainability-focused innovations like bio-based and hybrid coagulants, and inorganic growth through acquisitions. For instance, SNF Group continues to expand production capabilities, while Ecolab and Kemira are focusing on digital monitoring systems for dosing accuracy.

Companies like Mitsubishi Chemical and Feralco are forging long-term partnerships with government and private sector utilities to increase their footprint in Asia and Europe, respectively. Meanwhile, USA-based players such as Solenis and ChemTreat are enhancing service models with real-time analytics and automation integration.

Recent Coagulants Market News

In November 2024, BASF inked a deal with Acies Bio to advance sustainable production in personal and home care ingredients.

Coagulants Market Report Scope

Report Attributes Details
Current Total Market Size (2025) USD 3.9 billion
Projected Market Size (2035) USD 6.1 billion
CAGR (2025 to 2035) 5.7%
Base Year for Estimation 2024
Historical Period 2020 to 2024
Projections Period 2025 to 2035
Market Analysis Parameters Revenue in USD billion/Volume in metric tons
By Type Organic (Polyamines, PolyDADMACs, Melamine Formaldehyde, Others), Inorganic (Aluminum Sulfate, Ferric Chloride, PAC, PAS, Ferric Sulfate, Others), Organic & Inorganic Blend
By End-Use Water & Wastewater Treatment, Pulp and Paper, Oil & Gas, Agriculture, Others (Food Processing, Textiles, Chemicals)
By Form Powder, Liquid
Regions Covered North America, Latin America, Western Europe, Eastern Europe, East Asia, South Asia & Pacific, Middle East & Africa
Countries Covered United States, Canada, United Kingdom, Germany, France, China, Japan, South Korea, Brazil, Australia
Key Players BASF SE, SNF Group, Solenis, Kemira, Mitsubishi Chemical Holding Company, Feralco AB, Avista Technologies Inc., ChemTreat Inc., Buckman, Ecolab, SUEZ, GE Water & Process Technologies, AkzoNobel, Ashland, Italmatch Chemicals, Kurita Water Industries Ltd., Nalco Water, an Ecolab Company, Accepta, SNF Floerger, Aries Chemical
Additional Attributes Dollar sales by value, market share analysis by region, and country-wise analysis

Key Segments

By Type:

By Type, the segment has been categorized into Organic (PolyDADMACs, Polyamines, Formaldehyde Melamine and Others) and Inorganic (Polyaluminum Chloride, Ferric Chloride, Aluminum Sulfate, PolyaluminumSulfate, Ferric Sulfate, and Others)

By End-Use:

By end use, industry included Water & Wastewater Treatment, Pulp, and Paper, Oil & Gas, Agriculture, and others

By Form:

The form includes powder and Liquid

By Region:

Industry analysis has been carried out in key countries of North America, Latin America, Europe, East Asia, South Asia, Oceania, and the Middle East & Africa.

Table of Content

  1. Executive Summary
    • Global Market Outlook
    • Demand-side Trends
    • Supply-side Trends
    • Technology Roadmap Analysis
    • Analysis and Recommendations
  2. Market Overview
    • Market Coverage / Taxonomy
    • Market Definition / Scope / Limitations
  3. Market Background
    • Market Dynamics
      • Drivers
      • Restraints
      • Opportunity
      • Trends
    • Scenario Forecast
      • Demand in Optimistic Scenario
      • Demand in Likely Scenario
      • Demand in Conservative Scenario
    • Opportunity Map Analysis
    • Product Life Cycle Analysis
    • Supply Chain Analysis
      • Supply Side Participants and their Roles
        • Producers
        • Mid-Level Participants (Traders/ Agents/ Brokers)
        • Wholesalers and Distributors
      • Value Added and Value Created at Node in the Supply Chain
      • List of Raw Material Suppliers
      • List of Existing and Potential Buyer’s
    • Investment Feasibility Matrix
    • Value Chain Analysis
      • Profit Margin Analysis
      • Wholesalers and Distributors
      • Retailers
    • PESTLE and Porter’s Analysis
    • Regulatory Landscape
      • By Key Regions
      • By Key Countries
    • Regional Parent Market Outlook
    • Production and Consumption Statistics
    • Import and Export Statistics
  4. Global Market Analysis 2020 to 2024 and Forecast, 2025 to 2035
    • Historical Market Size Value (USD Billion) & Volume (metric tons) Analysis, 2020 to 2024
    • Current and Future Market Size Value (USD Billion) & Volume (metric tons) Projections, 2025 to 2035
      • Y-o-Y Growth Trend Analysis
      • Absolute $ Opportunity Analysis
  5. Global Market Pricing Analysis 2020 to 2024 and Forecast 2025 to 2035
  6. Global Market Analysis 2020 to 2024 and Forecast 2025 to 2035, By Type
    • Introduction / Key Findings
    • Historical Market Size Value (USD Billion) & Volume (metric tons) Analysis By Type, 2020 to 2024
    • Current and Future Market Size Value (USD Billion) & Volume (metric tons) Analysis and Forecast By Type, 2025 to 2035
      • Organic
        • Polyamines
        • PolyDADMACs
        • Melamine Formaldehyde
        • Others
      • Inorganic
        • Aluminum Sulfate
        • Ferric Chloride
        • Polyaluminum Chloride (PAC)
        • Polyaluminum Sulfate (PAS)
        • Ferric Sulfate
        • Others
      • Organic & Inorganic Blend
    • Y-o-Y Growth Trend Analysis By Type, 2020 to 2024
    • Absolute $ Opportunity Analysis By Type, 2025 to 2035
  7. Global Market Analysis 2020 to 2024 and Forecast 2025 to 2035, By End-Use
    • Introduction / Key Findings
    • Historical Market Size Value (USD Billion) & Volume (metric tons) Analysis By End-Use, 2020 to 2024
    • Current and Future Market Size Value (USD Billion) & Volume (metric tons) Analysis and Forecast By End-Use, 2025 to 2035
      • Water & Wastewater Treatment
      • Pulp and Paper
      • Oil & Gas
      • Agriculture
      • Others
    • Y-o-Y Growth Trend Analysis By End-Use, 2020 to 2024
    • Absolute $ Opportunity Analysis By End-Use, 2025 to 2035
  8. Global Market Analysis 2020 to 2024 and Forecast 2025 to 2035, By Form
    • Introduction / Key Findings
    • Historical Market Size Value (USD Billion) & Volume (metric tons) Analysis By Form, 2020 to 2024
    • Current and Future Market Size Value (USD Billion) & Volume (metric tons) Analysis and Forecast By Form, 2025 to 2035
      • Powder
      • Liquid
    • Y-o-Y Growth Trend Analysis By Form, 2020 to 2024
    • Absolute $ Opportunity Analysis By Form, 2025 to 2035
  9. Global Market Analysis 2020 to 2024 and Forecast 2025 to 2035, By Region
    • Introduction
    • Historical Market Size Value (USD Billion) & Volume (metric tons) Analysis By Region, 2020 to 2024
    • Current Market Size Value (USD Billion) & Volume (metric tons) Analysis and Forecast By Region, 2025 to 2035
      • North America
      • Latin America
      • Western Europe
      • Eastern Europe
      • East Asia
      • South Asia & Pacific
      • Middle East and Africa
    • Market Attractiveness Analysis By Region
  10. North America Market Analysis 2020 to 2024 and Forecast 2025 to 2035, By Country
    • Historical Market Size Value (USD Billion) & Volume (metric tons) Trend Analysis By Market Taxonomy, 2020 to 2024
    • Market Size Value (USD Billion) & Volume (metric tons) Forecast By Market Taxonomy, 2025 to 2035
      • By Country
        • USA
        • Canada
        • Mexico
      • By Type
      • By End-Use
      • By Form
    • Market Attractiveness Analysis
      • By Country
      • By Type
      • By End-Use
      • By Form
    • Key Takeaways
  11. Latin America Market Analysis 2020 to 2024 and Forecast 2025 to 2035, By Country
    • Historical Market Size Value (USD Billion) & Volume (metric tons) Trend Analysis By Market Taxonomy, 2020 to 2024
    • Market Size Value (USD Billion) & Volume (metric tons) Forecast By Market Taxonomy, 2025 to 2035
      • By Country
        • Brazil
        • Argentina
        • Rest of LATAM
      • By Type
      • By End-Use
      • By Form
    • Market Attractiveness Analysis
      • By Country
      • By Type
      • By End-Use
      • By Form
    • Key Takeaways
  12. Western Europe Market Analysis 2020 to 2024 and Forecast 2025 to 2035, By Country
    • Historical Market Size Value (USD Billion) & Volume (metric tons) Trend Analysis By Market Taxonomy, 2020 to 2024
    • Market Size Value (USD Billion) & Volume (metric tons) Forecast By Market Taxonomy, 2025 to 2035
      • By Country
        • Germany
        • Italy
        • France
        • UK
        • Spain
        • BENELUX
        • Nordic
        • Rest of W.Europe
      • By Type
      • By End-Use
      • By Form
    • Market Attractiveness Analysis
      • By Country
      • By Type
      • By End-Use
      • By Form
    • Key Takeaways
  13. Eastern Europe Market Analysis 2020 to 2024 and Forecast 2025 to 2035, By Country
    • Historical Market Size Value (USD Billion) & Volume (metric tons) Trend Analysis By Market Taxonomy, 2020 to 2024
    • Market Size Value (USD Billion) & Volume (metric tons) Forecast By Market Taxonomy, 2025 to 2035
      • By Country
        • Russia
        • Hungary
        • Poland
        • Balkan & Baltics
        • Rest of E. Europe
      • By Type
      • By End-Use
      • By Form
    • Market Attractiveness Analysis
      • By Country
      • By Type
      • By End-Use
      • By Form
    • Key Takeaways
  14. East Asia Market Analysis 2020 to 2024 and Forecast 2025 to 2035, By Country
    • Historical Market Size Value (USD Billion) & Volume (metric tons) Trend Analysis By Market Taxonomy, 2020 to 2024
    • Market Size Value (USD Billion) & Volume (metric tons) Forecast By Market Taxonomy, 2025 to 2035
      • By Country
        • China
        • Japan
        • South Korea
      • By Type
      • By End-Use
      • By Form
    • Market Attractiveness Analysis
      • By Country
      • By Type
      • By End-Use
      • By Form
    • Key Takeaways
  15. South Asia & Pacific Market Analysis 2020 to 2024 and Forecast 2025 to 2035, By Country
    • Historical Market Size Value (USD Billion) & Volume (metric tons) Trend Analysis By Market Taxonomy, 2020 to 2024
    • Market Size Value (USD Billion) & Volume (metric tons) Forecast By Market Taxonomy, 2025 to 2035
      • By Country
        • India
        • Australia & New Zealand
        • ASEAN
        • Rest of SAP
      • By Type
      • By End-Use
      • By Form
    • Market Attractiveness Analysis
      • By Country
      • By Type
      • By End-Use
      • By Form
    • Key Takeaways
  16. Middle East and Africa Market Analysis 2020 to 2024 and Forecast 2025 to 2035, By Country
    • Historical Market Size Value (USD Billion) & Volume (metric tons) Trend Analysis By Market Taxonomy, 2020 to 2024
    • Market Size Value (USD Billion) & Volume (metric tons) Forecast By Market Taxonomy, 2025 to 2035
      • By Country
        • GCC Countries
        • Northern Africa
        • South Africa
        • Turkiye
        • Rest of MEA
      • By Type
      • By End-Use
      • By Form
    • Market Attractiveness Analysis
      • By Country
      • By Type
      • By End-Use
      • By Form
    • Key Takeaways
  17. Key Countries Market Analysis
    • USA
      • Pricing Analysis
      • Market Share Analysis, 2024
        • By Type
        • By End-Use
        • By Form
    • Canada
      • Pricing Analysis
      • Market Share Analysis, 2024
        • By Type
        • By End-Use
        • By Form
    • Brazil
      • Pricing Analysis
      • Market Share Analysis, 2024
        • By Type
        • By End-Use
        • By Form
    • Mexico
      • Pricing Analysis
      • Market Share Analysis, 2024
        • By Type
        • By End-Use
        • By Form
    • Argentina
      • Pricing Analysis
      • Market Share Analysis, 2024
        • By Type
        • By End-Use
        • By Form
  18. Market Structure Analysis
    • Competition Dashboard
    • Competition Benchmarking
    • Market Share Analysis of Top Players
      • By Regional
      • By Type
      • By End-Use
      • By Form
  19. Competition Analysis
    • Competition Deep Dive
      • BASF SE (Germany)
        • Overview
        • Product Portfolio
        • Profitability by Market Segments (Product/Age /Sales Channel/Region)
        • Sales Footprint
        • Strategy Overview
          • Marketing Strategy
          • Product Strategy
          • Channel Strategy
      • SNF Group (France)
        • Overview
        • Product Portfolio
        • Profitability by Market Segments (Product/Age /Sales Channel/Region)
        • Sales Footprint
        • Strategy Overview
          • Marketing Strategy
          • Product Strategy
          • Channel Strategy
      • Solenis (USA)
        • Overview
        • Product Portfolio
        • Profitability by Market Segments (Product/Age /Sales Channel/Region)
        • Sales Footprint
        • Strategy Overview
          • Marketing Strategy
          • Product Strategy
          • Channel Strategy
      • Kemira (Finland)
        • Overview
        • Product Portfolio
        • Profitability by Market Segments (Product/Age /Sales Channel/Region)
        • Sales Footprint
        • Strategy Overview
          • Marketing Strategy
          • Product Strategy
          • Channel Strategy
      • Mitsubishi Chemical Holding Company (Japan)
        • Overview
        • Product Portfolio
        • Profitability by Market Segments (Product/Age /Sales Channel/Region)
        • Sales Footprint
        • Strategy Overview
          • Marketing Strategy
          • Product Strategy
          • Channel Strategy
      • Feralco AB (Sweden)
        • Overview
        • Product Portfolio
        • Profitability by Market Segments (Product/Age /Sales Channel/Region)
        • Sales Footprint
        • Strategy Overview
          • Marketing Strategy
          • Product Strategy
          • Channel Strategy
      • Avista Technologies Inc. (USA)
        • Overview
        • Product Portfolio
        • Profitability by Market Segments (Product/Age /Sales Channel/Region)
        • Sales Footprint
        • Strategy Overview
          • Marketing Strategy
          • Product Strategy
          • Channel Strategy
      • ChemTreat Inc. (USA)
        • Overview
        • Product Portfolio
        • Profitability by Market Segments (Product/Age /Sales Channel/Region)
        • Sales Footprint
        • Strategy Overview
          • Marketing Strategy
          • Product Strategy
          • Channel Strategy
      • Buckman (USA)
        • Overview
        • Product Portfolio
        • Profitability by Market Segments (Product/Age /Sales Channel/Region)
        • Sales Footprint
        • Strategy Overview
          • Marketing Strategy
          • Product Strategy
          • Channel Strategy
      • Ecolab (USA)
        • Overview
        • Product Portfolio
        • Profitability by Market Segments (Product/Age /Sales Channel/Region)
        • Sales Footprint
        • Strategy Overview
          • Marketing Strategy
          • Product Strategy
          • Channel Strategy
      • SUEZ (France)
        • Overview
        • Product Portfolio
        • Profitability by Market Segments (Product/Age /Sales Channel/Region)
        • Sales Footprint
        • Strategy Overview
          • Marketing Strategy
          • Product Strategy
          • Channel Strategy
      • GE Water & Process Technologies (USA)
        • Overview
        • Product Portfolio
        • Profitability by Market Segments (Product/Age /Sales Channel/Region)
        • Sales Footprint
        • Strategy Overview
          • Marketing Strategy
          • Product Strategy
          • Channel Strategy
      • AkzoNobel (Netherlands)
        • Overview
        • Product Portfolio
        • Profitability by Market Segments (Product/Age /Sales Channel/Region)
        • Sales Footprint
        • Strategy Overview
          • Marketing Strategy
          • Product Strategy
          • Channel Strategy
      • Ashland (USA)
        • Overview
        • Product Portfolio
        • Profitability by Market Segments (Product/Age /Sales Channel/Region)
        • Sales Footprint
        • Strategy Overview
          • Marketing Strategy
          • Product Strategy
          • Channel Strategy
      • Italmatch Chemicals (Italy)
        • Overview
        • Product Portfolio
        • Profitability by Market Segments (Product/Age /Sales Channel/Region)
        • Sales Footprint
        • Strategy Overview
          • Marketing Strategy
          • Product Strategy
          • Channel Strategy
      • Kurita Water Industries Ltd. (Japan)
        • Overview
        • Product Portfolio
        • Profitability by Market Segments (Product/Age /Sales Channel/Region)
        • Sales Footprint
        • Strategy Overview
          • Marketing Strategy
          • Product Strategy
          • Channel Strategy
      • Nalco Water, an Ecolab Company (USA)
        • Overview
        • Product Portfolio
        • Profitability by Market Segments (Product/Age /Sales Channel/Region)
        • Sales Footprint
        • Strategy Overview
          • Marketing Strategy
          • Product Strategy
          • Channel Strategy
      • Accepta (UK)
        • Overview
        • Product Portfolio
        • Profitability by Market Segments (Product/Age /Sales Channel/Region)
        • Sales Footprint
        • Strategy Overview
          • Marketing Strategy
          • Product Strategy
          • Channel Strategy
      • SNF Floerger (USA)
        • Overview
        • Product Portfolio
        • Profitability by Market Segments (Product/Age /Sales Channel/Region)
        • Sales Footprint
        • Strategy Overview
          • Marketing Strategy
          • Product Strategy
          • Channel Strategy
      • Aries Chemical (USA)
        • Overview
        • Product Portfolio
        • Profitability by Market Segments (Product/Age /Sales Channel/Region)
        • Sales Footprint
        • Strategy Overview
          • Marketing Strategy
          • Product Strategy
          • Channel Strategy
  20. Assumptions & Acronyms Used
  21. Research Methodology

List of Tables

  • Table 1: Global Market Value (USD Billion) Forecast by Region, 2020-2035
  • Table 2: Global Market Volume (metric tons) Forecast by Region, 2020-2035
  • Table 3: Global Market Value (USD Billion) Forecast by Type, 2020-2035
  • Table 4: Global Market Volume (metric tons) Forecast by Type, 2020-2035
  • Table 5: Global Market Value (USD Billion) Forecast by End-Use, 2020-2035
  • Table 6: Global Market Volume (metric tons) Forecast by End-Use, 2020-2035
  • Table 7: Global Market Value (USD Billion) Forecast by Form, 2020-2035
  • Table 8: Global Market Volume (metric tons) Forecast by Form, 2020-2035
  • Table 9: North America Market Value (USD Billion) Forecast by Country, 2020-2035
  • Table 10: North America Market Volume (metric tons) Forecast by Country, 2020-2035
  • Table 11: North America Market Value (USD Billion) Forecast by Type, 2020-2035
  • Table 12: North America Market Volume (metric tons) Forecast by Type, 2020-2035
  • Table 13: North America Market Value (USD Billion) Forecast by End-Use, 2020-2035
  • Table 14: North America Market Volume (metric tons) Forecast by End-Use, 2020-2035
  • Table 15: North America Market Value (USD Billion) Forecast by Form, 2020-2035
  • Table 16: North America Market Volume (metric tons) Forecast by Form, 2020-2035
  • Table 17: Latin America Market Value (USD Billion) Forecast by Country, 2020-2035
  • Table 18: Latin America Market Volume (metric tons) Forecast by Country, 2020-2035
  • Table 19: Latin America Market Value (USD Billion) Forecast by Type, 2020-2035
  • Table 20: Latin America Market Volume (metric tons) Forecast by Type, 2020-2035
  • Table 21: Latin America Market Value (USD Billion) Forecast by End-Use, 2020-2035
  • Table 22: Latin America Market Volume (metric tons) Forecast by End-Use, 2020-2035
  • Table 23: Latin America Market Value (USD Billion) Forecast by Form, 2020-2035
  • Table 24: Latin America Market Volume (metric tons) Forecast by Form, 2020-2035
  • Table 25: Western Europe Market Value (USD Billion) Forecast by Country, 2020-2035
  • Table 26: Western Europe Market Volume (metric tons) Forecast by Country, 2020-2035
  • Table 27: Western Europe Market Value (USD Billion) Forecast by Type, 2020-2035
  • Table 28: Western Europe Market Volume (metric tons) Forecast by Type, 2020-2035
  • Table 29: Western Europe Market Value (USD Billion) Forecast by End-Use, 2020-2035
  • Table 30: Western Europe Market Volume (metric tons) Forecast by End-Use, 2020-2035
  • Table 31: Western Europe Market Value (USD Billion) Forecast by Form, 2020-2035
  • Table 32: Western Europe Market Volume (metric tons) Forecast by Form, 2020-2035
  • Table 33: Eastern Europe Market Value (USD Billion) Forecast by Country, 2020-2035
  • Table 34: Eastern Europe Market Volume (metric tons) Forecast by Country, 2020-2035
  • Table 35: Eastern Europe Market Value (USD Billion) Forecast by Type, 2020-2035
  • Table 36: Eastern Europe Market Volume (metric tons) Forecast by Type, 2020-2035
  • Table 37: Eastern Europe Market Value (USD Billion) Forecast by End-Use, 2020-2035
  • Table 38: Eastern Europe Market Volume (metric tons) Forecast by End-Use, 2020-2035
  • Table 39: Eastern Europe Market Value (USD Billion) Forecast by Form, 2020-2035
  • Table 40: Eastern Europe Market Volume (metric tons) Forecast by Form, 2020-2035
  • Table 41: East Asia Market Value (USD Billion) Forecast by Country, 2020-2035
  • Table 42: East Asia Market Volume (metric tons) Forecast by Country, 2020-2035
  • Table 43: East Asia Market Value (USD Billion) Forecast by Type, 2020-2035
  • Table 44: East Asia Market Volume (metric tons) Forecast by Type, 2020-2035
  • Table 45: East Asia Market Value (USD Billion) Forecast by End-Use, 2020-2035
  • Table 46: East Asia Market Volume (metric tons) Forecast by End-Use, 2020-2035
  • Table 47: East Asia Market Value (USD Billion) Forecast by Form, 2020-2035
  • Table 48: East Asia Market Volume (metric tons) Forecast by Form, 2020-2035
  • Table 49: South Asia & Pacific Market Value (USD Billion) Forecast by Country, 2020-2035
  • Table 50: South Asia & Pacific Market Volume (metric tons) Forecast by Country, 2020-2035
  • Table 51: South Asia & Pacific Market Value (USD Billion) Forecast by Type, 2020-2035
  • Table 52: South Asia & Pacific Market Volume (metric tons) Forecast by Type, 2020-2035
  • Table 53: South Asia & Pacific Market Value (USD Billion) Forecast by End-Use, 2020-2035
  • Table 54: South Asia & Pacific Market Volume (metric tons) Forecast by End-Use, 2020-2035
  • Table 55: South Asia & Pacific Market Value (USD Billion) Forecast by Form, 2020-2035
  • Table 56: South Asia & Pacific Market Volume (metric tons) Forecast by Form, 2020-2035
  • Table 57: Middle East and Africa Market Value (USD Billion) Forecast by Country, 2020-2035
  • Table 58: Middle East and Africa Market Volume (metric tons) Forecast by Country, 2020-2035
  • Table 59: Middle East and Africa Market Value (USD Billion) Forecast by Type, 2020-2035
  • Table 60: Middle East and Africa Market Volume (metric tons) Forecast by Type, 2020-2035
  • Table 61: Middle East and Africa Market Value (USD Billion) Forecast by End-Use, 2020-2035
  • Table 62: Middle East and Africa Market Volume (metric tons) Forecast by End-Use, 2020-2035
  • Table 63: Middle East and Africa Market Value (USD Billion) Forecast by Form, 2020-2035
  • Table 64: Middle East and Africa Market Volume (metric tons) Forecast by Form, 2020-2035

List of Figures

  • Figure 1: Global Market Volume (metric tons) Forecast 2020-2035
  • Figure 2: Global Market Pricing Analysis
  • Figure 3: Global Market Value (USD Billion) Forecast 2020-2035
  • Figure 4: Global Market Value Share and BPS Analysis by Type, 2025 and 2035
  • Figure 5: Global Market Y-o-Y Growth Comparison by Type, 2025-2035
  • Figure 6: Global Market Attractiveness Analysis by Type
  • Figure 7: Global Market Value Share and BPS Analysis by End-Use, 2025 and 2035
  • Figure 8: Global Market Y-o-Y Growth Comparison by End-Use, 2025-2035
  • Figure 9: Global Market Attractiveness Analysis by End-Use
  • Figure 10: Global Market Value Share and BPS Analysis by Form, 2025 and 2035
  • Figure 11: Global Market Y-o-Y Growth Comparison by Form, 2025-2035
  • Figure 12: Global Market Attractiveness Analysis by Form
  • Figure 13: Global Market Value (USD Billion) Share and BPS Analysis by Region, 2025 and 2035
  • Figure 14: Global Market Y-o-Y Growth Comparison by Region, 2025-2035
  • Figure 15: Global Market Attractiveness Analysis by Region
  • Figure 16: North America Market Incremental $ Opportunity, 2025-2035
  • Figure 17: Latin America Market Incremental $ Opportunity, 2025-2035
  • Figure 18: Western Europe Market Incremental $ Opportunity, 2025-2035
  • Figure 19: Eastern Europe Market Incremental $ Opportunity, 2025-2035
  • Figure 20: East Asia Market Incremental $ Opportunity, 2025-2035
  • Figure 21: South Asia & Pacific Market Incremental $ Opportunity, 2025-2035
  • Figure 22: Middle East and Africa Market Incremental $ Opportunity, 2025-2035
  • Figure 23: North America Market Value Share and BPS Analysis by Country, 2025 and 2035
  • Figure 24: North America Market Value Share and BPS Analysis by Type, 2025 and 2035
  • Figure 25: North America Market Y-o-Y Growth Comparison by Type, 2025-2035
  • Figure 26: North America Market Attractiveness Analysis by Type
  • Figure 27: North America Market Value Share and BPS Analysis by End-Use, 2025 and 2035
  • Figure 28: North America Market Y-o-Y Growth Comparison by End-Use, 2025-2035
  • Figure 29: North America Market Attractiveness Analysis by End-Use
  • Figure 30: North America Market Value Share and BPS Analysis by Form, 2025 and 2035
  • Figure 31: North America Market Y-o-Y Growth Comparison by Form, 2025-2035
  • Figure 32: North America Market Attractiveness Analysis by Form
  • Figure 33: Latin America Market Value Share and BPS Analysis by Country, 2025 and 2035
  • Figure 34: Latin America Market Value Share and BPS Analysis by Type, 2025 and 2035
  • Figure 35: Latin America Market Y-o-Y Growth Comparison by Type, 2025-2035
  • Figure 36: Latin America Market Attractiveness Analysis by Type
  • Figure 37: Latin America Market Value Share and BPS Analysis by End-Use, 2025 and 2035
  • Figure 38: Latin America Market Y-o-Y Growth Comparison by End-Use, 2025-2035
  • Figure 39: Latin America Market Attractiveness Analysis by End-Use
  • Figure 40: Latin America Market Value Share and BPS Analysis by Form, 2025 and 2035
  • Figure 41: Latin America Market Y-o-Y Growth Comparison by Form, 2025-2035
  • Figure 42: Latin America Market Attractiveness Analysis by Form
  • Figure 43: Western Europe Market Value Share and BPS Analysis by Country, 2025 and 2035
  • Figure 44: Western Europe Market Value Share and BPS Analysis by Type, 2025 and 2035
  • Figure 45: Western Europe Market Y-o-Y Growth Comparison by Type, 2025-2035
  • Figure 46: Western Europe Market Attractiveness Analysis by Type
  • Figure 47: Western Europe Market Value Share and BPS Analysis by End-Use, 2025 and 2035
  • Figure 48: Western Europe Market Y-o-Y Growth Comparison by End-Use, 2025-2035
  • Figure 49: Western Europe Market Attractiveness Analysis by End-Use
  • Figure 50: Western Europe Market Value Share and BPS Analysis by Form, 2025 and 2035
  • Figure 51: Western Europe Market Y-o-Y Growth Comparison by Form, 2025-2035
  • Figure 52: Western Europe Market Attractiveness Analysis by Form
  • Figure 53: Eastern Europe Market Value Share and BPS Analysis by Country, 2025 and 2035
  • Figure 54: Eastern Europe Market Value Share and BPS Analysis by Type, 2025 and 2035
  • Figure 55: Eastern Europe Market Y-o-Y Growth Comparison by Type, 2025-2035
  • Figure 56: Eastern Europe Market Attractiveness Analysis by Type
  • Figure 57: Eastern Europe Market Value Share and BPS Analysis by End-Use, 2025 and 2035
  • Figure 58: Eastern Europe Market Y-o-Y Growth Comparison by End-Use, 2025-2035
  • Figure 59: Eastern Europe Market Attractiveness Analysis by End-Use
  • Figure 60: Eastern Europe Market Value Share and BPS Analysis by Form, 2025 and 2035
  • Figure 61: Eastern Europe Market Y-o-Y Growth Comparison by Form, 2025-2035
  • Figure 62: Eastern Europe Market Attractiveness Analysis by Form
  • Figure 63: East Asia Market Value Share and BPS Analysis by Country, 2025 and 2035
  • Figure 64: East Asia Market Value Share and BPS Analysis by Type, 2025 and 2035
  • Figure 65: East Asia Market Y-o-Y Growth Comparison by Type, 2025-2035
  • Figure 66: East Asia Market Attractiveness Analysis by Type
  • Figure 67: East Asia Market Value Share and BPS Analysis by End-Use, 2025 and 2035
  • Figure 68: East Asia Market Y-o-Y Growth Comparison by End-Use, 2025-2035
  • Figure 69: East Asia Market Attractiveness Analysis by End-Use
  • Figure 70: East Asia Market Value Share and BPS Analysis by Form, 2025 and 2035
  • Figure 71: East Asia Market Y-o-Y Growth Comparison by Form, 2025-2035
  • Figure 72: East Asia Market Attractiveness Analysis by Form
  • Figure 73: South Asia & Pacific Market Value Share and BPS Analysis by Country, 2025 and 2035
  • Figure 74: South Asia & Pacific Market Value Share and BPS Analysis by Type, 2025 and 2035
  • Figure 75: South Asia & Pacific Market Y-o-Y Growth Comparison by Type, 2025-2035
  • Figure 76: South Asia & Pacific Market Attractiveness Analysis by Type
  • Figure 77: South Asia & Pacific Market Value Share and BPS Analysis by End-Use, 2025 and 2035
  • Figure 78: South Asia & Pacific Market Y-o-Y Growth Comparison by End-Use, 2025-2035
  • Figure 79: South Asia & Pacific Market Attractiveness Analysis by End-Use
  • Figure 80: South Asia & Pacific Market Value Share and BPS Analysis by Form, 2025 and 2035
  • Figure 81: South Asia & Pacific Market Y-o-Y Growth Comparison by Form, 2025-2035
  • Figure 82: South Asia & Pacific Market Attractiveness Analysis by Form
  • Figure 83: Middle East and Africa Market Value Share and BPS Analysis by Country, 2025 and 2035
  • Figure 84: Middle East and Africa Market Value Share and BPS Analysis by Type, 2025 and 2035
  • Figure 85: Middle East and Africa Market Y-o-Y Growth Comparison by Type, 2025-2035
  • Figure 86: Middle East and Africa Market Attractiveness Analysis by Type
  • Figure 87: Middle East and Africa Market Value Share and BPS Analysis by End-Use, 2025 and 2035
  • Figure 88: Middle East and Africa Market Y-o-Y Growth Comparison by End-Use, 2025-2035
  • Figure 89: Middle East and Africa Market Attractiveness Analysis by End-Use
  • Figure 90: Middle East and Africa Market Value Share and BPS Analysis by Form, 2025 and 2035
  • Figure 91: Middle East and Africa Market Y-o-Y Growth Comparison by Form, 2025-2035
  • Figure 92: Middle East and Africa Market Attractiveness Analysis by Form
  • Figure 93: Global Market - Tier Structure Analysis
  • Figure 94: Global Market - Company Share Analysis

Frequently Asked Questions

What is the projected size of the coagulants market in 2025?

The market size is valued at USD 3.9 billion in 2025.

What is the outlook on the coagulants market demand by 2035?

The market is forecasted to reach USD 6.1 billion by 2035, reflecting a CAGR of 5.7%.

Which product form will lead the coagulants market in 2025?

Powdered coagulants are expected to lead with a 65.5% market share in 2025.

Which application is expected to dominate the coagulants market in 2025?

Water & wastewater treatment is projected to account for 40.7% of the market in 2025.

Which country is projected to be the fastest-growing coagulants market?

Japan is anticipated to grow at the fastest pace with a CAGR of 8.5% from 2025 to 2035.

Explore Similar Insights

Future Market Insights

Coagulants Market