Reports

- Global Locations -

Headquarters

Future Market Insights, Inc.

Christiana Corporate, 200
Continental Drive, Suite 401,
Newark, Delaware - 19713,
United States

T: +1-845-579-5705

Americas

Future Market Insights, Inc.

616 Corporate Way, Suite 2-9018,
Valley Cottage, NY 10989, United States

T: +1-347-918-3531

MEA

Future Market Insights

1602-6 Jumeirah Bay X2 Tower, Plot No: JLT-PH2-X2A,
Jumeirah Lakes Towers, Dubai,
United Arab Emirates

Europe

Future Market Insights

3rd Floor, 207 Regent Street,
W1B 3HH London
United Kingdom

T: + 44 (0) 20 8123 9659
D: +44 (0) 20 3287 4268

Asia Pacific

Future Market Insights

IndiaLand Global Tech Park, Unit UG-1, Behind Grand HighStreet, Phase 1, Hinjawadi, MH, Pune – 411057, India

Cubitainer Market Outlook (2022-2032)

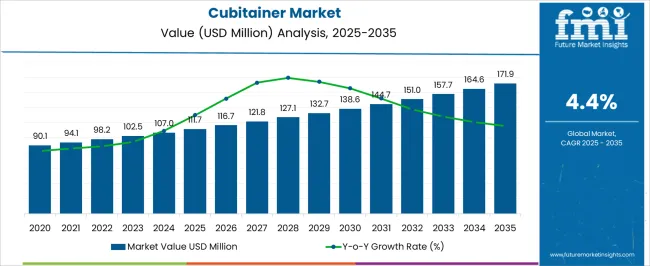
[250 Pages Report] The demand for cubitainer is projected to grow at a CAGR of 4.4% during 2022-2032. The cubitainer market size is likely to be valued at US$ 98.2 Mn in 2022, and exhibit a revenue growth of US$ 151.1 Mn by 2032.

The sales of cubitainer are expected to rise with the growth in per capita income of the population, along with the increasing disposable income of the middle class population, which surges people to invest money on alcoholic and energy drinks. However, governments across the world may implement stringent rules and regulations regarding packaging materials which may curb the progress of cubitainers. On the contrary, high product-to-packaging ratio to minimize dead space and other advancements in material technology are anticipated to create lucrative opportunities for the cubitainer market.

Report Attribute Details
Cubitainer Market Value (2022) US$ 98.2 Million
Cubitainer Market Anticipated Value (2032) US$ 151.1 Million
Cubitainer Projected Growth Rate (2032) 4.4%

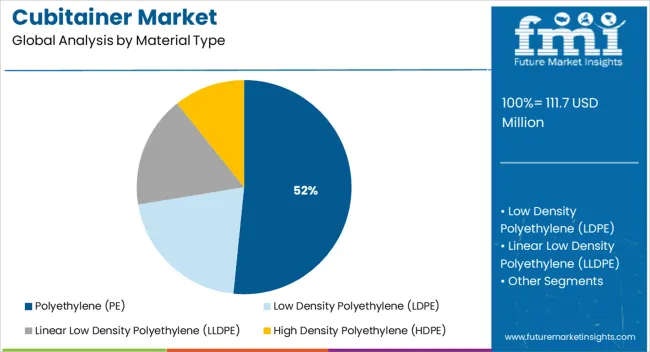
The most common material used to manufacture cubitainers is low density polyethylene (LDPE). This material protects the product contained within from getting contaminated by gases, bacteria, odour, and moisture. This creates several opportunities for manufacturers in the cubitainers market trends.

High barrier films such as EVOH is used as bladders in cubitainers to aid food and beverage product manufacturers to extend the shelf-life of their products and minimize product wastage. Additionally, cubitainers are cost-effective and 97-100% of the product helps reduce product waste.

Don't pay for what you don't need

Customize your report by selecting specific countries or regions and save 30%!

Cubitainer Market Outlook

With manufacturers increasing their focus on Reduce, Reuse, and Recycle, cubitainer has become one of the most sought-after products for both the manufacturers and end customers.

To tap into the sustainable market, the manufacturers are making the best use of the fully recyclable property of cubitainers. So, the focus has been on developing the closed-loop recycling form of cubitaners.

Taking this into account, some manufacturers have devised an innovative step-by-step process to manufacture recyclable cubitainers.

The process starts with molding, wherein a cubutainer of the required shape is manufactured.

This step is followed by filling the cubitainer with the required liquid. During the filling process, there are chances that some foreign substance might be present. So, the filling is followed by sorting, where these foreign materials are removed.

Next, the spouts are removed from the body. It is necessary to remove these spouts, as the presence of spouts would make the cubitainers non-recyclable. After that, the cubitainers are subjected to grinding, post which these are washed to form flakes.

The washing is preceded by drying using a dehydrator. The dried flakes no longer contain the sliminess which was felt when the flakes were wet.

Subsequently, we would be pelleting the dried flakes with an extruder. Finally, the cubitainers are molded using recycled pellets.

After this, in the form of testing, the recycled cubitainers are compared with a virgin raisin cubitainer. Finally, after this, the recycled cubitainer is sold to the end customer.

Apart from that, the manufacturers have been laying special emphasis on developing cubitainers that are collapsible in nature and are made up of Polyethylene. The specialty of using such collapsible containers is that these meet the level 3 classification for contaminant-free sample containers.

Apart from that, there is a consistent effort from manufacturers to develop cubitainers of various capacities. This has been done in an effort to cover the broader market. Furthermore, manufacturers are employing the latest technologies in their value chain to develop tougher and more versatile versions of cubitainers.

Exploring how Cubitainers Provide Optimal Packaging Solutions and Other Key Aspects

The rising demand for durable, and portable packaging solutions is expected to boost the demand for cubitainer. Moreover, the demand further increases owing to the changing lifestyle and food habits of the major population, which leads to the growing use of packaged liquid food products.

A key feature of cubitainers is the ability to customize them. Manufacturers in the cubitainer market are leaning towards the production of rigid and flexible cubitainers and offering a range of configuration options to their customers, which is expected to boost the global cubitainer market size. They are also concentrating on smart manufacturing processes such as artificial intelligence (AI), Internet of Things (IoT), and robotics.

Cubitainers further have a high demand which is attributed to its low shipping costs compared to the standard plastic pails, due to its lightweight. Moreover, owing to its non-toxic feature, manufacturers prefer cubitainers for alcoholic and non-alcoholic beverages, as it maintains the quality of the liquid and prevents contamination.

The reusability and eco-friendly nature are likely to contribute towards the global cubitainer market growth as concerns and controlling programs regarding the reduction of the use and disposal of numerous packaging materials have increased. Moreover, the adoption of cubitainer is estimated to grow as manufacturers operate in-sync with the requirements of the FDA.

Ismail Sutaria
Ismail Sutaria

Principal Consultant

Talk to Analyst

Find your sweet spots for generating winning opportunities in this market.

Hindrances of Cubitainers and Lucrative Opportunities Impacting the Market Growth

There are several alternatives to cubitainers available in the market. These include rigid open head pails, bag-in-box, and blow-moulded tight head pails. These alternative options provide similar or better features than that of cubitainers, which is likely to impede the global cubitainer market growth.

Conversely, as new players continue to enter the cubitainer market, the quality, costs, and environment sustainability becomes the lookout to be considered in future production of cubitainers. Furthermore, the development of multi-purpose and high-quality cubitainers are being highly focused on by manufacturers, by laying emphasis on various inspections and certification procedures to ensure exquisite quality of the product.
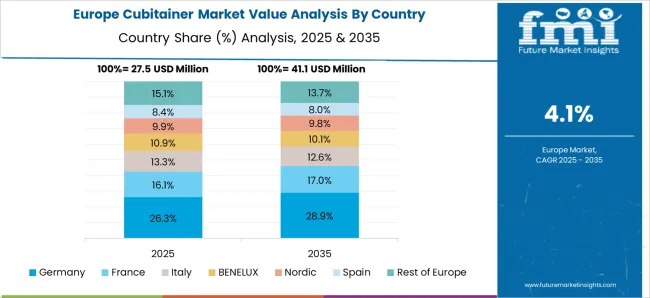
Regional Overview: How does the Demand for Cubitainer Grow in Europe?

Europe holds the largest share of the cubitainer market with a revenue of 19%. This is attributed to the increasing demand for packaged liquid food and the presence of key cubitainer manufacturers. Cubitainers are preferred over other packaging types by an increasing number of manufacturers and producers from various industries. This is because of its lucrative and eco-friendly nature, which is anticipated to surge its demand and sales of cubitainer in this region.

Get the data you need at a Fraction of the cost

Personalize your report by choosing insights you need
and save 40%!

Exploring the Start-Up Ecosystem & Recent Developments Transforming the Cubitainer Market Space

The lightweight and space efficiency of cubitainers are the key features that maintain its high demand amongst various end users. The growing environmental concerns due to global warming are compelling manufacturers to not only make the cubitainers eco-friendly by facilitating polyethylene terephthalate (PET) barrier, high density polyethylene (HDPE), low density polyethylene (LDPE), and linear low density polyethylene (LLDPE).

Start-up companies are also contributing to the cubitainer market growth by incorporating various innovative strategies to improve the features of cubitainers, and possibly increase its applications and demand amongst several end users.

The cubitainer market is fragmented and the competition between players is poised to increase over the forecast period. Manufacturers are primarily focusing on the development of cubitainers by improving their quality and provide them with several purposes.

The Most Recent Developments Surging the Popularity of Cubitaners:

  • In 2020, Zacros America Inc. developed advanced cubitainers known as “RECTAINER”. The container has a capacity of 10L and is ideal for vinegar, refined sake, shochu, milk, liquid seasoning, etc.
  • In March 2021, The Cary Company divested its raw materials and specialty chemicals distribution business as part of a strategic restructuring to focus greater on containers and packaging. The raw materials and specialty chemicals business unit was sold to Maroon Group LLC, owned by Barentz International.
  • RPC Promens launched “multitainers”, which is a combination package with an integrated handle and neck. The capacities available are 5L and 10L.

Top Market Players of the Cubitainer Market

  • Changshun Plastic Co. Ltd. - The company commenced trading in 1995 and is a privately owned South China company. By leveraging advanced manufacturing techniques, backed by a team of 10 engineers and 50 process operators, they take their business forward with a commitment to quality and outstanding service. As a solely owned South China company, they not only supply products to inner China but also have a very strong global customer base in Japan, America, Korea, India, and European countries. Their products have been used in various fields including food processing, pharmaceutical, health care, and chemical industries.
  • Zacros America Inc. - It was founded in 2012 as a subsidiary of Zacros also known as Fujimori Kogyo, a Japanese converter of flexible films and packaging which was established in 1914. In 2014, Zacros America acquired the former Hedwin Corporation. It manufactures customizable monolayer and multilayer packaging products including CUBITAINER®, flexible pouches, fitments and medical packaging.
  • ChangZhou HengQi Plastic Co. Ltd. - It is a professional manufacturing company for cubic flexible collapsible plastic containers in China. The cubic flexible collapsible plastic containers is a Chinese patent product since 1980.
  • The Cary Company - The company represents an unparalleled list of distinguished suppliers and recognized leaders in their respective fields which serve myriad industries such as paint and coatings, apiary, asphalt, automotive, brewery, building, chemical, electronics, food, foundries, graphic arts, oil and grease, paper, plastics, personal care, pharmaceuticals, putty, caulks, sealants, rubber, detergents and wallpaper.
  • Changzhou Sanjie Plastic Products Co. Ltd. - The company started to produce cubitainer in 2008 and is located in Wujin Scientific R&D Park (national New Hi-tech Industrial Park). Sanjie insists on importing LDPE (FDA certified) material to satisfy the toughest requirements, which are acid-based and high temp (90 °C) resistant. It's moulded under high temperatures and is germ-free, non-toxic, and tasteless. It has perfect flex and impact resistance performance. It is thin and light, collapsible, portable, freight saving, and widely used in the packaging of food, industry, medical, outdoor, disaster relief, fertilizer, etc. Their products now reach over 60 categories, and they have developed more than 10 accessories according to customers' requirements.

Other Market Participants of the Cubitainer Market

  • Fujimori KOGYO Co. Ltd.
  • RPC Promens and SEKISUI SEIKEI Co. Ltd.
  • Koizumi Jute Mills Ltd.
  • United States Plastic Corporation
  • Avantor Performance Materials Inc.
  • Quality Environmental Containers
  • Cole-Parmer
  • Berlin Packaging

Report Scope

Report Attribute Details
Growth Rate CAGR of 4.4% from 2022 to 2032
Base year for estimation 2021
Historical data 2015 - 2020
Forecast period 2022 - 2032
Quantitative units Revenue in USD million and CAGR from 2022 to 2032
Report coverage Revenue forecast, volume forecast, company ranking, competitive landscape, growth factors, and trends, Pricing Analysis,
Segments covered Material Type, Carrying Capacity, End User and Region.
Regional scope North America; Western Europe, Eastern Europe, Middle East, Africa, ASEAN, South Asia, Rest of Asia, Australia and New Zealand
Country scope USA; Canada; Mexico; Germany; UK; France; Italy; Spain; Russia; Belgium; Poland; Czech Republic; China; India; Japan; Australia; Brazil; Argentina; Colombia; Saudi Arabia; UAE; Iran; South Africa
Key companies profiled Changshun Plastic Co. Ltd., Zacros America Inc., ChangZhou HengQi Plastic Co. Ltd., The Cary Company, Changzhou Sanjie Plastic Products Co. Ltd., Fujimori KOGYO Co. Ltd., RPC Promens and SEKISUI SEIKEI Co. Ltd., Koizumi Jute Mills Ltd., United States Plastic Corporation, Avantor Performance Materials Inc., Quality Environmental Containers, Cole-Parmer, Berlin Packaging, etc.
Customization scope Free report customization (equivalent to up to 8 analysts working days) with purchase. Addition or alteration to country, regional & segment scope.
Pricing and purchase options Avail customized purchase options to meet your exact research needs.

Key Segments Profiled in the Cubitainer Market Survey

By Material Type:

  • Polyethylene (PE)
  • Low Density Polyethylene (LDPE)
  • Linear Low Density Polyethylene (LLDPE)
  • High Density Polyethylene (HDPE)

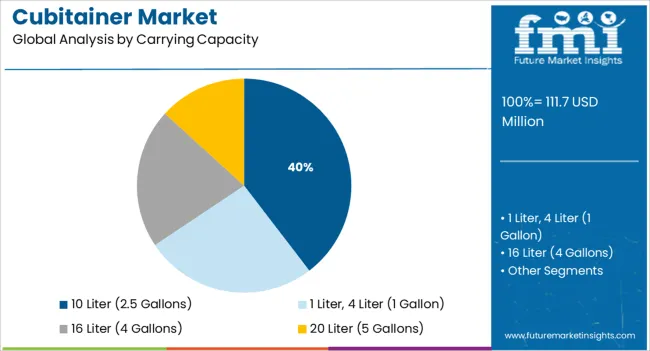
By Carrying Capacity:

  • 1 Ltr
  • 4 Ltr
  • 10 Ltr
  • 16 Ltr
  • 20 Ltr

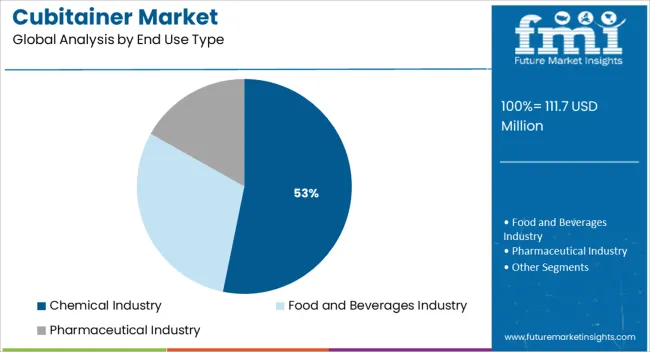
By End User:

  • Food & Beverage
  • Chemical
  • Pharmaceutical

By Region:

  • North America
  • Latin America
  • Asia Pacific
  • MEA
  • Europe

Frequently Asked Questions

How much CAGR can be Approximated for the Cubitainer Market?

The cubitainer market is likely to garner a CAGR of 4.4% during the forecast period.

What is the Major Restraint of the Cubitainer Market?

Stringent rules and regulations regarding packaging materials; availability of alternative options.

What will be the Size of the Cubitainer Market by 2032?

The cubitainer market is likely to grow to surpass US$ 151.1 Mn by 2032.

Table of Content

1. Executive Summary

    1.1. Global Market Outlook

    1.2. Demand-side Trends

    1.3. Supply-side Trends

    1.4. Technology Roadmap Analysis

    1.5. Analysis and Recommendations

2. Market Overview

    2.1. Market Coverage / Taxonomy

    2.2. Market Definition / Scope / Limitations

3. Market Background

    3.1. Market Dynamics

        3.1.1. Drivers

        3.1.2. Restraints

        3.1.3. Opportunity

        3.1.4. Trends

    3.2. Scenario Forecast

        3.2.1. Demand in Optimistic Scenario

        3.2.2. Demand in Likely Scenario

        3.2.3. Demand in Conservative Scenario

    3.3. Opportunity Map Analysis

    3.4. Product Life Cycle Analysis

    3.5. Supply Chain Analysis

        3.5.1. Supply Side Participants and their Roles

            3.5.1.1. Producers

            3.5.1.2. Mid-Level Participants (Traders/ Agents/ Brokers)

            3.5.1.3. Wholesalers and Distributors

        3.5.2. Value Added and Value Created at Node in the Supply Chain

        3.5.3. List of Raw Material Suppliers

        3.5.4. List of Existing and Potential Buyer’s

    3.6. Investment Feasibility Matrix

    3.7. Value Chain Analysis

        3.7.1. Profit Margin Analysis

        3.7.2. Wholesalers and Distributors

        3.7.3. Retailers

    3.8. PESTLE and Porter’s Analysis

    3.9. Regulatory Landscape

        3.9.1. By Key Regions

        3.9.2. By Key Countries

    3.10. Regional Parent Market Outlook

    3.11. Production and Consumption Statistics

    3.12. Import and Export Statistics

4. Global Cubitainer Market Analysis 2017-2021 and Forecast, 2022-2032

    4.1. Historical Market Size Value (US$ Mn) & Volume (Unit) Analysis, 2017-2021

    4.2. Current and Future Market Size Value (US$ Mn) & Volume (Unit) Projections, 2022-2032

        4.2.1. Y-o-Y Growth Trend Analysis

        4.2.2. Absolute $ Opportunity Analysis

5. Global Cubitainer Market Analysis 2017-2021 and Forecast 2022-2032, By Material Type

    5.1. Introduction / Key Findings

    5.2. Historical Market Size Value (US$ Mn) & Volume (Unit) Analysis By Material Type, 2017-2021

    5.3. Current and Future Market Size Value (US$ Mn) & Volume (Unit) Analysis and Forecast By Material Type, 2022-2032

        5.3.1. Polyethylene (PE)

            5.3.1.1. Low Density Polyethylene (LDPE)

            5.3.1.2. High Density Polyethylene (HDPE)

    5.4. Y-o-Y Growth Trend Analysis By Material Type, 2017-2021

    5.5. Absolute $ Opportunity Analysis By Material Type, 2022-2032

6. Global Cubitainer Market Analysis 2017-2021 and Forecast 2022-2032, By Carrying Capacity

    6.1. Introduction / Key Findings

    6.2. Historical Market Size Value (US$ Mn) & Volume (Unit) Analysis By Carrying Capacity, 2017-2021

    6.3. Current and Future Market Size Value (US$ Mn) & Volume (Unit) Analysis and Forecast By Carrying Capacity, 2022-2032

        6.3.1. 1 Liter, 4 Liter (1 Gallon)

        6.3.2. 10 Liter (2.5 Gallons)

        6.3.3. 16 Liter (4 Gallons)

        6.3.4. 20 Liter (5 Gallons)

    6.4. Y-o-Y Growth Trend Analysis By Carrying Capacity, 2017-2021

    6.5. Absolute $ Opportunity Analysis By Carrying Capacity, 2022-2032

7. Global Cubitainer Market Analysis 2017-2021 and Forecast 2022-2032, By End Use Type

    7.1. Introduction / Key Findings

    7.2. Historical Market Size Value (US$ Mn) & Volume (Unit) Analysis By End Use Type, 2017-2021

    7.3. Current and Future Market Size Value (US$ Mn) & Volume (Unit) Analysis and Forecast By End Use Type, 2022-2032

        7.3.1. Food and Beverages Industry

        7.3.2. Chemical Industry

        7.3.3. Pharmaceutical Industry

    7.4. Y-o-Y Growth Trend Analysis By End Use Type, 2017-2021

    7.5. Absolute $ Opportunity Analysis By End Use Type, 2022-2032

8. Global Cubitainer Market Analysis 2017-2021 and Forecast 2022-2032, By Region

    8.1. Introduction

    8.2. Historical Market Size Value (US$ Mn) & Volume (Unit) Analysis By Region, 2017-2021

    8.3. Current Market Size Value (US$ Mn) & Volume (Unit) Analysis and Forecast By Region, 2022-2032

        8.3.1. North America

        8.3.2. Latin America

        8.3.3. Europe

        8.3.4. Asia Pacific

        8.3.5. MEA

    8.4. Market Attractiveness Analysis By Region

9. North America Cubitainer Market Analysis 2017-2021 and Forecast 2022-2032, By Country

    9.1. Historical Market Size Value (US$ Mn) & Volume (Unit) Trend Analysis By Market Taxonomy, 2017-2021

    9.2. Market Size Value (US$ Mn) & Volume (Unit) Forecast By Market Taxonomy, 2022-2032

        9.2.1. By Country

            9.2.1.1. U.S.

            9.2.1.2. Canada

        9.2.2. By Material Type

        9.2.3. By Carrying Capacity

        9.2.4. By End Use Type

    9.3. Market Attractiveness Analysis

        9.3.1. By Country

        9.3.2. By Material Type

        9.3.3. By Carrying Capacity

        9.3.4. By End Use Type

    9.4. Key Takeaways

10. Latin America Cubitainer Market Analysis 2017-2021 and Forecast 2022-2032, By Country

    10.1. Historical Market Size Value (US$ Mn) & Volume (Unit) Trend Analysis By Market Taxonomy, 2017-2021

    10.2. Market Size Value (US$ Mn) & Volume (Unit) Forecast By Market Taxonomy, 2022-2032

        10.2.1. By Country

            10.2.1.1. Brazil

            10.2.1.2. Mexico

            10.2.1.3. Rest of Latin America

        10.2.2. By Material Type

        10.2.3. By Carrying Capacity

        10.2.4. By End Use Type

    10.3. Market Attractiveness Analysis

        10.3.1. By Country

        10.3.2. By Material Type

        10.3.3. By Carrying Capacity

        10.3.4. By End Use Type

    10.4. Key Takeaways

11. Europe Cubitainer Market Analysis 2017-2021 and Forecast 2022-2032, By Country

    11.1. Historical Market Size Value (US$ Mn) & Volume (Unit) Trend Analysis By Market Taxonomy, 2017-2021

    11.2. Market Size Value (US$ Mn) & Volume (Unit) Forecast By Market Taxonomy, 2022-2032

        11.2.1. By Country

            11.2.1.1. Germany

            11.2.1.2. U.K.

            11.2.1.3. France

            11.2.1.4. Spain

            11.2.1.5. Italy

            11.2.1.6. Rest of Europe

        11.2.2. By Material Type

        11.2.3. By Carrying Capacity

        11.2.4. By End Use Type

    11.3. Market Attractiveness Analysis

        11.3.1. By Country

        11.3.2. By Material Type

        11.3.3. By Carrying Capacity

        11.3.4. By End Use Type

    11.4. Key Takeaways

12. Asia Pacific Cubitainer Market Analysis 2017-2021 and Forecast 2022-2032, By Country

    12.1. Historical Market Size Value (US$ Mn) & Volume (Unit) Trend Analysis By Market Taxonomy, 2017-2021

    12.2. Market Size Value (US$ Mn) & Volume (Unit) Forecast By Market Taxonomy, 2022-2032

        12.2.1. By Country

            12.2.1.1. China

            12.2.1.2. Japan

            12.2.1.3. South Korea

            12.2.1.4. Malaysia

            12.2.1.5. Singapore

            12.2.1.6. Australia

            12.2.1.7. New Zealand

            12.2.1.8. Rest of APAC

        12.2.2. By Material Type

        12.2.3. By Carrying Capacity

        12.2.4. By End Use Type

    12.3. Market Attractiveness Analysis

        12.3.1. By Country

        12.3.2. By Material Type

        12.3.3. By Carrying Capacity

        12.3.4. By End Use Type

    12.4. Key Takeaways

13. MEA Cubitainer Market Analysis 2017-2021 and Forecast 2022-2032, By Country

    13.1. Historical Market Size Value (US$ Mn) & Volume (Unit) Trend Analysis By Market Taxonomy, 2017-2021

    13.2. Market Size Value (US$ Mn) & Volume (Unit) Forecast By Market Taxonomy, 2022-2032

        13.2.1. By Country

            13.2.1.1. GCC Countries

            13.2.1.2. South Africa

            13.2.1.3. Israel

            13.2.1.4. Rest of MEA

        13.2.2. By Material Type

        13.2.3. By Carrying Capacity

        13.2.4. By End Use Type

    13.3. Market Attractiveness Analysis

        13.3.1. By Country

        13.3.2. By Material Type

        13.3.3. By Carrying Capacity

        13.3.4. By End Use Type

    13.4. Key Takeaways

14. Key Countries Cubitainer Market Analysis

    14.1. U.S.

        14.1.1. Pricing Analysis

        14.1.2. Market Share Analysis, 2021

            14.1.2.1. By Material Type

            14.1.2.2. By Carrying Capacity

            14.1.2.3. By End Use Type

    14.2. Canada

        14.2.1. Pricing Analysis

        14.2.2. Market Share Analysis, 2021

            14.2.2.1. By Material Type

            14.2.2.2. By Carrying Capacity

            14.2.2.3. By End Use Type

    14.3. Brazil

        14.3.1. Pricing Analysis

        14.3.2. Market Share Analysis, 2021

            14.3.2.1. By Material Type

            14.3.2.2. By Carrying Capacity

            14.3.2.3. By End Use Type

    14.4. Mexico

        14.4.1. Pricing Analysis

        14.4.2. Market Share Analysis, 2021

            14.4.2.1. By Material Type

            14.4.2.2. By Carrying Capacity

            14.4.2.3. By End Use Type

    14.5. Germany

        14.5.1. Pricing Analysis

        14.5.2. Market Share Analysis, 2021

            14.5.2.1. By Material Type

            14.5.2.2. By Carrying Capacity

            14.5.2.3. By End Use Type

    14.6. U.K.

        14.6.1. Pricing Analysis

        14.6.2. Market Share Analysis, 2021

            14.6.2.1. By Material Type

            14.6.2.2. By Carrying Capacity

            14.6.2.3. By End Use Type

    14.7. France

        14.7.1. Pricing Analysis

        14.7.2. Market Share Analysis, 2021

            14.7.2.1. By Material Type

            14.7.2.2. By Carrying Capacity

            14.7.2.3. By End Use Type

    14.8. Spain

        14.8.1. Pricing Analysis

        14.8.2. Market Share Analysis, 2021

            14.8.2.1. By Material Type

            14.8.2.2. By Carrying Capacity

            14.8.2.3. By End Use Type

    14.9. Italy

        14.9.1. Pricing Analysis

        14.9.2. Market Share Analysis, 2021

            14.9.2.1. By Material Type

            14.9.2.2. By Carrying Capacity

            14.9.2.3. By End Use Type

    14.10. China

        14.10.1. Pricing Analysis

        14.10.2. Market Share Analysis, 2021

            14.10.2.1. By Material Type

            14.10.2.2. By Carrying Capacity

            14.10.2.3. By End Use Type

    14.11. Japan

        14.11.1. Pricing Analysis

        14.11.2. Market Share Analysis, 2021

            14.11.2.1. By Material Type

            14.11.2.2. By Carrying Capacity

            14.11.2.3. By End Use Type

    14.12. South Korea

        14.12.1. Pricing Analysis

        14.12.2. Market Share Analysis, 2021

            14.12.2.1. By Material Type

            14.12.2.2. By Carrying Capacity

            14.12.2.3. By End Use Type

    14.13. Malaysia

        14.13.1. Pricing Analysis

        14.13.2. Market Share Analysis, 2021

            14.13.2.1. By Material Type

            14.13.2.2. By Carrying Capacity

            14.13.2.3. By End Use Type

    14.14. Singapore

        14.14.1. Pricing Analysis

        14.14.2. Market Share Analysis, 2021

            14.14.2.1. By Material Type

            14.14.2.2. By Carrying Capacity

            14.14.2.3. By End Use Type

    14.15. Australia

        14.15.1. Pricing Analysis

        14.15.2. Market Share Analysis, 2021

            14.15.2.1. By Material Type

            14.15.2.2. By Carrying Capacity

            14.15.2.3. By End Use Type

    14.16. New Zealand

        14.16.1. Pricing Analysis

        14.16.2. Market Share Analysis, 2021

            14.16.2.1. By Material Type

            14.16.2.2. By Carrying Capacity

            14.16.2.3. By End Use Type

    14.17. GCC Countries

        14.17.1. Pricing Analysis

        14.17.2. Market Share Analysis, 2021

            14.17.2.1. By Material Type

            14.17.2.2. By Carrying Capacity

            14.17.2.3. By End Use Type

    14.18. South Africa

        14.18.1. Pricing Analysis

        14.18.2. Market Share Analysis, 2021

            14.18.2.1. By Material Type

            14.18.2.2. By Carrying Capacity

            14.18.2.3. By End Use Type

    14.19. Israel

        14.19.1. Pricing Analysis

        14.19.2. Market Share Analysis, 2021

            14.19.2.1. By Material Type

            14.19.2.2. By Carrying Capacity

            14.19.2.3. By End Use Type

15. Market Structure Analysis

    15.1. Competition Dashboard

    15.2. Competition Benchmarking

    15.3. Market Share Analysis of Top Players

        15.3.1. By Regional

        15.3.2. By Material Type

        15.3.3. By Carrying Capacity

        15.3.4. By End Use Type

16. Competition Analysis

    16.1. Competition Deep Dive

        16.1.1. Changshun Plastic Co. Ltd.

            16.1.1.1. Overview

            16.1.1.2. Product Portfolio

            16.1.1.3. Profitability by Market Segments

            16.1.1.4. Sales Footprint

            16.1.1.5. Strategy Overview

                16.1.1.5.1. Marketing Strategy

                16.1.1.5.2. Product Strategy

                16.1.1.5.3. Channel Strategy

        16.1.2. Zacros America Inc

            16.1.2.1. Overview

            16.1.2.2. Product Portfolio

            16.1.2.3. Profitability by Market Segments

            16.1.2.4. Sales Footprint

            16.1.2.5. Strategy Overview

                16.1.2.5.1. Marketing Strategy

                16.1.2.5.2. Product Strategy

                16.1.2.5.3. Channel Strategy

        16.1.3. ChangZhou HengQi Plastic Co. Ltd

            16.1.3.1. Overview

            16.1.3.2. Product Portfolio

            16.1.3.3. Profitability by Market Segments

            16.1.3.4. Sales Footprint

            16.1.3.5. Strategy Overview

                16.1.3.5.1. Marketing Strategy

                16.1.3.5.2. Product Strategy

                16.1.3.5.3. Channel Strategy

        16.1.4. The Cary Company

            16.1.4.1. Overview

            16.1.4.2. Product Portfolio

            16.1.4.3. Profitability by Market Segments

            16.1.4.4. Sales Footprint

            16.1.4.5. Strategy Overview

                16.1.4.5.1. Marketing Strategy

                16.1.4.5.2. Product Strategy

                16.1.4.5.3. Channel Strategy

        16.1.5. Changzhou Sanjie Plastic Products Co., Ltd

            16.1.5.1. Overview

            16.1.5.2. Product Portfolio

            16.1.5.3. Profitability by Market Segments

            16.1.5.4. Sales Footprint

            16.1.5.5. Strategy Overview

                16.1.5.5.1. Marketing Strategy

                16.1.5.5.2. Product Strategy

                16.1.5.5.3. Channel Strategy

        16.1.6. Berlin Packaging

            16.1.6.1. Overview

            16.1.6.2. Product Portfolio

            16.1.6.3. Profitability by Market Segments

            16.1.6.4. Sales Footprint

            16.1.6.5. Strategy Overview

                16.1.6.5.1. Marketing Strategy

                16.1.6.5.2. Product Strategy

                16.1.6.5.3. Channel Strategy

        16.1.7. Cole-Parmer

            16.1.7.1. Overview

            16.1.7.2. Product Portfolio

            16.1.7.3. Profitability by Market Segments

            16.1.7.4. Sales Footprint

            16.1.7.5. Strategy Overview

                16.1.7.5.1. Marketing Strategy

                16.1.7.5.2. Product Strategy

                16.1.7.5.3. Channel Strategy

        16.1.8. Quality Environmental Containers

            16.1.8.1. Overview

            16.1.8.2. Product Portfolio

            16.1.8.3. Profitability by Market Segments

            16.1.8.4. Sales Footprint

            16.1.8.5. Strategy Overview

                16.1.8.5.1. Marketing Strategy

                16.1.8.5.2. Product Strategy

                16.1.8.5.3. Channel Strategy

        16.1.9. Avantor Performance Materials, Inc

            16.1.9.1. Overview

            16.1.9.2. Product Portfolio

            16.1.9.3. Profitability by Market Segments

            16.1.9.4. Sales Footprint

            16.1.9.5. Strategy Overview

                16.1.9.5.1. Marketing Strategy

                16.1.9.5.2. Product Strategy

                16.1.9.5.3. Channel Strategy

        16.1.10. Thermo Fisher Scientific

            16.1.10.1. Overview

            16.1.10.2. Product Portfolio

            16.1.10.3. Profitability by Market Segments

            16.1.10.4. Sales Footprint

            16.1.10.5. Strategy Overview

                16.1.10.5.1. Marketing Strategy

                16.1.10.5.2. Product Strategy

                16.1.10.5.3. Channel Strategy

17. Assumptions & Acronyms Used

18. Research Methodology

Don't pay for what you don't need

Customize your report by selecting specific countries or regions and save 30%!

List of Tables

Table 1: Global Cubitainer Market Value (US$ Mn) Forecast by Region, 2017-2032

Table 2: Global Cubitainer Market Volume (Unit) Forecast by Region, 2017-2032

Table 3: Global Cubitainer Market Value (US$ Mn) Forecast by Material Type, 2017-2032

Table 4: Global Cubitainer Market Volume (Unit) Forecast by Material Type, 2017-2032

Table 5: Global Cubitainer Market Value (US$ Mn) Forecast by Carrying Capacity, 2017-2032

Table 6: Global Cubitainer Market Volume (Unit) Forecast by Carrying Capacity, 2017-2032

Table 7: Global Cubitainer Market Value (US$ Mn) Forecast by End Use Type, 2017-2032

Table 8: Global Cubitainer Market Volume (Unit) Forecast by End Use Type, 2017-2032

Table 9: North America Cubitainer Market Value (US$ Mn) Forecast by Country, 2017-2032

Table 10: North America Cubitainer Market Volume (Unit) Forecast by Country, 2017-2032

Table 11: North America Cubitainer Market Value (US$ Mn) Forecast by Material Type, 2017-2032

Table 12: North America Cubitainer Market Volume (Unit) Forecast by Material Type, 2017-2032

Table 13: North America Cubitainer Market Value (US$ Mn) Forecast by Carrying Capacity, 2017-2032

Table 14: North America Cubitainer Market Volume (Unit) Forecast by Carrying Capacity, 2017-2032

Table 15: North America Cubitainer Market Value (US$ Mn) Forecast by End Use Type, 2017-2032

Table 16: North America Cubitainer Market Volume (Unit) Forecast by End Use Type, 2017-2032

Table 17: Latin America Cubitainer Market Value (US$ Mn) Forecast by Country, 2017-2032

Table 18: Latin America Cubitainer Market Volume (Unit) Forecast by Country, 2017-2032

Table 19: Latin America Cubitainer Market Value (US$ Mn) Forecast by Material Type, 2017-2032

Table 20: Latin America Cubitainer Market Volume (Unit) Forecast by Material Type, 2017-2032

Table 21: Latin America Cubitainer Market Value (US$ Mn) Forecast by Carrying Capacity, 2017-2032

Table 22: Latin America Cubitainer Market Volume (Unit) Forecast by Carrying Capacity, 2017-2032

Table 23: Latin America Cubitainer Market Value (US$ Mn) Forecast by End Use Type, 2017-2032

Table 24: Latin America Cubitainer Market Volume (Unit) Forecast by End Use Type, 2017-2032

Table 25: Europe Cubitainer Market Value (US$ Mn) Forecast by Country, 2017-2032

Table 26: Europe Cubitainer Market Volume (Unit) Forecast by Country, 2017-2032

Table 27: Europe Cubitainer Market Value (US$ Mn) Forecast by Material Type, 2017-2032

Table 28: Europe Cubitainer Market Volume (Unit) Forecast by Material Type, 2017-2032

Table 29: Europe Cubitainer Market Value (US$ Mn) Forecast by Carrying Capacity, 2017-2032

Table 30: Europe Cubitainer Market Volume (Unit) Forecast by Carrying Capacity, 2017-2032

Table 31: Europe Cubitainer Market Value (US$ Mn) Forecast by End Use Type, 2017-2032

Table 32: Europe Cubitainer Market Volume (Unit) Forecast by End Use Type, 2017-2032

Table 33: Asia Pacific Cubitainer Market Value (US$ Mn) Forecast by Country, 2017-2032

Table 34: Asia Pacific Cubitainer Market Volume (Unit) Forecast by Country, 2017-2032

Table 35: Asia Pacific Cubitainer Market Value (US$ Mn) Forecast by Material Type, 2017-2032

Table 36: Asia Pacific Cubitainer Market Volume (Unit) Forecast by Material Type, 2017-2032

Table 37: Asia Pacific Cubitainer Market Value (US$ Mn) Forecast by Carrying Capacity, 2017-2032

Table 38: Asia Pacific Cubitainer Market Volume (Unit) Forecast by Carrying Capacity, 2017-2032

Table 39: Asia Pacific Cubitainer Market Value (US$ Mn) Forecast by End Use Type, 2017-2032

Table 40: Asia Pacific Cubitainer Market Volume (Unit) Forecast by End Use Type, 2017-2032

Table 41: MEA Cubitainer Market Value (US$ Mn) Forecast by Country, 2017-2032

Table 42: MEA Cubitainer Market Volume (Unit) Forecast by Country, 2017-2032

Table 43: MEA Cubitainer Market Value (US$ Mn) Forecast by Material Type, 2017-2032

Table 44: MEA Cubitainer Market Volume (Unit) Forecast by Material Type, 2017-2032

Table 45: MEA Cubitainer Market Value (US$ Mn) Forecast by Carrying Capacity, 2017-2032

Table 46: MEA Cubitainer Market Volume (Unit) Forecast by Carrying Capacity, 2017-2032

Table 47: MEA Cubitainer Market Value (US$ Mn) Forecast by End Use Type, 2017-2032

Table 48: MEA Cubitainer Market Volume (Unit) Forecast by End Use Type, 2017-2032
Ismail Sutaria
Ismail Sutaria

Principal Consultant

Talk to Analyst

Find your sweet spots for generating winning opportunities in this market.

List of Charts

Figure 1: Global Cubitainer Market Value (US$ Mn) by Material Type, 2022-2032

Figure 2: Global Cubitainer Market Value (US$ Mn) by Carrying Capacity, 2022-2032

Figure 3: Global Cubitainer Market Value (US$ Mn) by End Use Type, 2022-2032

Figure 4: Global Cubitainer Market Value (US$ Mn) by Region, 2022-2032

Figure 5: Global Cubitainer Market Value (US$ Mn) Analysis by Region, 2017-2032

Figure 6: Global Cubitainer Market Volume (Unit) Analysis by Region, 2017-2032

Figure 7: Global Cubitainer Market Value Share (%) and BPS Analysis by Region, 2022-2032

Figure 8: Global Cubitainer Market Y-o-Y Growth (%) Projections by Region, 2022-2032

Figure 9: Global Cubitainer Market Value (US$ Mn) Analysis by Material Type, 2017-2032

Figure 10: Global Cubitainer Market Volume (Unit) Analysis by Material Type, 2017-2032

Figure 11: Global Cubitainer Market Value Share (%) and BPS Analysis by Material Type, 2022-2032

Figure 12: Global Cubitainer Market Y-o-Y Growth (%) Projections by Material Type, 2022-2032

Figure 13: Global Cubitainer Market Value (US$ Mn) Analysis by Carrying Capacity, 2017-2032

Figure 14: Global Cubitainer Market Volume (Unit) Analysis by Carrying Capacity, 2017-2032

Figure 15: Global Cubitainer Market Value Share (%) and BPS Analysis by Carrying Capacity, 2022-2032

Figure 16: Global Cubitainer Market Y-o-Y Growth (%) Projections by Carrying Capacity, 2022-2032

Figure 17: Global Cubitainer Market Value (US$ Mn) Analysis by End Use Type, 2017-2032

Figure 18: Global Cubitainer Market Volume (Unit) Analysis by End Use Type, 2017-2032

Figure 19: Global Cubitainer Market Value Share (%) and BPS Analysis by End Use Type, 2022-2032

Figure 20: Global Cubitainer Market Y-o-Y Growth (%) Projections by End Use Type, 2022-2032

Figure 21: Global Cubitainer Market Attractiveness by Material Type, 2022-2032

Figure 22: Global Cubitainer Market Attractiveness by Carrying Capacity, 2022-2032

Figure 23: Global Cubitainer Market Attractiveness by End Use Type, 2022-2032

Figure 24: Global Cubitainer Market Attractiveness by Region, 2022-2032

Figure 25: North America Cubitainer Market Value (US$ Mn) by Material Type, 2022-2032

Figure 26: North America Cubitainer Market Value (US$ Mn) by Carrying Capacity, 2022-2032

Figure 27: North America Cubitainer Market Value (US$ Mn) by End Use Type, 2022-2032

Figure 28: North America Cubitainer Market Value (US$ Mn) by Country, 2022-2032

Figure 29: North America Cubitainer Market Value (US$ Mn) Analysis by Country, 2017-2032

Figure 30: North America Cubitainer Market Volume (Unit) Analysis by Country, 2017-2032

Figure 31: North America Cubitainer Market Value Share (%) and BPS Analysis by Country, 2022-2032

Figure 32: North America Cubitainer Market Y-o-Y Growth (%) Projections by Country, 2022-2032

Figure 33: North America Cubitainer Market Value (US$ Mn) Analysis by Material Type, 2017-2032

Figure 34: North America Cubitainer Market Volume (Unit) Analysis by Material Type, 2017-2032

Figure 35: North America Cubitainer Market Value Share (%) and BPS Analysis by Material Type, 2022-2032

Figure 36: North America Cubitainer Market Y-o-Y Growth (%) Projections by Material Type, 2022-2032

Figure 37: North America Cubitainer Market Value (US$ Mn) Analysis by Carrying Capacity, 2017-2032

Figure 38: North America Cubitainer Market Volume (Unit) Analysis by Carrying Capacity, 2017-2032

Figure 39: North America Cubitainer Market Value Share (%) and BPS Analysis by Carrying Capacity, 2022-2032

Figure 40: North America Cubitainer Market Y-o-Y Growth (%) Projections by Carrying Capacity, 2022-2032

Figure 41: North America Cubitainer Market Value (US$ Mn) Analysis by End Use Type, 2017-2032

Figure 42: North America Cubitainer Market Volume (Unit) Analysis by End Use Type, 2017-2032

Figure 43: North America Cubitainer Market Value Share (%) and BPS Analysis by End Use Type, 2022-2032

Figure 44: North America Cubitainer Market Y-o-Y Growth (%) Projections by End Use Type, 2022-2032

Figure 45: North America Cubitainer Market Attractiveness by Material Type, 2022-2032

Figure 46: North America Cubitainer Market Attractiveness by Carrying Capacity, 2022-2032

Figure 47: North America Cubitainer Market Attractiveness by End Use Type, 2022-2032

Figure 48: North America Cubitainer Market Attractiveness by Country, 2022-2032

Figure 49: Latin America Cubitainer Market Value (US$ Mn) by Material Type, 2022-2032

Figure 50: Latin America Cubitainer Market Value (US$ Mn) by Carrying Capacity, 2022-2032

Figure 51: Latin America Cubitainer Market Value (US$ Mn) by End Use Type, 2022-2032

Figure 52: Latin America Cubitainer Market Value (US$ Mn) by Country, 2022-2032

Figure 53: Latin America Cubitainer Market Value (US$ Mn) Analysis by Country, 2017-2032

Figure 54: Latin America Cubitainer Market Volume (Unit) Analysis by Country, 2017-2032

Figure 55: Latin America Cubitainer Market Value Share (%) and BPS Analysis by Country, 2022-2032

Figure 56: Latin America Cubitainer Market Y-o-Y Growth (%) Projections by Country, 2022-2032

Figure 57: Latin America Cubitainer Market Value (US$ Mn) Analysis by Material Type, 2017-2032

Figure 58: Latin America Cubitainer Market Volume (Unit) Analysis by Material Type, 2017-2032

Figure 59: Latin America Cubitainer Market Value Share (%) and BPS Analysis by Material Type, 2022-2032

Figure 60: Latin America Cubitainer Market Y-o-Y Growth (%) Projections by Material Type, 2022-2032

Figure 61: Latin America Cubitainer Market Value (US$ Mn) Analysis by Carrying Capacity, 2017-2032

Figure 62: Latin America Cubitainer Market Volume (Unit) Analysis by Carrying Capacity, 2017-2032

Figure 63: Latin America Cubitainer Market Value Share (%) and BPS Analysis by Carrying Capacity, 2022-2032

Figure 64: Latin America Cubitainer Market Y-o-Y Growth (%) Projections by Carrying Capacity, 2022-2032

Figure 65: Latin America Cubitainer Market Value (US$ Mn) Analysis by End Use Type, 2017-2032

Figure 66: Latin America Cubitainer Market Volume (Unit) Analysis by End Use Type, 2017-2032

Figure 67: Latin America Cubitainer Market Value Share (%) and BPS Analysis by End Use Type, 2022-2032

Figure 68: Latin America Cubitainer Market Y-o-Y Growth (%) Projections by End Use Type, 2022-2032

Figure 69: Latin America Cubitainer Market Attractiveness by Material Type, 2022-2032

Figure 70: Latin America Cubitainer Market Attractiveness by Carrying Capacity, 2022-2032

Figure 71: Latin America Cubitainer Market Attractiveness by End Use Type, 2022-2032

Figure 72: Latin America Cubitainer Market Attractiveness by Country, 2022-2032

Figure 73: Europe Cubitainer Market Value (US$ Mn) by Material Type, 2022-2032

Figure 74: Europe Cubitainer Market Value (US$ Mn) by Carrying Capacity, 2022-2032

Figure 75: Europe Cubitainer Market Value (US$ Mn) by End Use Type, 2022-2032

Figure 76: Europe Cubitainer Market Value (US$ Mn) by Country, 2022-2032

Figure 77: Europe Cubitainer Market Value (US$ Mn) Analysis by Country, 2017-2032

Figure 78: Europe Cubitainer Market Volume (Unit) Analysis by Country, 2017-2032

Figure 79: Europe Cubitainer Market Value Share (%) and BPS Analysis by Country, 2022-2032

Figure 80: Europe Cubitainer Market Y-o-Y Growth (%) Projections by Country, 2022-2032

Figure 81: Europe Cubitainer Market Value (US$ Mn) Analysis by Material Type, 2017-2032

Figure 82: Europe Cubitainer Market Volume (Unit) Analysis by Material Type, 2017-2032

Figure 83: Europe Cubitainer Market Value Share (%) and BPS Analysis by Material Type, 2022-2032

Figure 84: Europe Cubitainer Market Y-o-Y Growth (%) Projections by Material Type, 2022-2032

Figure 85: Europe Cubitainer Market Value (US$ Mn) Analysis by Carrying Capacity, 2017-2032

Figure 86: Europe Cubitainer Market Volume (Unit) Analysis by Carrying Capacity, 2017-2032

Figure 87: Europe Cubitainer Market Value Share (%) and BPS Analysis by Carrying Capacity, 2022-2032

Figure 88: Europe Cubitainer Market Y-o-Y Growth (%) Projections by Carrying Capacity, 2022-2032

Figure 89: Europe Cubitainer Market Value (US$ Mn) Analysis by End Use Type, 2017-2032

Figure 90: Europe Cubitainer Market Volume (Unit) Analysis by End Use Type, 2017-2032

Figure 91: Europe Cubitainer Market Value Share (%) and BPS Analysis by End Use Type, 2022-2032

Figure 92: Europe Cubitainer Market Y-o-Y Growth (%) Projections by End Use Type, 2022-2032

Figure 93: Europe Cubitainer Market Attractiveness by Material Type, 2022-2032

Figure 94: Europe Cubitainer Market Attractiveness by Carrying Capacity, 2022-2032

Figure 95: Europe Cubitainer Market Attractiveness by End Use Type, 2022-2032

Figure 96: Europe Cubitainer Market Attractiveness by Country, 2022-2032

Figure 97: Asia Pacific Cubitainer Market Value (US$ Mn) by Material Type, 2022-2032

Figure 98: Asia Pacific Cubitainer Market Value (US$ Mn) by Carrying Capacity, 2022-2032

Figure 99: Asia Pacific Cubitainer Market Value (US$ Mn) by End Use Type, 2022-2032

Figure 100: Asia Pacific Cubitainer Market Value (US$ Mn) by Country, 2022-2032

Figure 101: Asia Pacific Cubitainer Market Value (US$ Mn) Analysis by Country, 2017-2032

Figure 102: Asia Pacific Cubitainer Market Volume (Unit) Analysis by Country, 2017-2032

Figure 103: Asia Pacific Cubitainer Market Value Share (%) and BPS Analysis by Country, 2022-2032

Figure 104: Asia Pacific Cubitainer Market Y-o-Y Growth (%) Projections by Country, 2022-2032

Figure 105: Asia Pacific Cubitainer Market Value (US$ Mn) Analysis by Material Type, 2017-2032

Figure 106: Asia Pacific Cubitainer Market Volume (Unit) Analysis by Material Type, 2017-2032

Figure 107: Asia Pacific Cubitainer Market Value Share (%) and BPS Analysis by Material Type, 2022-2032

Figure 108: Asia Pacific Cubitainer Market Y-o-Y Growth (%) Projections by Material Type, 2022-2032

Figure 109: Asia Pacific Cubitainer Market Value (US$ Mn) Analysis by Carrying Capacity, 2017-2032

Figure 110: Asia Pacific Cubitainer Market Volume (Unit) Analysis by Carrying Capacity, 2017-2032

Figure 111: Asia Pacific Cubitainer Market Value Share (%) and BPS Analysis by Carrying Capacity, 2022-2032

Figure 112: Asia Pacific Cubitainer Market Y-o-Y Growth (%) Projections by Carrying Capacity, 2022-2032

Figure 113: Asia Pacific Cubitainer Market Value (US$ Mn) Analysis by End Use Type, 2017-2032

Figure 114: Asia Pacific Cubitainer Market Volume (Unit) Analysis by End Use Type, 2017-2032

Figure 115: Asia Pacific Cubitainer Market Value Share (%) and BPS Analysis by End Use Type, 2022-2032

Figure 116: Asia Pacific Cubitainer Market Y-o-Y Growth (%) Projections by End Use Type, 2022-2032

Figure 117: Asia Pacific Cubitainer Market Attractiveness by Material Type, 2022-2032

Figure 118: Asia Pacific Cubitainer Market Attractiveness by Carrying Capacity, 2022-2032

Figure 119: Asia Pacific Cubitainer Market Attractiveness by End Use Type, 2022-2032

Figure 120: Asia Pacific Cubitainer Market Attractiveness by Country, 2022-2032

Figure 121: MEA Cubitainer Market Value (US$ Mn) by Material Type, 2022-2032

Figure 122: MEA Cubitainer Market Value (US$ Mn) by Carrying Capacity, 2022-2032

Figure 123: MEA Cubitainer Market Value (US$ Mn) by End Use Type, 2022-2032

Figure 124: MEA Cubitainer Market Value (US$ Mn) by Country, 2022-2032

Figure 125: MEA Cubitainer Market Value (US$ Mn) Analysis by Country, 2017-2032

Figure 126: MEA Cubitainer Market Volume (Unit) Analysis by Country, 2017-2032

Figure 127: MEA Cubitainer Market Value Share (%) and BPS Analysis by Country, 2022-2032

Figure 128: MEA Cubitainer Market Y-o-Y Growth (%) Projections by Country, 2022-2032

Figure 129: MEA Cubitainer Market Value (US$ Mn) Analysis by Material Type, 2017-2032

Figure 130: MEA Cubitainer Market Volume (Unit) Analysis by Material Type, 2017-2032

Figure 131: MEA Cubitainer Market Value Share (%) and BPS Analysis by Material Type, 2022-2032

Figure 132: MEA Cubitainer Market Y-o-Y Growth (%) Projections by Material Type, 2022-2032

Figure 133: MEA Cubitainer Market Value (US$ Mn) Analysis by Carrying Capacity, 2017-2032

Figure 134: MEA Cubitainer Market Volume (Unit) Analysis by Carrying Capacity, 2017-2032

Figure 135: MEA Cubitainer Market Value Share (%) and BPS Analysis by Carrying Capacity, 2022-2032

Figure 136: MEA Cubitainer Market Y-o-Y Growth (%) Projections by Carrying Capacity, 2022-2032

Figure 137: MEA Cubitainer Market Value (US$ Mn) Analysis by End Use Type, 2017-2032

Figure 138: MEA Cubitainer Market Volume (Unit) Analysis by End Use Type, 2017-2032

Figure 139: MEA Cubitainer Market Value Share (%) and BPS Analysis by End Use Type, 2022-2032

Figure 140: MEA Cubitainer Market Y-o-Y Growth (%) Projections by End Use Type, 2022-2032

Figure 141: MEA Cubitainer Market Attractiveness by Material Type, 2022-2032

Figure 142: MEA Cubitainer Market Attractiveness by Carrying Capacity, 2022-2032

Figure 143: MEA Cubitainer Market Attractiveness by End Use Type, 2022-2032

Figure 144: MEA Cubitainer Market Attractiveness by Country, 2022-2032

Recommendations

Packaging

Container Stacking Machine Market

Published : August 2023

Packaging

Container Liner Market

Published : February 2023

Explore Packaging Insights

View Reports