Cultures Market Size, Share, and Forecast Outlook 2025 to 2035

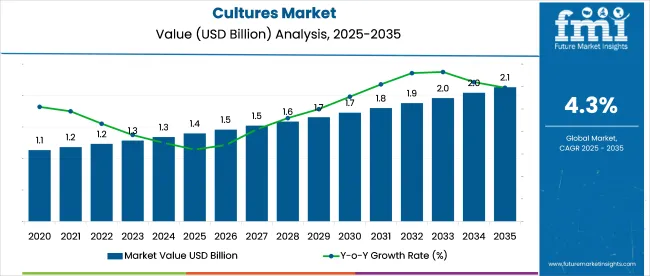
The global cultures market is projected to grow from USD 1.4 billion in 2025 to USD 2.1 billion by 2035, expanding at a CAGR of 4.3% over the forecast period. Between 2020 and 2024, the global cultures market expanded from USD 1.13 billion to USD 1.35 billion, supported by rising demand in fermented dairy, probiotic beverages, and meat preservation.
Quick Stats of Cultures Market

  • Market Value (2025): USD 1.4 billion
  • Forecast Value (2035): USD 2.1 billion
  • Forecast CAGR (2025 to 2035): 4.3%
  • Leading Segment in 2025: Bacterial cultures (60% share)
  • Key Growth Region: Asia Pacific (China is the fastest growing market with 6.4% CAGR)
  • Key Players: Thermo Fisher Scientific, Merck KGaA, Sartorius AG, Evonik Industries, Danaher Corporation, Charles River Laboratories, DuPont de Nemours, Lonza Group, Sigma-Aldrich, BD (Becton, Dickinson and Company), GenScript Biotech Corporation, Bio-Rad Laboratories, Promega Corporation, Shimadzu Corporation, and Novozymes A/S

Cultures Market Market Value Analysis

Attribute Detail
Market Size (2025) USD 1.4 billion
Market Size (2035) USD 2.1 billion
CAGR (2025 to 2035) 4.3%

In 2020, growth remained focused on traditional applications such as yogurt and soft cheese. By 2021, with the market reaching USD 1.18 billion, functional foods rebounded across North America and Western Europe. In 2022, at USD 1.23 billion, cultures began gaining traction in non-dairy fermented beverages and plant-based protein blends.

China and South Korea led the uptrend in 2023, pushing global value to USD 1.29 billion. New applications in shelf-life extension and bio-preservation contributed to the 2024 market size of USD 1.35 billion. The 2025 baseline of USD 1.40 billion reflects broader industrial use across clean-label categories.

From 2026 to 2034, average annual growth of 4.3% will be driven by innovation in multifunctional and synbiotic cultures. By 2035, the market is projected to reach USD 2.1 billion, supported by regulatory clarity and wider use in non-dairy and shelf-stable functional products.

The industry accounts for varying levels of share within its parent markets, with the most significant presence in the functional food ingredients market, where it accounts for approximately 12-15% due to its widespread use in probiotic-rich and fermented foods. In the fermentation ingredients market, it contributes around 10-12%, as they form a foundational input for fermentation across dairy, beverage, and biotech sectors.

Within the microbial products market, it represents about 8-10%, driven by their role in industrial microbiology and bioprocessing. Their share in the broader food & beverage additives market is smaller, around 4-6%, due to the vast range of other additives. In the biotechnology market, it occupies roughly 3-5%, mostly within pharmaceutical and research applications.

From a supply chain perspective, the market spans a highly integrated process starting with microbial strain identification and cultivation, followed by scale-up fermentation under tightly controlled environments. These cultures are then processed (freeze-dried or liquid), stabilized, and packaged for distribution.

Raw material sourcing (growth media, substrates), R&D, strain banking, and quality control play crucial upstream roles, while downstream segments include distribution to food processors, pharmaceutical companies, or research institutions. Cold-chain logistics and regulatory compliance are critical enablers of consistent supply, especially in the food and pharma sectors. Stakeholders across the value chain, ranging from bio-ingredient suppliers to end-product manufacturers, collaborate closely to maintain efficacy, strain viability, and safety.

Analysis of Cultures Market by Top Investment Segments

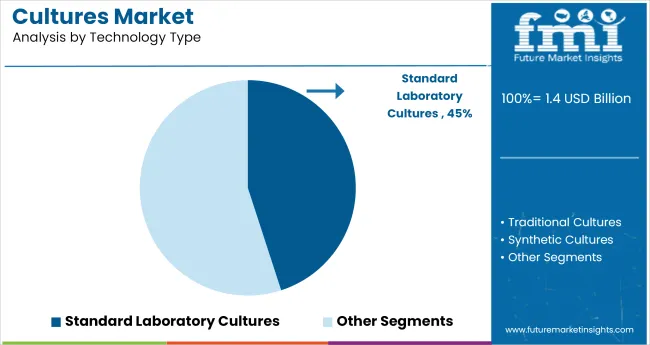
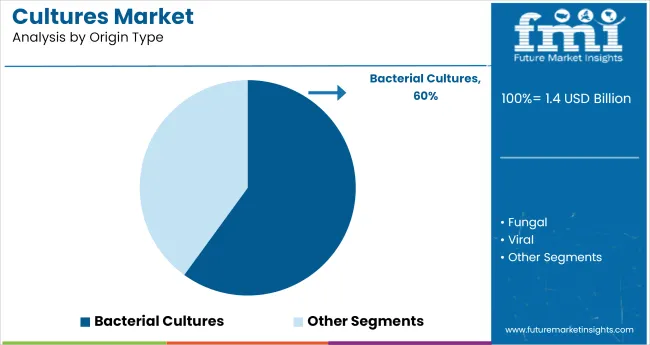
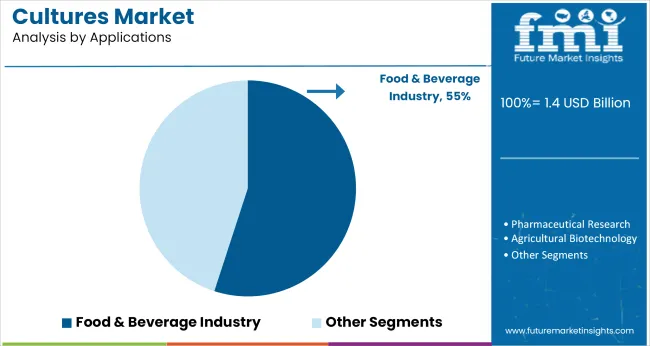
Standard laboratory cultures dominate the market due to their reliability, cost-efficiency, and widespread use in industrial and research settings. Bacterial cultures lead by type, with a 60% share, driven by their versatility in food, pharma, and biotech. The food & beverage industry remains the top application, holding over 55% share, fueled by rising demand for probiotic and clean-label fermented products.
Growing Dominance of Standard Laboratory Cultures in Industrial

Cultures Market Analysis By Technology Type

Standard laboratory cultures lead the global market with a projected market share of 45% in 2025, primarily due to their proven reliability, cost-effectiveness, and deep-rooted presence across industrial and research applications.
  • They are widely preferred in microbiology laboratories, food testing facilities, pharmaceutical R&D, and fermentation-based industries because of their consistent performance and ease of use.
  • The dominance is also attributed to well-established protocols, accessible infrastructure, and a large base of trained personnel familiar with their operation.
  • Unlike emerging cultures technologies that may require specialized handling or carry higher costs, standard benefit from the next few years of empirical data, making them indispensable in both commercial production and scientific study.

Bacterial Cultures lead with 60% Market Share

Cultures Market Analysis By Origin Type

Bacteria lead the market with a projected 60% market share in 2025, driven by their exceptional versatility, adaptability, and extensive use across food, pharmaceutical, and environmental industries.
  • The ability to reproduce rapidly, maintain stable characteristics, and perform under diverse conditions makes them indispensable in large-scale fermentation, probiotic formulation, and biotechnological innovations.
  • Bacterial strains such as Lactobacillus, Bifidobacterium, and Streptococcus thermophilus are widely used in dairy fermentation, gut health enhancement, and even waste treatment.
  • The compatibility with genetic modification techniques has made them key agents in protein synthesis and biofuel development.

Food & Beverage drives Demand and Account for 55% Market Share

Cultures Market Analysis By Applications

Food and beverages lead with over 55% of the total market share in 2025. This dominance is primarily driven by the surging demand for probiotic-rich, fermented, and clean-label products that enhance digestive health, immunity, and wellness.

  • They are extensively used in dairy products like yogurt, cheese, and kefir, as well as in fermented plant-based alternatives and beverages.
  • The rising popularity of functional foods and consumer preference for natural preservation methods further support the segment's leadership.
  • The growing trend of plant-based and lactose-free fermented products is expanding the scope of products in innovative food formulations, solidifying the food & beverage sector’s pivotal role in market growth.

Top Cultures Market Dynamics

Strain customization is driving culture market differentiation by improving fermentation efficiency, product stability, and enabling tailored applications, especially in dairy and probiotics. Clean-label trends are accelerating culture adoption as food manufacturers reduce preservatives and enhance consumer trust with natural, live microbial solutions.

Strain Customization Drives Market Differentiation

Global producers are increasingly investing in proprietary microbial strains tailored for specific end-use applications such as enhanced flavor profiles, faster fermentation times, and improved shelf stability. Major culture suppliers in Europe and North America report that over 40% of new client requests in 2024 to 2025 focus on application-specific customization, particularly in dairy and plant-based sectors.

Tailored strains have enabled regional food processors in Southeast Asia to reduce curdling time by 19%, while North American probiotic drink manufacturers recorded a 16% rise in colony-forming unit (CFU) stability over 60-day storage. These functional upgrades are enabling premium positioning, regional taste adaptation, and IP protection for formulators.

  • Over 40% of 2024 to 2025 requests centered on strain-specific customization
  • Southeast Asian processors cut curdling time by 19% using tailored strains
  • Probiotic drink CFU stability rose 16% over 60 days in North America

Clean-Label Alignment Boosts Culture Adoption Across F&B

Shifting consumer preferences toward clean-label and additive-free products are accelerating the use of natural microbial products for preservation and functional benefits. In 2025, food manufacturers in Germany and Japan reported a 22% reduction in synthetic preservative usage after integrating protective products in fresh dairy and ready-to-eat meals.

Label simplification using "live active cultures" has improved consumer trust scores by 18% in key supermarket audits. This dynamic is particularly evident in plant-based yogurt and kimchi segments, where product developers leverage the product to meet both taste and clean-label criteria without compromising shelf life or safety.
  • 22% reduction in preservative use noted among German and Japanese producers
  • 18% boost in trust scores from clean-label positioning using “live cultures”
  • Plant-based yogurt brands adopt products to meet label, safety, and flavor goals

Top Countries Advancing Cultures Market Performance

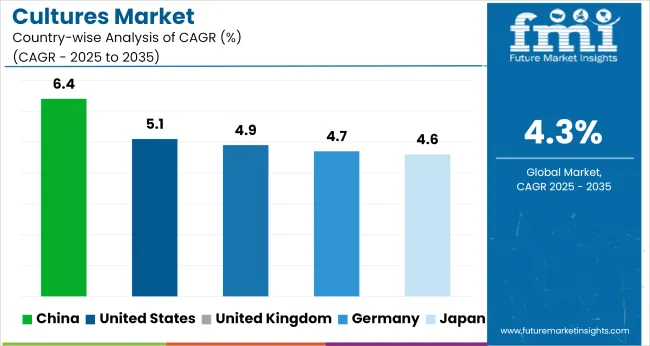
Cultures Market Cagr Analysis By Country

Country CAGR (2025 to 2035)
United States 5.1%
United Kingdom 4.9%
Germany 4.7%
China 6.4%
Japan 4.6%

A global CAGR of 4.3%, BRICS countries like Japan and China are expected to outpace the average, posting growth rates of 4.6% and 6.4% respectively. These above-average gains reflect strong demand for customized microbial strains in functional dairy, fermented beverages, and plant-based applications. India is scaling up local strain banks and licensing models for tiered supply contracts, while China is expanding pilot facilities focused on dual-function products for flavor and preservation.

OECD economies are growing below the global average. Germany is projected at 4.7% and the United Kingdom at 4.9%, as regulatory standardization and ingredient cost pressures temper experimentation. These markets are emphasizing yield-stability and shelf-life extension over innovation cycles. ASEAN countries, led by Indonesia and Thailand, are growing near 4.7% with demand tied to regional players producing cost-efficient curd, kombucha, and soy fermentation.

The report covers a detailed analysis of 40+ countries, and the top five countries have been shared as a reference.

Growth Analysis of the Cultures Market in the United States

The USA culture market stood at 3.9% between 2020 and 2024, and the market is projected to accelerate to a CAGR of 5.1% from 2025 to 2035, driven by customized microbial solutions and rising demand for fermented, functional, and gut-health-focused products. In the 2020 to 2024 period, market growth was steady but hindered by the saturation of conventional dairy and yogurt categories and high reliance on established strains.

After 2024, demand is rising due to innovation, probiotic-enhanced beverages, and the rise of plant-based and hybrid fermented products. Leading USA dairy brands are also expanding their microbial sourcing strategies to enhance product differentiation.

The USA regulatory environment for novel strains has become more streamlined, encouraging faster commercialization cycles and partnerships with academic institutions. Export demand for American-formulated functional dairy products is also helping domestic producers grow faster.

  • Rising application in non-dairy fermentation and personalized nutrition
  • Streamlined strain approval processes post to 2024
  • Growing B2B innovation demand from functional food and beverage startups

Future Outlook for Cultures Market in the United Kingdom

The UK culture market grew at a CAGR of 3.4% from 2020 to 2024, expanding below-average growth due to trade uncertainty and limited innovation investment post-Brexit. From 2025 to 2035, the market is forecast to grow at a significantly improved CAGR of 4.9%, owing to government support for food innovation hubs and expanded consumer demand for clean-label fermented foods.

The 2020 to 2024 period saw limited growth as import/export complexities and regulatory divergence from the EU disrupted the flow of microbial strains and delayed product development. Many local food processors prioritized reformulation over innovation during the COVID and inflation years.

From 2025 onward, the market is projected to rebound, driven by a resurgence in functional yogurt, probiotic drinks, and plant-based fermented alternatives, supported by UK-based culture manufacturers investing in R&D and supply chain localization. Consumers are also more health-conscious, creating stronger tailwinds for products in the health-oriented category.

  • Clarity in post-Brexit regulations is now enabling new product development
  • Government-led food innovation funding
  • Rising demand for clean-label, probiotic-enriched SKUs

Market Performance Review of the Cultures Market in Germany

Germany’s culture market expanded at a modest 3.5% CAGR during 2020 to 2024, slightly behind the global average, mainly due to regulatory conservatism and market saturation in traditional dairy. From 2025 to 2035, the market is expected to grow faster at a CAGR of 4.7%, supported by evolving consumer preferences, rising demand for natural probiotics, and government-led initiatives for bio-based food production.

The earlier period’s lower growth stemmed from slow adoption of new microbial strains, stringent EFSA health claim regulations, and cautious B2B investment in food tech. However, Germany’s robust research infrastructure and cross-collaboration between academia and the private sector are now stimulating the product value chain.

The 2025 to 2035 acceleration will also be fueled by demand for organic fermented foods, vegan yogurt, and cultured cheeses. Export-oriented German producers are also embracing smart fermentation for higher shelf-life and nutrition delivery.

  • Strong academic-industry collaborations fuel innovation
  • Growth in vegan and organic fermented segments
  • Regulatory support for bio-based and clean-label foods

Demand Forecast for Cultures Market in China

China’s cultural market grew at a robust CAGR of 5.6% from 2020 to 2024, outperforming the global average of 4.3%, supported by rapid urbanization, rising middle-class incomes, and growing awareness of gut health. The market is forecast to climb even higher with a CAGR of 6.4% from 2025 to 2035, as demand intensifies for personalized nutrition, premium probiotic beverages, and domestically developed culture strains.

During the earlier phase, the fast penetration of dairy and yogurt in second-tier cities, along with cross-border e-commerce of functional foods, accelerated demand for the product. By 2025, China is projected to lead in both volume and application diversity, with strong uptake in dairy, plant-based drinks, supplements, and fermented snacks. Local companies are also investing heavily in biotech fermentation infrastructure and indigenous strain development to reduce reliance on imports.

  • Strong consumer health awareness is driving probiotic adoption
  • Expansion in mid-tier cities and e-commerce
  • Government incentives for domestic strain production

Development Trends in the Culture Market in Japan

Japan’s cultural market grew at a relatively modest CAGR of 3.3% between 2020 and 2024, constrained by demographic stagnation and a highly saturated dairy segment. The market is forecast to grow at a healthier CAGR of 4.6% between 2025 and 2035, driven by innovation in elderly nutrition, personalized fermented beverages, and bioactive functional foods.

The earlier period’s slow growth was attributed to limited product launches beyond yogurt and miso, coupled with an aging population that decreased per capita consumption. Post to 2025, cultural preferences for wellness and longevity are aligning with new microbiome research to create demand for targeted probiotics and functional fermented beverages.

Japanese manufacturers are also exploring fermentation-based delivery systems for nutraceuticals and cosmeceuticals, opening new B2B and B2C growth opportunities. Collaborations between universities and legacy food companies are fostering next-gen strain development.
  • Expansion in elderly-targeted fermented products
  • Microbiome science influencing product R&D
  • Rise of cosmeceutical fermentation platforms

Leading Cultures Suppliers

Cultures Market Analysis By Company

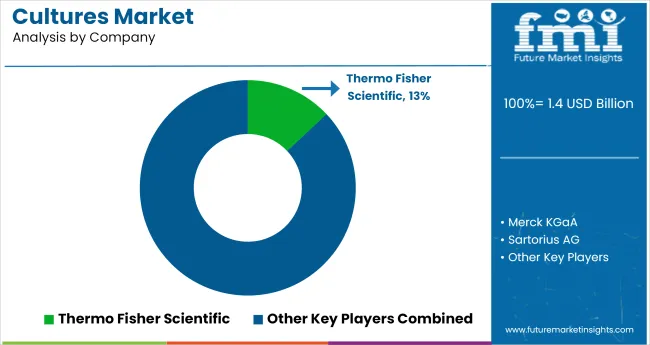
In the cultures market, leading companies such as Thermo Fisher Scientific, Merck KGaA, and DuPont de Nemours are advancing through precision strain development, integrated bioprocessing tools, and broad-spectrum culture media portfolios.

Firms like Lonza Group, Sartorius AG, and Danaher Corporation support both industrial and research-grade applications, offering scalability and compliance-driven solutions. These players are leveraging their biotechnology infrastructure and global reach to serve food, pharmaceutical, and environmental sectors with tailored microbial solutions and regulatory-backed innovation.

Mid-tier players, including Sigma-Aldrich, BD, GenScript Biotech, and Bio-Rad Laboratories, are enhancing competitiveness through rapid prototyping, gene synthesis, and robust QC capabilities. Novozymes A/S and Charles River focus on enzymes and biosecurity services, while Promega and Shimadzu are expanding analytical platforms, helping customers meet complex formulation needs.

Recent Cultures Industry News

  • In December 2024, Evonik announced a major restructuring, consolidating its business lines into two new divisions, Customized Solutions and Advanced Technologies, effective April 1, 2025.
  • Sartorius AG announced a major capacity expansion for biologics manufacturing in North America with the opening of its Center for Bioprocess Innovation in Marlborough, Massachusetts, in November 2024.

Leading Players

  • Thermo Fisher Scientific
  • Merck KGaA
  • Sartorius AG
  • Evonik Industries
  • Danaher Corporation
  • Charles River Laboratories
  • DuPont de Nemours
  • Lonza Group
  • Sigma-Aldrich
  • BD (Becton, Dickinson and Company)
  • GenScript Biotech Corporation
  • Bio-Rad Laboratories
  • Promega Corporation
  • Shimadzu Corporation
  • Novozymes A/S

Report Coverage and Scope Summary

Report Attributes Details
Market Size (2025) USD 1.4 billion
Projected Market Size (2035) USD 2.1 billion
CAGR (2025 to 2035) 4.3%
Base Year for Estimation 2024
Historical Period 2020 to 2024
Projections Period 2025 to 2035
Quantitative Units USD billion for value
Technology Type Analyzed (Segment 1) Standard Laboratory Cultures, Traditional Cultures, and Synthetic Cultures.
Origin Type Analyzed (Segment 2) Bacterial, Fungal, Viral, Algal, and Protozoan.
Applications Analyzed (Segment 3) Food & Beverage Industry, Pharmaceutical Research, Agricultural Biotechnology, Industrial Biotechnology, Environmental Solutions, and Others.
Regions Covered North America, Europe, Asia Pacific, Middle East & Africa, Latin America
Countries Covered United States, Canada, Germany, United Kingdom, France, Italy, Spain, China, Japan, South Korea, India, Australia, Brazil, Mexico, Argentina, Saudi Arabia, UAE, South Africa
Key Players Thermo Fisher Scientific, Merck KGaA, Sartorius AG, Evonik Industries, Danaher Corporation, Charles River Laboratories, DuPont de Nemours, Lonza Group, Sigma-Aldrich, BD (Becton, Dickinson and Company), GenScript Biotech Corporation, Bio-Rad Laboratories, Promega Corporation, Shimadzu Corporation, and Novozymes A/S
Additional Attributes Dollar sales, share, demand trends by application and region, leading competitors, pricing benchmarks, growth drivers, regulatory outlook, and end-user preferences shaping formulation needs.

Key Segments of the product Report

By Technology Type:

The industry is segmented into standard laboratory cultures, traditional cultures, and synthetic cultures.

By Origin Type:

The industry is segmented into bacterial, fungal, viral, algal, and protozoan.

By Application:

The industry finds applications in the food & beverage industry, pharmaceutical research, agricultural biotechnology, industrial biotechnology, environmental solutions, and others.

By Region:

The industry covers regions including North America, Europe, Asia Pacific, Latin America, and the Middle East & Africa.

Table of Content

  1. Executive Summary
    • Global Market Outlook
    • Demand-side Trends
    • Supply-side Trends
    • Technology Roadmap Analysis
    • Analysis and Recommendations
  2. Market Overview
    • Market Coverage / Taxonomy
    • Market Definition / Scope / Limitations
  3. Market Background
    • Market Dynamics
      • Drivers
      • Restraints
      • Opportunity
      • Trends
    • Scenario Forecast
      • Demand in Optimistic Scenario
      • Demand in Likely Scenario
      • Demand in Conservative Scenario
    • Opportunity Map Analysis
    • Product Life Cycle Analysis
    • Supply Chain Analysis
      • Supply Side Participants and their Roles
        • Producers
        • Mid-Level Participants (Traders/ Agents/ Brokers)
        • Wholesalers and Distributors
      • Value Added and Value Created at Node in the Supply Chain
      • List of Raw Material Suppliers
      • List of Existing and Potential Buyer’s
    • Investment Feasibility Matrix
    • Value Chain Analysis
      • Profit Margin Analysis
      • Wholesalers and Distributors
      • Retailers
    • PESTLE and Porter’s Analysis
    • Regulatory Landscape
      • By Key Regions
      • By Key Countries
    • Regional Parent Market Outlook
    • Production and Consumption Statistics
    • Import and Export Statistics
  4. Global Market Analysis 2020 to 2024 and Forecast, 2025 to 2035
    • Historical Market Size Value (USD Billion) Analysis, 2020 to 2024
    • Current and Future Market Size Value (USD Billion) Projections, 2025 to 2035
      • Y-o-Y Growth Trend Analysis
      • Absolute $ Opportunity Analysis
  5. Global Market Pricing Analysis 2020 to 2024 and Forecast 2025 to 2035
  6. Global Market Analysis 2020 to 2024 and Forecast 2025 to 2035, By Technology Type
    • Introduction / Key Findings
    • Historical Market Size Value (USD Billion) Analysis By Technology Type, 2020 to 2024
    • Current and Future Market Size Value (USD Billion) Analysis and Forecast By Technology Type, 2025 to 2035
      • Standard Laboratory Cultures
      • Traditional Cultures
      • Synthetic Cultures
    • Y-o-Y Growth Trend Analysis By Technology Type, 2020 to 2024
    • Absolute $ Opportunity Analysis By Technology Type, 2025 to 2035
  7. Global Market Analysis 2020 to 2024 and Forecast 2025 to 2035, By Origin Type
    • Introduction / Key Findings
    • Historical Market Size Value (USD Billion) Analysis By Origin Type, 2020 to 2024
    • Current and Future Market Size Value (USD Billion) Analysis and Forecast By Origin Type, 2025 to 2035
      • Bacterial
      • Fungal
      • Viral
      • Algal
      • Protozoan
    • Y-o-Y Growth Trend Analysis By Origin Type, 2020 to 2024
    • Absolute $ Opportunity Analysis By Origin Type, 2025 to 2035
  8. Global Market Analysis 2020 to 2024 and Forecast 2025 to 2035, By Application
    • Introduction / Key Findings
    • Historical Market Size Value (USD Billion) Analysis By Application, 2020 to 2024
    • Current and Future Market Size Value (USD Billion) Analysis and Forecast By Application, 2025 to 2035
      • Food & Beverage Industry
      • Pharmaceutical Research
      • Agricultural Biotechnology
      • Industrial Biotechnology
      • Environmental Solutions
      • Others
    • Y-o-Y Growth Trend Analysis By Application, 2020 to 2024
    • Absolute $ Opportunity Analysis By Application, 2025 to 2035
  9. Global Market Analysis 2020 to 2024 and Forecast 2025 to 2035, By Region
    • Introduction
    • Historical Market Size Value (USD Billion) Analysis By Region, 2020 to 2024
    • Current Market Size Value (USD Billion) Analysis and Forecast By Region, 2025 to 2035
      • North America
      • Latin America
      • Western Europe
      • Eastern Europe
      • East Asia
      • South Asia & Pacific
      • Middle East and Africa
    • Market Attractiveness Analysis By Region
  10. North America Market Analysis 2020 to 2024 and Forecast 2025 to 2035, By Country
    • Historical Market Size Value (USD Billion) Trend Analysis By Market Taxonomy, 2020 to 2024
    • Market Size Value (USD Billion) Forecast By Market Taxonomy, 2025 to 2035
      • By Country
        • USA
        • Canada
        • Mexico
      • By Technology Type
      • By Origin Type
      • By Application
    • Market Attractiveness Analysis
      • By Country
      • By Technology Type
      • By Origin Type
      • By Application
    • Key Takeaways
  11. Latin America Market Analysis 2020 to 2024 and Forecast 2025 to 2035, By Country
    • Historical Market Size Value (USD Billion) Trend Analysis By Market Taxonomy, 2020 to 2024
    • Market Size Value (USD Billion) Forecast By Market Taxonomy, 2025 to 2035
      • By Country
        • Brazil
        • Argentina
        • Rest of LATAM
      • By Technology Type
      • By Origin Type
      • By Application
    • Market Attractiveness Analysis
      • By Country
      • By Technology Type
      • By Origin Type
      • By Application
    • Key Takeaways
  12. Western Europe Market Analysis 2020 to 2024 and Forecast 2025 to 2035, By Country
    • Historical Market Size Value (USD Billion) Trend Analysis By Market Taxonomy, 2020 to 2024
    • Market Size Value (USD Billion) Forecast By Market Taxonomy, 2025 to 2035
      • By Country
        • Germany
        • Italy
        • France
        • UK
        • Spain
        • BENELUX
        • Nordic
        • Rest of W.Europe
      • By Technology Type
      • By Origin Type
      • By Application
    • Market Attractiveness Analysis
      • By Country
      • By Technology Type
      • By Origin Type
      • By Application
    • Key Takeaways
  13. Eastern Europe Market Analysis 2020 to 2024 and Forecast 2025 to 2035, By Country
    • Historical Market Size Value (USD Billion) Trend Analysis By Market Taxonomy, 2020 to 2024
    • Market Size Value (USD Billion) Forecast By Market Taxonomy, 2025 to 2035
      • By Country
        • Russia
        • Hungary
        • Poland
        • Balkan & Baltics
        • Rest of E. Europe
      • By Technology Type
      • By Origin Type
      • By Application
    • Market Attractiveness Analysis
      • By Country
      • By Technology Type
      • By Origin Type
      • By Application
    • Key Takeaways
  14. East Asia Market Analysis 2020 to 2024 and Forecast 2025 to 2035, By Country
    • Historical Market Size Value (USD Billion) Trend Analysis By Market Taxonomy, 2020 to 2024
    • Market Size Value (USD Billion) Forecast By Market Taxonomy, 2025 to 2035
      • By Country
        • China
        • Japan
        • South Korea
      • By Technology Type
      • By Origin Type
      • By Application
    • Market Attractiveness Analysis
      • By Country
      • By Technology Type
      • By Origin Type
      • By Application
    • Key Takeaways
  15. South Asia & Pacific Market Analysis 2020 to 2024 and Forecast 2025 to 2035, By Country
    • Historical Market Size Value (USD Billion) Trend Analysis By Market Taxonomy, 2020 to 2024
    • Market Size Value (USD Billion) Forecast By Market Taxonomy, 2025 to 2035
      • By Country
        • India
        • Australia & New Zealand
        • ASEAN
        • Rest of SAP
      • By Technology Type
      • By Origin Type
      • By Application
    • Market Attractiveness Analysis
      • By Country
      • By Technology Type
      • By Origin Type
      • By Application
    • Key Takeaways
  16. Middle East and Africa Market Analysis 2020 to 2024 and Forecast 2025 to 2035, By Country
    • Historical Market Size Value (USD Billion) Trend Analysis By Market Taxonomy, 2020 to 2024
    • Market Size Value (USD Billion) Forecast By Market Taxonomy, 2025 to 2035
      • By Country
        • GCC Countries
        • Northern Africa
        • South Africa
        • Turkiye
        • Rest of MEA
      • By Technology Type
      • By Origin Type
      • By Application
    • Market Attractiveness Analysis
      • By Country
      • By Technology Type
      • By Origin Type
      • By Application
    • Key Takeaways
  17. Key Countries Market Analysis
    • USA
      • Pricing Analysis
      • Market Share Analysis, 2024
        • By Technology Type
        • By Origin Type
        • By Application
    • Canada
      • Pricing Analysis
      • Market Share Analysis, 2024
        • By Technology Type
        • By Origin Type
        • By Application
    • Brazil
      • Pricing Analysis
      • Market Share Analysis, 2024
        • By Technology Type
        • By Origin Type
        • By Application
    • Mexico
      • Pricing Analysis
      • Market Share Analysis, 2024
        • By Technology Type
        • By Origin Type
        • By Application
    • Argentina
      • Pricing Analysis
      • Market Share Analysis, 2024
        • By Technology Type
        • By Origin Type
        • By Application
  18. Market Structure Analysis
    • Competition Dashboard
    • Competition Benchmarking
    • Market Share Analysis of Top Players
      • By Regional
      • By Technology Type
      • By Origin Type
      • By Application
  19. Competition Analysis
    • Competition Deep Dive
      • Thermo Fisher Scientific
        • Overview
        • Product Portfolio
        • Profitability by Market Segments (Product/Age /Sales Channel/Region)
        • Sales Footprint
        • Strategy Overview
          • Marketing Strategy
          • Product Strategy
          • Channel Strategy
      • Merck KGaA
        • Overview
        • Product Portfolio
        • Profitability by Market Segments (Product/Age /Sales Channel/Region)
        • Sales Footprint
        • Strategy Overview
          • Marketing Strategy
          • Product Strategy
          • Channel Strategy
      • Sartorius AG
        • Overview
        • Product Portfolio
        • Profitability by Market Segments (Product/Age /Sales Channel/Region)
        • Sales Footprint
        • Strategy Overview
          • Marketing Strategy
          • Product Strategy
          • Channel Strategy
      • Evonik Industries
        • Overview
        • Product Portfolio
        • Profitability by Market Segments (Product/Age /Sales Channel/Region)
        • Sales Footprint
        • Strategy Overview
          • Marketing Strategy
          • Product Strategy
          • Channel Strategy
      • Danaher Corporation
        • Overview
        • Product Portfolio
        • Profitability by Market Segments (Product/Age /Sales Channel/Region)
        • Sales Footprint
        • Strategy Overview
          • Marketing Strategy
          • Product Strategy
          • Channel Strategy
      • Charles River Laboratories
        • Overview
        • Product Portfolio
        • Profitability by Market Segments (Product/Age /Sales Channel/Region)
        • Sales Footprint
        • Strategy Overview
          • Marketing Strategy
          • Product Strategy
          • Channel Strategy
      • DuPont de Nemours
        • Overview
        • Product Portfolio
        • Profitability by Market Segments (Product/Age /Sales Channel/Region)
        • Sales Footprint
        • Strategy Overview
          • Marketing Strategy
          • Product Strategy
          • Channel Strategy
      • Lonza Group
        • Overview
        • Product Portfolio
        • Profitability by Market Segments (Product/Age /Sales Channel/Region)
        • Sales Footprint
        • Strategy Overview
          • Marketing Strategy
          • Product Strategy
          • Channel Strategy
      • Sigma-Aldrich
        • Overview
        • Product Portfolio
        • Profitability by Market Segments (Product/Age /Sales Channel/Region)
        • Sales Footprint
        • Strategy Overview
          • Marketing Strategy
          • Product Strategy
          • Channel Strategy
      • BD (Becton, Dickinson and Company)
        • Overview
        • Product Portfolio
        • Profitability by Market Segments (Product/Age /Sales Channel/Region)
        • Sales Footprint
        • Strategy Overview
          • Marketing Strategy
          • Product Strategy
          • Channel Strategy
      • GenScript Biotech Corporation
        • Overview
        • Product Portfolio
        • Profitability by Market Segments (Product/Age /Sales Channel/Region)
        • Sales Footprint
        • Strategy Overview
          • Marketing Strategy
          • Product Strategy
          • Channel Strategy
      • Bio-Rad Laboratories
        • Overview
        • Product Portfolio
        • Profitability by Market Segments (Product/Age /Sales Channel/Region)
        • Sales Footprint
        • Strategy Overview
          • Marketing Strategy
          • Product Strategy
          • Channel Strategy
      • Promega Corporation
        • Overview
        • Product Portfolio
        • Profitability by Market Segments (Product/Age /Sales Channel/Region)
        • Sales Footprint
        • Strategy Overview
          • Marketing Strategy
          • Product Strategy
          • Channel Strategy
      • Shimadzu Corporation
        • Overview
        • Product Portfolio
        • Profitability by Market Segments (Product/Age /Sales Channel/Region)
        • Sales Footprint
        • Strategy Overview
          • Marketing Strategy
          • Product Strategy
          • Channel Strategy
      • Novozymes A/S
        • Overview
        • Product Portfolio
        • Profitability by Market Segments (Product/Age /Sales Channel/Region)
        • Sales Footprint
        • Strategy Overview
          • Marketing Strategy
          • Product Strategy
          • Channel Strategy
      • Others
        • Overview
        • Product Portfolio
        • Profitability by Market Segments (Product/Age /Sales Channel/Region)
        • Sales Footprint
        • Strategy Overview
          • Marketing Strategy
          • Product Strategy
          • Channel Strategy
  20. Assumptions & Acronyms Used
  21. Research Methodology

List of Tables

  • Table 1: Global Market Value (USD Billion) Forecast by Region, 2020-2035
  • Table 2: Global Market Value (USD Billion) Forecast by Technology Type, 2020-2035
  • Table 3: Global Market Value (USD Billion) Forecast by Origin Type, 2020-2035
  • Table 4: Global Market Value (USD Billion) Forecast by Application, 2020-2035
  • Table 5: North America Market Value (USD Billion) Forecast by Country, 2020-2035
  • Table 6: North America Market Value (USD Billion) Forecast by Technology Type, 2020-2035
  • Table 7: North America Market Value (USD Billion) Forecast by Origin Type, 2020-2035
  • Table 8: North America Market Value (USD Billion) Forecast by Application, 2020-2035
  • Table 9: Latin America Market Value (USD Billion) Forecast by Country, 2020-2035
  • Table 10: Latin America Market Value (USD Billion) Forecast by Technology Type, 2020-2035
  • Table 11: Latin America Market Value (USD Billion) Forecast by Origin Type, 2020-2035
  • Table 12: Latin America Market Value (USD Billion) Forecast by Application, 2020-2035
  • Table 13: Western Europe Market Value (USD Billion) Forecast by Country, 2020-2035
  • Table 14: Western Europe Market Value (USD Billion) Forecast by Technology Type, 2020-2035
  • Table 15: Western Europe Market Value (USD Billion) Forecast by Origin Type, 2020-2035
  • Table 16: Western Europe Market Value (USD Billion) Forecast by Application, 2020-2035
  • Table 17: Eastern Europe Market Value (USD Billion) Forecast by Country, 2020-2035
  • Table 18: Eastern Europe Market Value (USD Billion) Forecast by Technology Type, 2020-2035
  • Table 19: Eastern Europe Market Value (USD Billion) Forecast by Origin Type, 2020-2035
  • Table 20: Eastern Europe Market Value (USD Billion) Forecast by Application, 2020-2035
  • Table 21: East Asia Market Value (USD Billion) Forecast by Country, 2020-2035
  • Table 22: East Asia Market Value (USD Billion) Forecast by Technology Type, 2020-2035
  • Table 23: East Asia Market Value (USD Billion) Forecast by Origin Type, 2020-2035
  • Table 24: East Asia Market Value (USD Billion) Forecast by Application, 2020-2035
  • Table 25: South Asia & Pacific Market Value (USD Billion) Forecast by Country, 2020-2035
  • Table 26: South Asia & Pacific Market Value (USD Billion) Forecast by Technology Type, 2020-2035
  • Table 27: South Asia & Pacific Market Value (USD Billion) Forecast by Origin Type, 2020-2035
  • Table 28: South Asia & Pacific Market Value (USD Billion) Forecast by Application, 2020-2035
  • Table 29: Middle East and Africa Market Value (USD Billion) Forecast by Country, 2020-2035
  • Table 30: Middle East and Africa Market Value (USD Billion) Forecast by Technology Type, 2020-2035
  • Table 31: Middle East and Africa Market Value (USD Billion) Forecast by Origin Type, 2020-2035
  • Table 32: Middle East and Africa Market Value (USD Billion) Forecast by Application, 2020-2035

List of Figures

  • Figure 1: Global Market Pricing Analysis
  • Figure 2: Global Market Value (USD Billion) Forecast 2020-2035
  • Figure 3: Global Market Value Share and BPS Analysis by Technology Type, 2025 and 2035
  • Figure 4: Global Market Y-o-Y Growth Comparison by Technology Type, 2025-2035
  • Figure 5: Global Market Attractiveness Analysis by Technology Type
  • Figure 6: Global Market Value Share and BPS Analysis by Origin Type, 2025 and 2035
  • Figure 7: Global Market Y-o-Y Growth Comparison by Origin Type, 2025-2035
  • Figure 8: Global Market Attractiveness Analysis by Origin Type
  • Figure 9: Global Market Value Share and BPS Analysis by Application, 2025 and 2035
  • Figure 10: Global Market Y-o-Y Growth Comparison by Application, 2025-2035
  • Figure 11: Global Market Attractiveness Analysis by Application
  • Figure 12: Global Market Value (USD Billion) Share and BPS Analysis by Region, 2025 and 2035
  • Figure 13: Global Market Y-o-Y Growth Comparison by Region, 2025-2035
  • Figure 14: Global Market Attractiveness Analysis by Region
  • Figure 15: North America Market Incremental $ Opportunity, 2025-2035
  • Figure 16: Latin America Market Incremental $ Opportunity, 2025-2035
  • Figure 17: Western Europe Market Incremental $ Opportunity, 2025-2035
  • Figure 18: Eastern Europe Market Incremental $ Opportunity, 2025-2035
  • Figure 19: East Asia Market Incremental $ Opportunity, 2025-2035
  • Figure 20: South Asia & Pacific Market Incremental $ Opportunity, 2025-2035
  • Figure 21: Middle East and Africa Market Incremental $ Opportunity, 2025-2035
  • Figure 22: North America Market Value Share and BPS Analysis by Country, 2025 and 2035
  • Figure 23: North America Market Value Share and BPS Analysis by Technology Type, 2025 and 2035
  • Figure 24: North America Market Y-o-Y Growth Comparison by Technology Type, 2025-2035
  • Figure 25: North America Market Attractiveness Analysis by Technology Type
  • Figure 26: North America Market Value Share and BPS Analysis by Origin Type, 2025 and 2035
  • Figure 27: North America Market Y-o-Y Growth Comparison by Origin Type, 2025-2035
  • Figure 28: North America Market Attractiveness Analysis by Origin Type
  • Figure 29: North America Market Value Share and BPS Analysis by Application, 2025 and 2035
  • Figure 30: North America Market Y-o-Y Growth Comparison by Application, 2025-2035
  • Figure 31: North America Market Attractiveness Analysis by Application
  • Figure 32: Latin America Market Value Share and BPS Analysis by Country, 2025 and 2035
  • Figure 33: Latin America Market Value Share and BPS Analysis by Technology Type, 2025 and 2035
  • Figure 34: Latin America Market Y-o-Y Growth Comparison by Technology Type, 2025-2035
  • Figure 35: Latin America Market Attractiveness Analysis by Technology Type
  • Figure 36: Latin America Market Value Share and BPS Analysis by Origin Type, 2025 and 2035
  • Figure 37: Latin America Market Y-o-Y Growth Comparison by Origin Type, 2025-2035
  • Figure 38: Latin America Market Attractiveness Analysis by Origin Type
  • Figure 39: Latin America Market Value Share and BPS Analysis by Application, 2025 and 2035
  • Figure 40: Latin America Market Y-o-Y Growth Comparison by Application, 2025-2035
  • Figure 41: Latin America Market Attractiveness Analysis by Application
  • Figure 42: Western Europe Market Value Share and BPS Analysis by Country, 2025 and 2035
  • Figure 43: Western Europe Market Value Share and BPS Analysis by Technology Type, 2025 and 2035
  • Figure 44: Western Europe Market Y-o-Y Growth Comparison by Technology Type, 2025-2035
  • Figure 45: Western Europe Market Attractiveness Analysis by Technology Type
  • Figure 46: Western Europe Market Value Share and BPS Analysis by Origin Type, 2025 and 2035
  • Figure 47: Western Europe Market Y-o-Y Growth Comparison by Origin Type, 2025-2035
  • Figure 48: Western Europe Market Attractiveness Analysis by Origin Type
  • Figure 49: Western Europe Market Value Share and BPS Analysis by Application, 2025 and 2035
  • Figure 50: Western Europe Market Y-o-Y Growth Comparison by Application, 2025-2035
  • Figure 51: Western Europe Market Attractiveness Analysis by Application
  • Figure 52: Eastern Europe Market Value Share and BPS Analysis by Country, 2025 and 2035
  • Figure 53: Eastern Europe Market Value Share and BPS Analysis by Technology Type, 2025 and 2035
  • Figure 54: Eastern Europe Market Y-o-Y Growth Comparison by Technology Type, 2025-2035
  • Figure 55: Eastern Europe Market Attractiveness Analysis by Technology Type
  • Figure 56: Eastern Europe Market Value Share and BPS Analysis by Origin Type, 2025 and 2035
  • Figure 57: Eastern Europe Market Y-o-Y Growth Comparison by Origin Type, 2025-2035
  • Figure 58: Eastern Europe Market Attractiveness Analysis by Origin Type
  • Figure 59: Eastern Europe Market Value Share and BPS Analysis by Application, 2025 and 2035
  • Figure 60: Eastern Europe Market Y-o-Y Growth Comparison by Application, 2025-2035
  • Figure 61: Eastern Europe Market Attractiveness Analysis by Application
  • Figure 62: East Asia Market Value Share and BPS Analysis by Country, 2025 and 2035
  • Figure 63: East Asia Market Value Share and BPS Analysis by Technology Type, 2025 and 2035
  • Figure 64: East Asia Market Y-o-Y Growth Comparison by Technology Type, 2025-2035
  • Figure 65: East Asia Market Attractiveness Analysis by Technology Type
  • Figure 66: East Asia Market Value Share and BPS Analysis by Origin Type, 2025 and 2035
  • Figure 67: East Asia Market Y-o-Y Growth Comparison by Origin Type, 2025-2035
  • Figure 68: East Asia Market Attractiveness Analysis by Origin Type
  • Figure 69: East Asia Market Value Share and BPS Analysis by Application, 2025 and 2035
  • Figure 70: East Asia Market Y-o-Y Growth Comparison by Application, 2025-2035
  • Figure 71: East Asia Market Attractiveness Analysis by Application
  • Figure 72: South Asia & Pacific Market Value Share and BPS Analysis by Country, 2025 and 2035
  • Figure 73: South Asia & Pacific Market Value Share and BPS Analysis by Technology Type, 2025 and 2035
  • Figure 74: South Asia & Pacific Market Y-o-Y Growth Comparison by Technology Type, 2025-2035
  • Figure 75: South Asia & Pacific Market Attractiveness Analysis by Technology Type
  • Figure 76: South Asia & Pacific Market Value Share and BPS Analysis by Origin Type, 2025 and 2035
  • Figure 77: South Asia & Pacific Market Y-o-Y Growth Comparison by Origin Type, 2025-2035
  • Figure 78: South Asia & Pacific Market Attractiveness Analysis by Origin Type
  • Figure 79: South Asia & Pacific Market Value Share and BPS Analysis by Application, 2025 and 2035
  • Figure 80: South Asia & Pacific Market Y-o-Y Growth Comparison by Application, 2025-2035
  • Figure 81: South Asia & Pacific Market Attractiveness Analysis by Application
  • Figure 82: Middle East and Africa Market Value Share and BPS Analysis by Country, 2025 and 2035
  • Figure 83: Middle East and Africa Market Value Share and BPS Analysis by Technology Type, 2025 and 2035
  • Figure 84: Middle East and Africa Market Y-o-Y Growth Comparison by Technology Type, 2025-2035
  • Figure 85: Middle East and Africa Market Attractiveness Analysis by Technology Type
  • Figure 86: Middle East and Africa Market Value Share and BPS Analysis by Origin Type, 2025 and 2035
  • Figure 87: Middle East and Africa Market Y-o-Y Growth Comparison by Origin Type, 2025-2035
  • Figure 88: Middle East and Africa Market Attractiveness Analysis by Origin Type
  • Figure 89: Middle East and Africa Market Value Share and BPS Analysis by Application, 2025 and 2035
  • Figure 90: Middle East and Africa Market Y-o-Y Growth Comparison by Application, 2025-2035
  • Figure 91: Middle East and Africa Market Attractiveness Analysis by Application
  • Figure 92: Global Market - Tier Structure Analysis
  • Figure 93: Global Market - Company Share Analysis

Frequently Asked Questions

What is the estimated market size of the culture industry in 2025?

The industry is valued at USD 1.4 billion in 2025.

What is the projected industry size of the cultures industry by 2035?

It is forecasted to reach USD 2.1 billion by 2035.

What is the expected CAGR for the culture industry between 2025 and 2035?

The industry is anticipated to grow at a CAGR of 4.3% during this period.

Which segment is expected to lead the cultures market in 2025?

Bacterial cultures are projected to lead the market with a 60% share in 2025.

Which region is expected to witness the highest growth in the cultures market?

Asia Pacific, particularly China, is expected to be the key growth region with a projected growth rate of 6.4%.

Explore Similar Insights

Future Market Insights

Cultures Market