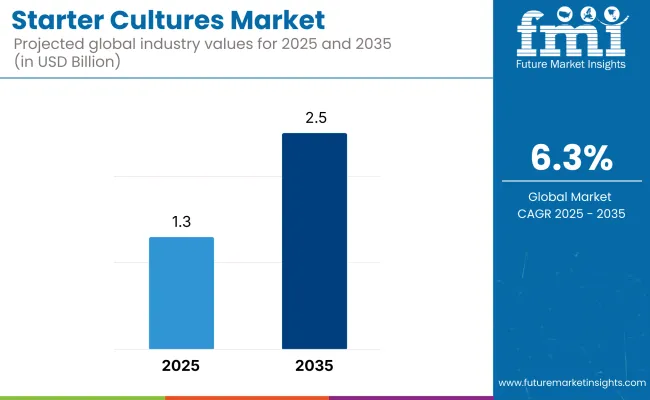
The global starter cultures market is projected to be valued at USD 1.3 billion in 2025. It is anticipated to reach USD 2.5 billion by 2035, expanding at a CAGR of 6.3% during the forecast period.
Currently, there is a strong growth phase, mainly due to the heightened demand for drinks and foods that are probiotic in nature, food safety, and the increased knowledge around microbial probiotics' health advantages. Starter cultures, composed of a combination of beneficial bacteria, yeasts, and molds, have a diverse range of applications in sectors such as dairy, bakery, meat, and beverage, where they are used to induce controlled fermentation, improve texture, and extend shelf life. The pervasiveness of functional and natural foods is another factor that generates further momentum.
An essential marketing driver is the rising consumer preference for probiotic-rich and fermented foods, such as yogurt, cheese, sourdough bread, and fermented meats. Moreover, the use of these cultures to increase intestinal health, enhance nutrient absorption, and support immune function has enabled them to become a vital part of the formulation of functional foods. By the way, the whole trend toward clean-label and less processed food products goes along with the driver for the natural fermentation of food.
The increase in fermented cultures is also due to the boost in the dairy and alternative dairy sectors. A factor that proves this is the fact that plant yogurt, cheese, and probiotic drinks, which are the most sought-after products, are being developed. Therefore, the fermentation culture is added as a non-dairy product to the beans. Additionally, the craft beer and specialty beverage industry have tailored and applied cultures to give products different flavor, texture, and stability characteristics.
Moreover, technological progress in strain development, fermentation control, and freeze-drying techniques has led to an increase in these cultures' efficiency, stability, and versatility. Innovations in strain selection and genetic engineering give manufacturers the chance to produce personalized cultures that not only contribute to the visual aspects of food but also improve the nutritional value of their products while at the same time ensuring uniformity in product quality.
However, obstacles such as rigorous regulatory approvals for microbial strains, inconsistency in fermentation efficiency, and the need for specific storage conditions for the culture to be viable exist. Likewise, competition from chemical preservatives and other alternatives to food preservation methods is another negative factor affecting growth.
Although these challenges may arise, there is scope for growth. The expansion of these cultures in the plant-based dairy sector, functional beverages, and artisanal foods will spur this growth. Also, investing in biotechnological research and sustainable fermentation solutions will be based on further innovations.
| Attributes | Description |
|---|---|
| Estimated Business Size (2025E) | USD 1.3 billion |
| Projected Business Value (2035F) | USD 2.5 billion |
| Value-based CAGR (2025 to 2035) | 6.3% |
The industry is witnessing strong growth because of the rising demand for fermented foods, functional drinks, and clean-label products. In the dairy industry, these cultures play a crucial role in the manufacture of yogurt, cheese, and probiotic foods, with innovation being driven by the diversity of strains and greater probiotic benefits.
Microbial cultures are being used more extensively in beverages, most notably kombucha, kefir, and other fermented beverages, to enhance flavor and shelf life. These cultures are also used in meat and seafood, especially dry-cured meats, to preserve, improve texture, and enhance flavor.
The bakery industry is embracing the use of these cultures for sourdough fermentation as a response to consumers' desire for natural, preservative-free bread. With limited demand for animal feed at present, research into gut health benefits and probiotic uses is propelling potential growth. Companies that focus on strain-specific functionality, sustainable production, and clean-label solutions will prosper.
During 2020 to 2024, there was a high growth owing to increasing demand for fermented foods, probiotics, and functional dairy. Customers increasingly looked for natural, clean-label foods with health advantages, which created a boom in yogurt, cheese, and plant-based fermented foods with added probiotics. Microbiome innovations brought the importance of these cultures in gut health to the forefront, encouraging innovation in strain development and fermentation technology.
The dairy industry remained a primary user, with non-dairy applications such as plant-based cheese and fermented beverages growing in popularity. Improved technology facilitated precision fermentation, leading to greater consistency and quality of cultures. However, setbacks like strain stability, compliance with regulations, and supply chain interruption affected the industry, and strategic research and production efficiency investments were needed.
Between 2025 and 2035, growth is anticipated with the adoption of AI-based microbial engineering, streamlining strain development for superior functional properties. Personalized cultures derived from individual gut microbiomes will be fueled by customized nutrition. Strain viability will be boosted through biotechnology advances, extending shelf life and process resistance. Fermentation technology becomes more automated, with improved process efficiency and scalability for large-quantity production.
The alternative proteins industry will experience broader use of these cultures in precision-fermented milk and cultured meat, as well as non-food uses such as biopharmaceuticals and biodegradable materials.
Regulatory frameworks will exist to facilitate gene-augmented cultures, and blockchain traceability platforms will facilitate quality control. Sustainability will be at the forefront, and innovative resource-saving fermentation technologies will reduce the environmental footprint.
A Comparative Market Shift Analysis (2020 to 2024 vs. 2025 to 2035)
| 2020 to 2024 | 2025 to 2035 |
|---|---|
| Probiotics and functional fermented foods have increasing demand. | Personalized cultures designed to target specific gut microbiomes. |
| Dairy still leads but with increasing penetration in plant-based alternatives. | Entry into alternative proteins, cultured meat, and precision-fermented dairy. |
| Innovations in fermentation that improve product consistency and quality. | AI-optimized strain enhancement of functionality and efficacy. |
| Increased demand for clean-label, natural ingredients by consumers. | Biotechnology-facilitated strain viability and resilience improvement. |
| Regulatory hurdles in strain approval and compliance. | Adaptation of regulatory frameworks to accept optimized microbial strains. |
| Expansion in non-dairy markets like plant cheese and kombucha. | Incorporation into non-food industries, such as pharmaceuticals and bioplastics. |
| Supply chain disruptions affecting availability and price. | Blockchain-based traceability guarantees quality and authenticity. |
There are supply chain risks because of the dependence on specific microbial strains and fermentation technologies. The availability of raw materials, contamination risks, and transport challenges are some of the variables that may lead to failure. Companies should implement the latest storage practices, procure from various suppliers, and conduct rigorous quality control procedures to ensure product safety at all times.
Another serious threat is regulatory issues, especially since every country has its own rules regarding the use of microbial cultures in food and beverages. Constant surveillance is required for compliance with safety, labeling, and new food approvals. Enterprises should be informed about legislative changes, make the documentation simple, and cooperate with the authorities to maintain a legal regime.
The primary barriers faced are product competition and differentiation. The craze of eating more probiotic and functional foods drives multiple companies, and this increases competition among them. To keep their leading position and maintain revenue shares, companies must concentrate on innovation, research on novel microbial strains, and advanced product formulations.
Environmental sustainability in microbial strain sourcing and industrial fermentation waste handling also influences the industry. Businesses must apply environmentally friendly processing, establish a waste reduction program, and use sustainable packaging to meet environmental regulations and consumer demand.
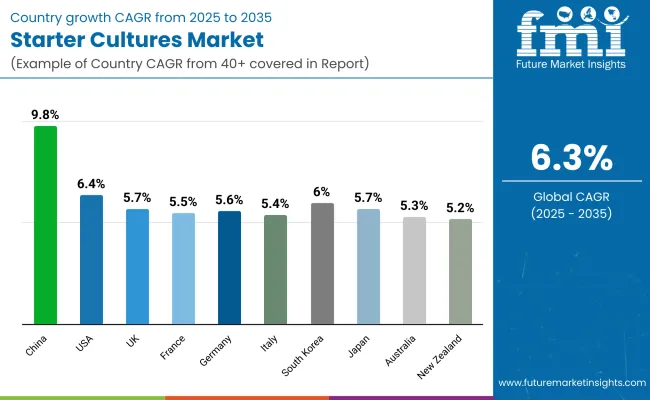
| Countries | CAGR (2025 to 2035) |
|---|---|
| China | 9.8% |
| USA | 6.4% |
| UK | 5.7% |
| France | 5.5% |
| Germany | 5.6% |
| Italy | 5.4% |
| South Korea | 6.0% |
| Japan | 5.7% |
| Australia | 5.3% |
| New Zealand | 5.2% |
China will dominate with a projected CAGR of 9.8% during the 2025 to 2035 period. Increased demand for fermented food products, such as traditional dairy food products like yogurt and new uses like probiotic drinks, is the leading driver for sales growth in China. Government-driven policies to enhance food quality and safety accelerated the use of commercial cultures.
Moreover, growing Chinese consumer demand for gut health-boosting functional foods has propelled demand. Local firms are heavily investing in R&D to develop innovative fermentation solutions for exports. With the growing urbanization and disposable income, penetration of fermented food products is increasing, thus driving the growth.
The USA is set to grow at a CAGR of 6.4% during 2025 to 2035. It is being driven by one of the key drivers, and this is the trend towards more artisan and craft fermented foods like sourdough bread and gourmet cheeses. Consumers are making healthy food choices, and this is driving the demand for probiotic-fermented foods and naturally fermented foods.
Along with this, the food sector is also leveraging the plant-based industry more and more to create foods that are more flavorful and textured, thereby increasing the demand for these cultures. Food safety legislation and process technology in fermentation are also pushing the industry. The companies are trying to produce more functional and strong cultures to satisfy the varied demands of the food sector in the USA
The UK will expand at a CAGR of 5.7% during 2025 to 2035. The rise in demand for fermented dairy and non-dairy foods, especially in the urban segment, is fueling growth. Rising health awareness of the benefits of probiotics has been a key trend driver. Growing demand for craft beer and artisanal cheese is also fueling demand for specialty cultures.
The enormous industry demand for food and beverages with innovation, such as low-sugar foods and organic fermented foods, is also fueling further growth. The extremely high food safety standards in the UK, along with additional investments being made in the technology of fermentation, also remain key drivers of growth.
France is expected to register a CAGR of 5.5% over the forecast period. The nation's traditional use of fermented milk foods, like cheese and yogurt, is still the norm. Export demand for premium French cheese initially lags behind this demand for premium quality cultures. Demand for functional foods to feed healthy guts is also propelling innovation in fermented foods. French food manufacturers are beginning to apply high-tech fermentation to respond to new diet trends, i.e., plant-based alternatives.
Germany will likely achieve a CAGR of 5.6% during 2025 to 2035 for the starter culture market. Germany's strong dairy sector and growing demand for organic and probiotic foods are driving demand. Increasing demand for fermented meat and plant-based dairy products is fueling growth.
Germany's quality standards and precision fermentation technology developments are major drivers for consistent expansion. In addition, increased food production sustainability and waste reduction awareness require the implementation of new culture solutions.
Italy's starter culture market is projected to increase by 5.4% between 2025 and 2035. Its rich culinary tradition, particularly cured meat and cheese manufacture, remains the driving force for sales expansion. International demand for true Italian specialties such as Parmigiano Reggiano and Prosciutto by export has generated investment in high-quality fermentation technology.
Growing interest among consumers for natural and additive-free food is encouraging manufacturers to enhance fermentation processes. The growth of organic food sales is also driving the clean-label fermented product industry, which is fueling the industry for these cultures.
South Korea will expand at a growth rate of 6.0% in the starter culture market in the forecast period. The country's traditional food culture, with fermented products such as kimchi and native wines made from rice, is driving growth. Growing consumer demand for standardized fermentation processes used in bulk processing is also driving growth.
Moreover, developments in biotechnology and precision fermentation are enabling the manufacturing of tailor-made cultures to meet the domestic and global industries. The increasing need for functional food and gut awareness is also enhancing growth.
Japanese starter cultures will continue to grow at a 5.7% CAGR from 2025 to 2035. Common use of fermentation technology in the food processing of everything from soy sauce and miso to sake and natto is still generating high demand for better cultures.
Growing consumer demand for health-enhancing fermented foods, such as probiotic-fortified beverages, is driving trends. Japanese food companies are investing in emerging fermentation technologies to maintain product integrity and handle shifting consumer tastes. Regulatory frameworks for food safety and quality control are also influencing the trend.
Australia is projected to grow at a 5.3% CAGR in the starter culture market between 2025 and 2035. Increased adoption of fermented milk foods such as yogurt and cheese is driving the industry. Increased demand for probiotic and plant-based foods is also driving innovation in the fermentation process and means.
Growth in the organic food industry is also driving demand for natural cultures. Australian food manufacturers are focusing on enhancing the efficiency in fermentation and consistency of products to cater to the increasing demand for quality fermented food.
New Zealand's market for starter cultures will register a growth of 5.2% CAGR during the forecast period. One of the major growth drivers is New Zealand's strong dairy industry, and increasing worldwide demand for premium-quality New Zealand dairy products is fueling growth.
Growth in functional foods and health-oriented consumption behavior is spurring the consumption of probiotic-fortified fermented food. Besides, government pro-food safety policies and improvements in the fermentation process are also fueling growth. Local players are embracing new solutions to widen product differentiation and export opportunities.
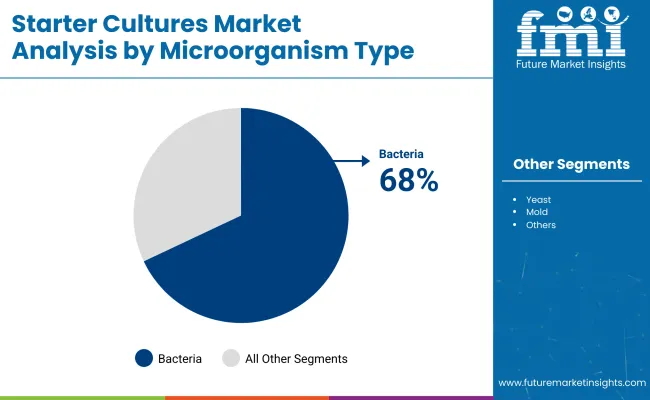
| Segment | Value Share (2025) |
|---|---|
| Bacteria (By Microorganism Type) | 68% |
In 2025, bacteria-based cultures are the most common cultures, accounting for 68% of the total revenue share. These bacterial cultures, primarily lactic acid bacteria (LAB) such as Lactobacillus and Streptococcus, are responsible for dairy fermentation (e.g., yogurt and cheese), meat preservation, and probiotics. Companies such as Chr. Look out for Hansen, DuPont (IFF), and Lallemand in this space, providing innovative bacterial cultures to accommodate end uses. Chr. Yogurt formulations with Hansen's YoFlex® and Nu-Trish® cultures boost probiotic effects, offering gut-healing and longevity benefits.
Yeast-based starter cultures, which make up 18%, are primarily consumed in baking, brewing, and winemaking. The yeast most commonly used for both bread-making and alcoholic beverages is Saccharomyces cerevisiae. Lesaffre - a world leader in yeast and fermentation - offers high-performing yeast solutions such as Saf-instant®, which many commercial bakeries use to achieve reliable dough expansion and enhance flavors. AB Mauri similarly offers special yeast cultures for artisanal and industrial-size craft work.
This leads to an increasing demand for the use of clean-label and natural fermentation solutions, leading to increased innovations. Companies are investing in strains that are non-GMO and bioengineered and looking for ways to replicate the "old-time" feel of American cuisine in response to consumer palates that increasingly seek healthier, minimally processed foods.
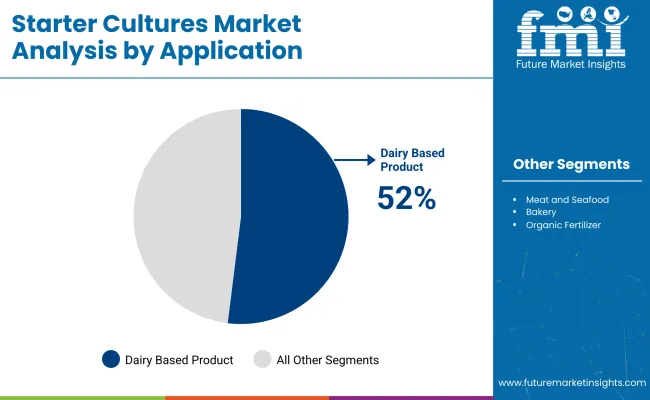
| Segment | Value Share (2025) |
|---|---|
| Starter Culture for Dairy and Dairy-based Products (By Application) | 52% |
The dairy and dairy-based products segment is anticipated to dominate, accounting for 52% of the share in 2025. As this converts lactose (milk sugar) into lactic acid, starter cultures are crucial for fermenting dairy products like yogurt, cheese, kefir, and buttermilk, enhancing texture, flavor, and shelf life-leading companies like Chr.
One of the ODIBACs, Hansen's FloraDanica yogurt cultures (some of which also come under the DuPont (IFF) umbrella), and Lallemand have advanced proprietary strains of these through Lactobacillus and Streptococcus thermophilus, which maximize the benefits of probiotics qualitatively and quantitatively. For example, Chr. Global dairy brands use Hansen's YoFlex® and Nu-Trish® cultures to enhance gut health benefits.
The meat and seafood segment accounts for 15% of the total industry share. It uses starter cultures for fermentation, preservation, and flavor development in products such as salami, dry-cured sausages, and fermented fish. These cultures not only aid in inhibiting harmful bacteria like Listeria but also improve texture and flavor.
To ensure safety and flavor standardization, meat processors are now supplied with Pediococcus and Lactobacillus-based cultures by companies such as Biochem, DuPont (IFF), and Sacco System. For example, Sacco System's Lyocarni® cultures are made for the stable and controlled fermentation of meat to prevent spoilage.
Both segments are growing due to the increasing demand for clean label & natural preservation solutions. Dairy is still the biggest part of this world, but the growth of plant-based dairy alternatives is driving innovation in non-dairy fermentation. It may lead to an expanded role for starter cultures in the manufacture of non-dairy products. The increasing consumption of fermented meat products in Europe and North America is also likely to offer steady growth for the meat & seafood segment.
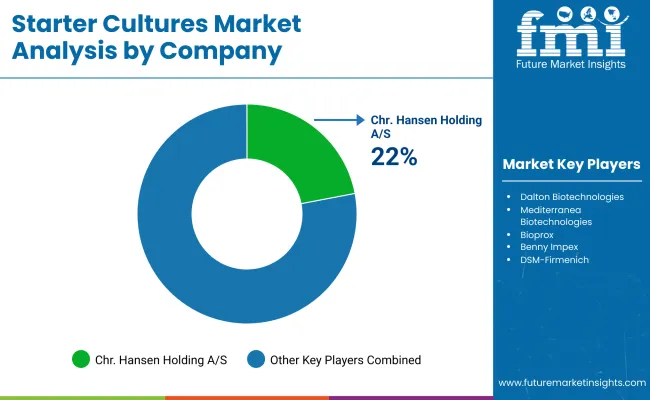
At the global level, the industry is highly competitive and dominated by multinational ingredient manufacturers and specialized biotechnology firms-leading players such as Chr. Hansen Holding A/S, DuPont (IFF), and DSM-Firmenich have also adopted market-tailored but extensive efforts in R&D, advanced fermentation technologies, and regulatory expertise to create novel solutions for dairy, meat, and plant-based applications.
As competition becomes increasingly intense, regional and emerging players, like Sacco System and Biochem Srl, benefit from such approaches in offering customized solutions for local taste or taste to artisanal producers. In addition, the industry is rapidly experiencing technological advancements in microbial strain development and fermentation processes to allow manufacturers to put on cultures tailored with improved functional benefits, texture, flavor, and probiotic properties.
The number of M&As has become the key growth strategy for companies, with large companies acquiring specialized biotechnology firms to widen their microbial portfolio and establish a strong international presence. Moreover, clean-label, non-GMO, and plant-based fermentation solutions are surfacing every other day, and all these factors contribute to innovation within the industry as organizations will need to adapt to changing consumer preferences toward more natural and health-oriented products.
Market Share Analysis by Company
| Company Name | Estimated Market Share (%) |
|---|---|
| Chr. Hansen Holding A/S | 22-26% |
| DuPont (IFF) | 18-22% |
| DSM-Firmenich | 12-16% |
| Sacco System | 10-14% |
| Biochem Srl | 6-10% |
| Other Companies (Combined) | 20-30% |
| Company Name | Key Offerings & Activities |
|---|---|
| Chr. Hansen Holding A/S | A global leader in dairy, meat, and plant-based cultures, focusing on probiotic and bio-protection strains. |
| DuPont (IFF) | Provides high-performance bacterial and fungal cultures optimized for flavor, texture, and shelf-life enhancement. |
| DSM-Firmenich | Specializes in enzyme and fermentation-based cultures, with a focus on clean-label and functional ingredient solutions. |
| Sacco System | Offers customized microbial solutions for artisanal cheese, fermented meats, and plant-based dairy products. |
| Biochem Srl | Develops natural fermentation cultures for improved digestibility and enhanced probiotic benefits. |
Key Company Insights
Chr. Hansen Holding A/S (22-26%)
Chr. Hansen dominates the industry, offering a diverse range of probiotic, dairy, and meat fermentation solutions. The company continuously invests in next-generation microbial strains, such as its Hansen Sweet culture, for sugar reduction in dairy applications.
DuPont (IFF) (18-22%)
DuPont (IFF) is a major innovator in fermentation cultures, focusing on dairy, bakery, and meat applications. Its YO-MIX PRIME culture line enables lower sugar and cleaner-label yogurt formulations, aligning with growing consumer demand for healthier dairy alternatives.
DSM-Firmenich (12-16%)
DSM-Firmenich specializes in enzyme-enhanced cultures, which improve taste and texture while ensuring nutritional benefits. The company has developed Delvo Guard cultures, which are designed to extend the shelf life of dairy products naturally.
Sacco System (10-14%)
Sacco System caters to artisanal and industrial producers with highly specialized bacterial cultures. Its Lyofast cultures are widely used in traditional cheese fermentation and clean-label meat curing solutions.
Biochem Srl (6-10%)
Biochem Srl focuses on natural fermentation and bio-protection cultures, particularly for gut health and immune-boosting dairy formulations. The company’s research into microbial diversity in plant-based fermentation is driving new product innovations.
Other Key Players (20-30% Combined)
The segmentation is into Bacteria, Yeast, Mold, and Others.
The segmentation is into Lactic and Non-Lactic Starter Cultures.
The segmentation is into Dried, Liquid, and Frozen Starter Cultures.
The segmentation is into Mesophilic and Thermophilic Starter Cultures.
The segmentation is into Dairy and dairy-based Products, Meat and seafood, Bakery, Alcoholic Beverages, Non-Alcoholic Beverages, Organic Fertilizers, and Others.
The segmentation is into Single Strain, Multi-Strain, Multi-Strain-Mix, and Other starter cultures.
Regionally, the segmentation is into North America, Latin America, Western Europe, Eastern Europe, South Asia & Pacific, East Asia, Central Asia, Balkan and Baltic Countries, Russia & Belarus, and the Middle East and Africa.
The industry is expected to reach USD 1.3 billion in 2025.
The market is projected to grow to USD 2.5 billion by 2035.
The market is expected to grow at a CAGR of approximately 6.3% from 2025 to 2035.
China is expected to experience the highest growth, with a CAGR of 9.8% during the forecast period.
The Bacteria segment is one of the most widely used categories in the market.
Leading companies include Chr. Hansen Holding A/S, DuPont (IFF), DSM-Firmenich, Sacco System, Biochem Srl, Codex-ing Biotech Ingredients, Dalton Biotechnologies, Mediterranea Biotechnologies, Bioprox, and Benny Impex.


Full Research Suite comprises of:
Market outlook & trends analysis
Interviews & case studies
Strategic recommendations
Vendor profiles & capabilities analysis
5-year forecasts
8 regions and 60+ country-level data splits
Market segment data splits
12 months of continuous data updates
DELIVERED AS:
PDF EXCEL ONLINE
Meat Starter Cultures Market Size and Share Forecast Outlook 2025 to 2035
Starter Fertilizers Market Size and Share Forecast Outlook 2025 to 2035
Starter Feed Market Analysis by Type, Ingredient, Livestock, Form, and Region Through 2035
Engine Starter Fluid Market Growth - Demand, Trends & Forecast 2025 to 2035
Vehicle Starter Motor Market
Organic Starter-Grower Chicken Feed Market
Automotive Starter And Alternator Market Size and Share Forecast Outlook 2025 to 2035
Automotive Starter Motor Market Size and Share Forecast Outlook 2025 to 2035
Motor Soft Starters Market Trend Analysis Based on Voltage, End-Use, and Region 2025 to 2035
Vehicle Jump Starter Market Size and Share Forecast Outlook 2025 to 2035
Enclosed Motor Starter Market Growth – Trends & Forecast 2024-2034
Two Wheeler Electric Starter Magnet Market
Automotive Integrated Starter Generator Units Market Size and Share Forecast Outlook 2025 to 2035
Residential Automatic Motor Starter Market Size and Share Forecast Outlook 2025 to 2035
Cultures Market Analysis - Size, Share, & Forecast Outlook 2025 to 2035
Ripening Cultures Market Analysis by Type, Form, Application, Distribution Channel, and Region Forecast Through 2035
Specialty Cultures Market Analysis - Size, Share and Forecast Outlook 2025 to 2035
Food and Beverage Protective Cultures Market Size and Share Forecast Outlook 2025 to 2035

Thank you!
You will receive an email from our Business Development Manager. Please be sure to check your SPAM/JUNK folder too.
Chat With
MaRIA