Specialty Cultures Market Size and Share Forecast Outlook 2025 to 2035

The specialty cultures market is estimated to be valued at USD 1 billion in 2025. It is projected to reach USD 1.6 billion by 2035, registering a compound annual growth rate (CAGR) of 5.0% over the forecast period. The specialty cultures market is projected to add an absolute dollar opportunity of USD 0.60 billion over the forecast period. This reflects a 1.60 times growth at a compound annual growth rate of 5.0%. The market’s expansion is expected to be driven by increasing demand for functional and fermented foods, rising consumer awareness regarding probiotics, and advancements in fermentation technologies.

By 2030, the market is projected to reach approximately USD 1.28 billion, representing an incremental growth of USD 0.28 billion from USD 1 billion in 2025. From 2030 to 2035, the market is expected to further expand to USD 1.6 billion, adding another USD 0.32 billion in incremental value during the second half of the decade, indicating a steady and balanced growth trajectory.

Companies such as DuPont Nutrition & Health and Chr. Hansen are strengthening their market positions through strategic investments in R&D and expansion of their product portfolios. Collaborative partnerships and innovation in strain development are facilitating new applications in the dairy, bakery, and pharmaceutical sectors. Regulatory compliance and sustainable manufacturing processes remain pivotal to the specialty cultures market’s competitive landscape.
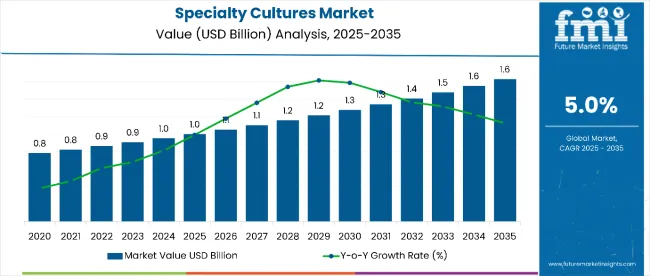
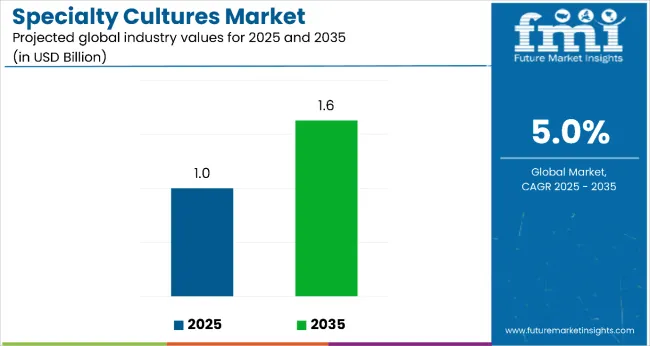
Specialty Cultures Market Value Analysis

Quick Stats for Specialty Cultures Market

  • Specialty Cultures Market Value (2025): USD 1 billion
  • Specialty Cultures Market Forecast Value (2035): USD 1.6 billion
  • Specialty Cultures Market Forecast CAGR: 5.0%
  • Leading Segment in Specialty Cultures Market in 2025: Mesophilic culture (55% market share)
  • Key Growth Regions in Specialty Cultures Market: North America, Europe, Asia-Pacific
  • Top Key Players in Specialty Cultures Market: Cargill, ADM, Kerry Group, DuPont, DSM, Tate & Lyle, Givaudan, Ingredion, Biocatalysts, Chr. Hansen, Amano Enzymes, Omega Protein, Amco Protein, Enzyme Supplies, Crespel & Deiters, Axiom Foods, Nutriati, FDL Ltd., Aminola

Specialty Cultures Market

Metric Value
Estimated Size (2025E) USD 1 billion
Projected Value (2035F) USD 1.6 billion
CAGR (2025 to 2035) 5.0%

The specialty cultures market holds a significant yet niche share within several larger parent markets. It accounts for approximately 12% of the global fermented foods and beverages sector, driven by its critical role in fermentation and probiotic enhancement. In the dairy products market, specialty cultures represent around 10%, enabling diverse applications in cheese, yogurt, and other fermented dairy items. Within the functional foods and dietary supplements markets, they hold an estimated 8% share, fueled by growing consumer interest in gut health and natural ingredients. The pharmaceutical and animal nutrition sectors see a smaller yet growing adoption, reflecting specialty cultures’ expanding versatility across industries.

Recent developments in the specialty cultures market are characterized by a growing demand for clean-label and natural ingredients, reflecting consumers’ increasing preference for healthier and more transparent diets. Innovations such as strain-specific probiotics and combined culture formulations are being introduced to enhance efficacy and broaden application potential. Customized fermentation solutions are also becoming more prevalent, allowing manufacturers to tailor products to specific needs. Additionally, evolving regulatory frameworks emphasizing product safety, sustainability, and quality control are influencing market trends. These factors collectively drive innovation and adoption, positioning the specialty cultures market for sustained growth across food, beverage, and pharmaceutical sectors.

Why is the Specialty Cultures Market Growing?

The specialty cultures market is expanding due to increasing consumer demand for functional and fermented foods that promote gut health and overall wellness. The ability of specialty cultures to improve flavor, texture, and shelf life in dairy and bakery products has driven their widespread adoption among food manufacturers.

Rising awareness of probiotics and their health benefits, coupled with innovations in strain development and fermentation technology, are further accelerating market growth. Additionally, stringent regulations and growing interest in clean-label, natural ingredients are encouraging manufacturers to incorporate specialty cultures in a variety of food, beverage, and pharmaceutical applications.

With evolving consumer preferences favoring health-enhancing ingredients and sustainable production methods, the specialty cultures market is expected to maintain strong growth momentum. These factors collectively position the market for significant expansion across multiple end-use sectors globally.

Segmental Analysis

The market is segmented by type, application, distribution channel, and region. By type, the market is bifurcated into mesophilic culture and thermophilic culture. By application, the market is divided into dairy industry, cheese, yogurt, and the meat industry. Based on distribution channel, the market is classified into supermarkets/hypermarkets, store-based retail, specialty stores, and online retail. Regionally, the market spans over North America, Europe, Asia-Pacific, Latin America, Japan, the Middle East & Africa.
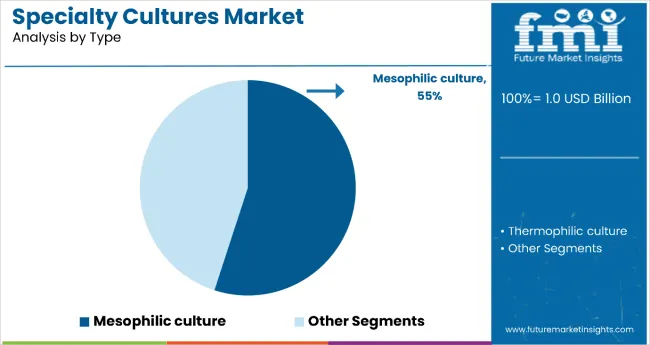
By Type, Mesophilic Culture Segment Accounts for 55.0% of the Market Share

Specialty Cultures Market By Type

The mesophilic culture segment holds a leading position with 55.0% market share within the type category, primarily due to its extensive use in fermented dairy products such as cheese, buttermilk, and sour cream. These cultures thrive at moderate temperatures, delivering distinct flavor and texture profiles, making them indispensable in traditional and artisanal cheese production worldwide. The preference for natural fermentation and clean-label dairy products continues to drive demand for mesophilic cultures.

Increased investment in strain innovation has enhanced the functional attributes of mesophilic cultures, including improved acidification rates and probiotic potential. Regulatory support for microbial safety and product standardization also favors growth. The segment is expected to witness further expansion as demand for premium fermented dairy products escalates globally.
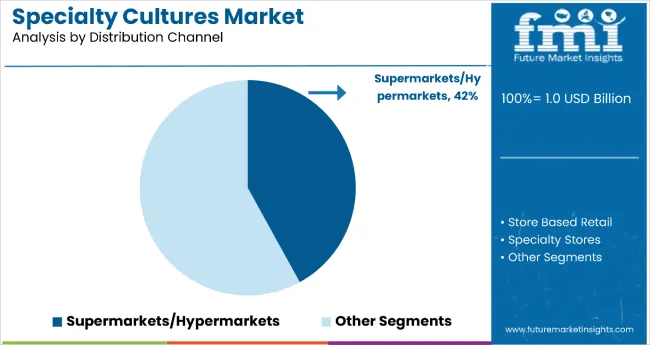
By Distribution Channel, Supermarkets/Hypermarkets Segment Accounts for 42.0% of the Market Share

Specialty Cultures Market By Distribution Channel

Supermarkets and hypermarkets represent the dominant distribution channel segment, accounting for 42.0% of the specialty cultures market share. This channel benefits from a broad consumer reach, increasing product availability, and strategic placement of fermented and functional food products that incorporate specialty cultures. Consumer preference for convenience and one-stop shopping has bolstered sales through these retail formats.

Additionally, supermarkets and hypermarkets have enhanced cold chain logistics and product diversification, enabling them to stock a wider variety of dairy, bakery, and probiotic-enriched products. Marketing campaigns promoting health benefits in these outlets have increased consumer adoption. This distribution channel is poised to maintain its market leadership as retail modernization and urbanization accelerate.

What are the Drivers, Restraints, and Key Trends of the Specialty Cultures Market?

In 2024, the global specialty cultures market experienced significant growth, driven largely by the expanding demand for fermented and functional food products. Increasing consumer awareness regarding gut health and probiotics has elevated the use of specialty cultures in dairy, bakery, and dietary supplements. Technological advancements in microbial strain development have enhanced culture efficacy, flavor profiles, and shelf life, encouraging adoption across food and pharmaceutical sectors. North America and Europe are leading regions, with Asia-Pacific rapidly growing due to rising disposable incomes and changing dietary habits.

Health and Wellness Trends Accelerate Specialty Cultures Adoption

Consumers’ preference for natural, clean-label ingredients and functional foods continues to drive specialty cultures market expansion. The ability of specialty cultures to improve digestive health and provide probiotic benefits has increased their incorporation in yogurts, cheeses, fermented beverages, and dietary supplements. Manufacturers are investing in tailored culture blends and strain-specific probiotics to target various health concerns, including immunity and metabolic health. These innovations are bolstering product differentiation and premiumization. Regulatory support for safe microbial use and sustainable production methods further strengthens market confidence and growth prospects.

Challenges in Processing and Raw Material Costs Limit Growth

Despite promising demand, the specialty cultures market faces constraints such as high production costs, stringent regulatory requirements, and complex manufacturing processes. Maintaining culture viability during processing and storage requires advanced fermentation control and cold chain logistics, raising operational expenses by up to 18%. Additionally, raw material variability and supply chain disruptions have led to price volatility, impacting product affordability. Small and medium manufacturers often struggle to meet compliance standards, limiting scale and innovation. These factors collectively restrain market penetration, particularly in price-sensitive regions, despite strong consumer interest and health-driven demand.
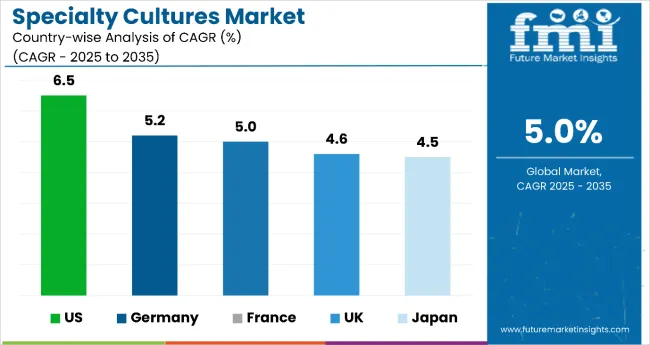
Specialty Cultures Market Analysis by Top Countries

Country Wise Analysis Of Specialty Cultures Market

Country CAGR (2025 to 2035)
USA 6.5%
Germany 5.2%
France 5.0%
UK 4.6%
Japan 4.5%

The specialty cultures market exhibits varied growth dynamics across key countries, with the USA leading in expansion, followed by Germany, France, the UK, and Japan. The USA shows the highest CAGR of 6.5%, driven by strong consumer demand for probiotics and functional foods. Germany and France follow closely with 5.2% and 5.0%, respectively, supported by advanced fermentation technologies and artisanal food trends. The UK experiences moderate growth at 4.6%, influenced by retail innovations and clean-label preferences, while Japan’s CAGR of 4.5% reflects steady demand in precision nutrition and aging population needs.

The report covers an in-depth analysis of 40+ countries; five top-performing OECD countries are highlighted below.

Specialty Cultures Market Growth in the United States

The specialty cultures market in the USA is projected to grow at a CAGR of 6.5% from 2025 to 2035, fueled by rising consumer awareness about gut health and increased demand for probiotic-enriched dairy and beverage products. Leading manufacturers are investing in strain development and fermentation innovations to enhance flavor and health benefits. The expanding functional food and dietary supplements sectors are also driving growth. Regulatory frameworks supporting product safety and quality reinforce market confidence.

  • High adoption in dairy and fermented beverages sectors
  • Investment in R&D for probiotic strain optimization
  • Strong retail distribution through supermarkets and health stores

Specialty Cultures Market Growth Driven by Innovation in Germany

Sales of specialty cultures in Germany are slated to flourish at a CAGR of 5.2% during the forecast period. Growth is supported by advanced fermentation technologies and clean-label product development focused on functional dairy and bakery applications. German manufacturers benefit from strong food safety regulations and partnerships between research institutions and industry players. Increasing consumer demand for natural and artisanal fermented foods contributes to market expansion.

  • Emphasis on sustainable and organic fermentation processes
  • Collaborative innovation with European biotech firms
  • Growing niche for probiotic bakery and dairy products

Artisanal Expertise and Premium Products Fuel Specialty Cultures Market in France

Revenue from specialty cultures in France is forecasted to expand at a CAGR of 5.0% through 2035, driven by artisanal cheese and yogurt production and premium fermented food trends. Manufacturers are leveraging traditional fermentation expertise alongside modern microbial strain advancements. Regulatory compliance and the focus on high-quality, clean-label products underpin growth.

  • Strong presence of artisanal and gourmet fermented products
  • Investment in strain-specific culture development
  • Growing export potential of premium specialty culture-based foods

Future Growth Assessment of Specialty Cultures Market in the United Kingdom

The specialty cultures market in the UK is poised to grow at a CAGR of 4.6%, underpinned by demand for functional foods and dietary supplements. Retail expansion through supermarkets and online channels supports distribution. However, supply chain complexities and Brexit-related trade adjustments have introduced some challenges. Clean-label trends and health-driven consumer choices remain key growth drivers.

  • Rising consumer preference for probiotic-enriched functional foods
  • Expansion of supermarket and hypermarket distribution
  • Emerging product innovation in health supplements

Precision Nutrition and Aging Population Propel Specialty Cultures Market in Japan

The demand for specialty cultures in Japan is expected to increase at a CAGR of 4.5% by 2035, fueled by the aging population’s nutritional needs and growing preference for precision nutrition. Fermented dairy and beverage applications dominate, with companies focusing on low-lactose and easily digestible culture formulations. Regulatory frameworks promoting food safety and product quality contribute to stable growth.
  • Focus on dairy and fermented beverage applications
  • Demand driven by aging demographics and health awareness
  • Emphasis on clean-label and digestive health products

Competitive Landscape of Specialty Cultures Market

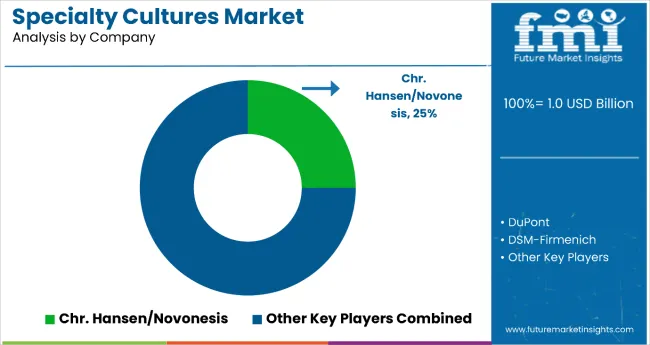
Specialty Cultures Market By Company

The specialty cultures market is moderately consolidated, comprising global biotech firms, specialized microbial ingredient producers, and regional fermentation companies with varying capabilities in strain development, fermentation technology, and application expertise. Chr. Hansen Holding A/S and DuPont Nutrition & Health are dominant players, leading with extensive portfolios of dairy and probiotic cultures used in fermented foods, beverages, and dietary supplements. Their competitive advantage lies in advanced microbial strain innovation, global manufacturing infrastructure, and strong partnerships with leading food and pharmaceutical companies.

Companies such as Kerry Group plc and Lallemand Inc. differentiate themselves by offering custom culture blends, proprietary strain technologies, and tailored solutions for bakery, dairy, and animal nutrition sectors. Novozymes A/S focuses heavily on sustainable fermentation processes and enzyme integration to optimize culture performance and reduce environmental impact. Regional players emphasize local strain adaptation and artisanal fermentation processes to cater to niche markets and traditional food applications.

Barriers to entry remain high due to the complexity of microbial strain development, stringent regulatory compliance, and the necessity for robust quality control in culture production. The competitive edge increasingly depends on innovation in strain specificity, product stability, and the ability to customize cultures for multifunctional applications across diverse food, beverage, and pharmaceutical manufacturing environments. Strategic collaborations between culture producers, research institutes, and end-use manufacturers continue to drive market leadership and expansion.

Scope of Report

Item Value
Quantitative Units USD 1 billion
Type Mesophilic culture, Thermophilic culture
Application Dairy industry, Cheese, Yogurt, Meat industry
Distribution Channel Store Based Retail, Specialty Stores, Online Retail, Supermarkets/Hypermarkets
Regions Covered North America, Europe, Asia-Pacific, Latin America, Japan, Middle East & Africa
Countries Covered United States, Canada, United Kingdom, Germany, France, China, Japan, South Korea, Brazil, Australia and 40+ countries
Key Companies Profiled Cargill, ADM, Kerry Group, DuPont, DSM, Tate & Lyle, Givaudan, Ingredion, Biocatalysts, Chr. Hansen, Amano Enzymes, Omega Protein, Amco Protein, Enzyme Supplies, Crespel & Deiters, Axiom Foods, Nutriati, FDL Ltd., Aminola
Additional Attributes Dollar sales by application and purity grade, regional demand trends, competitive landscape, consumer preferences for natural versus synthetic alternatives, integration with environmentally responsible sourcing practices, innovations in extraction technology and quality standardization for diverse industrial applications

Key Segmentation

By Type:

  • Mesophilic culture
  • Thermophilic culture

BY Application:

  • Dairy industry
  • Cheese
  • Yogurt
  • Meat industry

By Distribution channel:

  • Store Based Retail
  • Specialty Stores
  • Online Retail
  • Supermarkets
  • Hypermarkets

By region:

  • north America
  • Latin America
  • Asia pacific
  • eastern Europe
  • western Europe
  • Japan

Table of Content

  1. Executive Summary
    • Global Market Outlook
    • Demand-side Trends
    • Supply-side Trends
    • Technology Roadmap Analysis
    • Analysis and Recommendations
  2. Market Overview
    • Market Coverage / Taxonomy
    • Market Definition / Scope / Limitations
  3. Market Background
    • Market Dynamics
      • Drivers
      • Restraints
      • Opportunity
      • Trends
    • Scenario Forecast
      • Demand in Optimistic Scenario
      • Demand in Likely Scenario
      • Demand in Conservative Scenario
    • Opportunity Map Analysis
    • Product Life Cycle Analysis
    • Supply Chain Analysis
      • Supply Side Participants and their Roles
        • Producers
        • Mid-Level Participants (Traders/ Agents/ Brokers)
        • Wholesalers and Distributors
      • Value Added and Value Created at Node in the Supply Chain
      • List of Raw Material Suppliers
      • List of Existing and Potential Buyer’s
    • Investment Feasibility Matrix
    • Value Chain Analysis
      • Profit Margin Analysis
      • Wholesalers and Distributors
      • Retailers
    • PESTLE and Porter’s Analysis
    • Regulatory Landscape
      • By Key Regions
      • By Key Countries
    • Regional Parent Market Outlook
    • Production and Consumption Statistics
    • Import and Export Statistics
  4. Global Market Analysis 2020 to 2024 and Forecast, 2025 to 2035
    • Historical Market Size Value (USD Billion) & Volume (Metric Tons) Analysis, 2020 to 2024
    • Current and Future Market Size Value (USD Billion) & Volume (Metric Tons) Projections, 2025 to 2035
      • Y-o-Y Growth Trend Analysis
      • Absolute $ Opportunity Analysis
  5. Global Market Pricing Analysis 2020 to 2024 and Forecast 2025 to 2035
  6. Global Market Analysis 2020 to 2024 and Forecast 2025 to 2035, By Type
    • Introduction / Key Findings
    • Historical Market Size Value (USD Billion) & Volume (Metric Tons) Analysis By Type, 2020 to 2024
    • Current and Future Market Size Value (USD Billion) & Volume (Metric Tons) Analysis and Forecast By Type, 2025 to 2035
      • Mesophilic culture
      • Thermophilic culture
    • Y-o-Y Growth Trend Analysis By Type, 2020 to 2024
    • Absolute $ Opportunity Analysis By Type, 2025 to 2035
  7. Global Market Analysis 2020 to 2024 and Forecast 2025 to 2035, By Application
    • Introduction / Key Findings
    • Historical Market Size Value (USD Billion) & Volume (Metric Tons) Analysis By Application, 2020 to 2024
    • Current and Future Market Size Value (USD Billion) & Volume (Metric Tons) Analysis and Forecast By Application, 2025 to 2035
      • Dairy industry
      • Cheese
      • Yogurt
      • Meat industry
    • Y-o-Y Growth Trend Analysis By Application, 2020 to 2024
    • Absolute $ Opportunity Analysis By Application, 2025 to 2035
  8. Global Market Analysis 2020 to 2024 and Forecast 2025 to 2035, By Distribution Channel
    • Introduction / Key Findings
    • Historical Market Size Value (USD Billion) & Volume (Metric Tons) Analysis By Distribution Channel, 2020 to 2024
    • Current and Future Market Size Value (USD Billion) & Volume (Metric Tons) Analysis and Forecast By Distribution Channel, 2025 to 2035
      • Store Based Retail
      • Specialty Stores
      • Online Retail
      • Hypermarkets & Supermarkets
    • Y-o-Y Growth Trend Analysis By Distribution Channel, 2020 to 2024
    • Absolute $ Opportunity Analysis By Distribution Channel, 2025 to 2035
  9. Global Market Analysis 2020 to 2024 and Forecast 2025 to 2035, By Region
    • Introduction
    • Historical Market Size Value (USD Billion) & Volume (Metric Tons) Analysis By Region, 2020 to 2024
    • Current Market Size Value (USD Billion) & Volume (Metric Tons) Analysis and Forecast By Region, 2025 to 2035
      • North America
      • Latin America
      • Western Europe
      • Eastern Europe
      • East Asia
      • South Asia & Pacific
      • Middle East and Africa
    • Market Attractiveness Analysis By Region
  10. North America Market Analysis 2020 to 2024 and Forecast 2025 to 2035, By Country
    • Historical Market Size Value (USD Billion) & Volume (Metric Tons) Trend Analysis By Market Taxonomy, 2020 to 2024
    • Market Size Value (USD Billion) & Volume (Metric Tons) Forecast By Market Taxonomy, 2025 to 2035
      • By Country
        • USA
        • Canada
        • Mexico
      • By Type
      • By Application
      • By Distribution Channel
    • Market Attractiveness Analysis
      • By Country
      • By Type
      • By Application
      • By Distribution Channel
    • Key Takeaways
  11. Latin America Market Analysis 2020 to 2024 and Forecast 2025 to 2035, By Country
    • Historical Market Size Value (USD Billion) & Volume (Metric Tons) Trend Analysis By Market Taxonomy, 2020 to 2024
    • Market Size Value (USD Billion) & Volume (Metric Tons) Forecast By Market Taxonomy, 2025 to 2035
      • By Country
        • Brazil
        • Argentina
        • Rest of LATAM
      • By Type
      • By Application
      • By Distribution Channel
    • Market Attractiveness Analysis
      • By Country
      • By Type
      • By Application
      • By Distribution Channel
    • Key Takeaways
  12. Western Europe Market Analysis 2020 to 2024 and Forecast 2025 to 2035, By Country
    • Historical Market Size Value (USD Billion) & Volume (Metric Tons) Trend Analysis By Market Taxonomy, 2020 to 2024
    • Market Size Value (USD Billion) & Volume (Metric Tons) Forecast By Market Taxonomy, 2025 to 2035
      • By Country
        • Germany
        • Italy
        • France
        • UK
        • Spain
        • BENELUX
        • Nordic
        • Rest of W.Europe
      • By Type
      • By Application
      • By Distribution Channel
    • Market Attractiveness Analysis
      • By Country
      • By Type
      • By Application
      • By Distribution Channel
    • Key Takeaways
  13. Eastern Europe Market Analysis 2020 to 2024 and Forecast 2025 to 2035, By Country
    • Historical Market Size Value (USD Billion) & Volume (Metric Tons) Trend Analysis By Market Taxonomy, 2020 to 2024
    • Market Size Value (USD Billion) & Volume (Metric Tons) Forecast By Market Taxonomy, 2025 to 2035
      • By Country
        • Russia
        • Hungary
        • Poland
        • Balkan & Baltics
        • Rest of E. Europe
      • By Type
      • By Application
      • By Distribution Channel
    • Market Attractiveness Analysis
      • By Country
      • By Type
      • By Application
      • By Distribution Channel
    • Key Takeaways
  14. East Asia Market Analysis 2020 to 2024 and Forecast 2025 to 2035, By Country
    • Historical Market Size Value (USD Billion) & Volume (Metric Tons) Trend Analysis By Market Taxonomy, 2020 to 2024
    • Market Size Value (USD Billion) & Volume (Metric Tons) Forecast By Market Taxonomy, 2025 to 2035
      • By Country
        • China
        • Japan
        • South Korea
      • By Type
      • By Application
      • By Distribution Channel
    • Market Attractiveness Analysis
      • By Country
      • By Type
      • By Application
      • By Distribution Channel
    • Key Takeaways
  15. South Asia & Pacific Market Analysis 2020 to 2024 and Forecast 2025 to 2035, By Country
    • Historical Market Size Value (USD Billion) & Volume (Metric Tons) Trend Analysis By Market Taxonomy, 2020 to 2024
    • Market Size Value (USD Billion) & Volume (Metric Tons) Forecast By Market Taxonomy, 2025 to 2035
      • By Country
        • India
        • Australia & New Zealand
        • ASEAN
        • Rest of SAP
      • By Type
      • By Application
      • By Distribution Channel
    • Market Attractiveness Analysis
      • By Country
      • By Type
      • By Application
      • By Distribution Channel
    • Key Takeaways
  16. Middle East and Africa Market Analysis 2020 to 2024 and Forecast 2025 to 2035, By Country
    • Historical Market Size Value (USD Billion) & Volume (Metric Tons) Trend Analysis By Market Taxonomy, 2020 to 2024
    • Market Size Value (USD Billion) & Volume (Metric Tons) Forecast By Market Taxonomy, 2025 to 2035
      • By Country
        • GCC Countries
        • Northern Africa
        • South Africa
        • Turkiye
        • Rest of MEA
      • By Type
      • By Application
      • By Distribution Channel
    • Market Attractiveness Analysis
      • By Country
      • By Type
      • By Application
      • By Distribution Channel
    • Key Takeaways
  17. Key Countries Market Analysis
    • USA
      • Pricing Analysis
      • Market Share Analysis, 2024
        • By Type
        • By Application
        • By Distribution Channel
    • Canada
      • Pricing Analysis
      • Market Share Analysis, 2024
        • By Type
        • By Application
        • By Distribution Channel
    • Brazil
      • Pricing Analysis
      • Market Share Analysis, 2024
        • By Type
        • By Application
        • By Distribution Channel
    • Mexico
      • Pricing Analysis
      • Market Share Analysis, 2024
        • By Type
        • By Application
        • By Distribution Channel
    • Argentina
      • Pricing Analysis
      • Market Share Analysis, 2024
        • By Type
        • By Application
        • By Distribution Channel
  18. Market Structure Analysis
    • Competition Dashboard
    • Competition Benchmarking
    • Market Share Analysis of Top Players
      • By Regional
      • By Type
      • By Application
      • By Distribution Channel
  19. Competition Analysis
    • Competition Deep Dive
      • Cargill
        • Overview
        • Product Portfolio
        • Profitability by Market Segments (Product/Age /Sales Channel/Region)
        • Sales Footprint
        • Strategy Overview
          • Marketing Strategy
          • Product Strategy
          • Channel Strategy
      • ADM
        • Overview
        • Product Portfolio
        • Profitability by Market Segments (Product/Age /Sales Channel/Region)
        • Sales Footprint
        • Strategy Overview
          • Marketing Strategy
          • Product Strategy
          • Channel Strategy
      • Kerry Group
        • Overview
        • Product Portfolio
        • Profitability by Market Segments (Product/Age /Sales Channel/Region)
        • Sales Footprint
        • Strategy Overview
          • Marketing Strategy
          • Product Strategy
          • Channel Strategy
      • DuPont
        • Overview
        • Product Portfolio
        • Profitability by Market Segments (Product/Age /Sales Channel/Region)
        • Sales Footprint
        • Strategy Overview
          • Marketing Strategy
          • Product Strategy
          • Channel Strategy
      • DSM
        • Overview
        • Product Portfolio
        • Profitability by Market Segments (Product/Age /Sales Channel/Region)
        • Sales Footprint
        • Strategy Overview
          • Marketing Strategy
          • Product Strategy
          • Channel Strategy
      • Tate & Lyle
        • Overview
        • Product Portfolio
        • Profitability by Market Segments (Product/Age /Sales Channel/Region)
        • Sales Footprint
        • Strategy Overview
          • Marketing Strategy
          • Product Strategy
          • Channel Strategy
      • Givaudan
        • Overview
        • Product Portfolio
        • Profitability by Market Segments (Product/Age /Sales Channel/Region)
        • Sales Footprint
        • Strategy Overview
          • Marketing Strategy
          • Product Strategy
          • Channel Strategy
      • Ingredion
        • Overview
        • Product Portfolio
        • Profitability by Market Segments (Product/Age /Sales Channel/Region)
        • Sales Footprint
        • Strategy Overview
          • Marketing Strategy
          • Product Strategy
          • Channel Strategy
      • Biocatalysts
        • Overview
        • Product Portfolio
        • Profitability by Market Segments (Product/Age /Sales Channel/Region)
        • Sales Footprint
        • Strategy Overview
          • Marketing Strategy
          • Product Strategy
          • Channel Strategy
      • Chr. Hansen
        • Overview
        • Product Portfolio
        • Profitability by Market Segments (Product/Age /Sales Channel/Region)
        • Sales Footprint
        • Strategy Overview
          • Marketing Strategy
          • Product Strategy
          • Channel Strategy
      • Amano Enzymes
        • Overview
        • Product Portfolio
        • Profitability by Market Segments (Product/Age /Sales Channel/Region)
        • Sales Footprint
        • Strategy Overview
          • Marketing Strategy
          • Product Strategy
          • Channel Strategy
      • Omega Protein
        • Overview
        • Product Portfolio
        • Profitability by Market Segments (Product/Age /Sales Channel/Region)
        • Sales Footprint
        • Strategy Overview
          • Marketing Strategy
          • Product Strategy
          • Channel Strategy
      • Amco Protein
        • Overview
        • Product Portfolio
        • Profitability by Market Segments (Product/Age /Sales Channel/Region)
        • Sales Footprint
        • Strategy Overview
          • Marketing Strategy
          • Product Strategy
          • Channel Strategy
      • Enzyme Supplies
        • Overview
        • Product Portfolio
        • Profitability by Market Segments (Product/Age /Sales Channel/Region)
        • Sales Footprint
        • Strategy Overview
          • Marketing Strategy
          • Product Strategy
          • Channel Strategy
      • Crespel & Deiters
        • Overview
        • Product Portfolio
        • Profitability by Market Segments (Product/Age /Sales Channel/Region)
        • Sales Footprint
        • Strategy Overview
          • Marketing Strategy
          • Product Strategy
          • Channel Strategy
      • Axiom Foods
        • Overview
        • Product Portfolio
        • Profitability by Market Segments (Product/Age /Sales Channel/Region)
        • Sales Footprint
        • Strategy Overview
          • Marketing Strategy
          • Product Strategy
          • Channel Strategy
      • Nutriati
        • Overview
        • Product Portfolio
        • Profitability by Market Segments (Product/Age /Sales Channel/Region)
        • Sales Footprint
        • Strategy Overview
          • Marketing Strategy
          • Product Strategy
          • Channel Strategy
      • FDL Ltd.
        • Overview
        • Product Portfolio
        • Profitability by Market Segments (Product/Age /Sales Channel/Region)
        • Sales Footprint
        • Strategy Overview
          • Marketing Strategy
          • Product Strategy
          • Channel Strategy
      • Aminola
        • Overview
        • Product Portfolio
        • Profitability by Market Segments (Product/Age /Sales Channel/Region)
        • Sales Footprint
        • Strategy Overview
          • Marketing Strategy
          • Product Strategy
          • Channel Strategy
  20. Assumptions & Acronyms Used
  21. Research Methodology

List of Tables

  • Table 1: Global Market Value (USD Billion) Forecast by Region, 2020-2035
  • Table 2: Global Market Volume (Metric Tons) Forecast by Region, 2020-2035
  • Table 3: Global Market Value (USD Billion) Forecast by Type, 2020-2035
  • Table 4: Global Market Volume (Metric Tons) Forecast by Type, 2020-2035
  • Table 5: Global Market Value (USD Billion) Forecast by Application, 2020-2035
  • Table 6: Global Market Volume (Metric Tons) Forecast by Application, 2020-2035
  • Table 7: Global Market Value (USD Billion) Forecast by Distribution Channel, 2020-2035
  • Table 8: Global Market Volume (Metric Tons) Forecast by Distribution Channel, 2020-2035
  • Table 9: North America Market Value (USD Billion) Forecast by Country, 2020-2035
  • Table 10: North America Market Volume (Metric Tons) Forecast by Country, 2020-2035
  • Table 11: North America Market Value (USD Billion) Forecast by Type, 2020-2035
  • Table 12: North America Market Volume (Metric Tons) Forecast by Type, 2020-2035
  • Table 13: North America Market Value (USD Billion) Forecast by Application, 2020-2035
  • Table 14: North America Market Volume (Metric Tons) Forecast by Application, 2020-2035
  • Table 15: North America Market Value (USD Billion) Forecast by Distribution Channel, 2020-2035
  • Table 16: North America Market Volume (Metric Tons) Forecast by Distribution Channel, 2020-2035
  • Table 17: Latin America Market Value (USD Billion) Forecast by Country, 2020-2035
  • Table 18: Latin America Market Volume (Metric Tons) Forecast by Country, 2020-2035
  • Table 19: Latin America Market Value (USD Billion) Forecast by Type, 2020-2035
  • Table 20: Latin America Market Volume (Metric Tons) Forecast by Type, 2020-2035
  • Table 21: Latin America Market Value (USD Billion) Forecast by Application, 2020-2035
  • Table 22: Latin America Market Volume (Metric Tons) Forecast by Application, 2020-2035
  • Table 23: Latin America Market Value (USD Billion) Forecast by Distribution Channel, 2020-2035
  • Table 24: Latin America Market Volume (Metric Tons) Forecast by Distribution Channel, 2020-2035
  • Table 25: Western Europe Market Value (USD Billion) Forecast by Country, 2020-2035
  • Table 26: Western Europe Market Volume (Metric Tons) Forecast by Country, 2020-2035
  • Table 27: Western Europe Market Value (USD Billion) Forecast by Type, 2020-2035
  • Table 28: Western Europe Market Volume (Metric Tons) Forecast by Type, 2020-2035
  • Table 29: Western Europe Market Value (USD Billion) Forecast by Application, 2020-2035
  • Table 30: Western Europe Market Volume (Metric Tons) Forecast by Application, 2020-2035
  • Table 31: Western Europe Market Value (USD Billion) Forecast by Distribution Channel, 2020-2035
  • Table 32: Western Europe Market Volume (Metric Tons) Forecast by Distribution Channel, 2020-2035
  • Table 33: Eastern Europe Market Value (USD Billion) Forecast by Country, 2020-2035
  • Table 34: Eastern Europe Market Volume (Metric Tons) Forecast by Country, 2020-2035
  • Table 35: Eastern Europe Market Value (USD Billion) Forecast by Type, 2020-2035
  • Table 36: Eastern Europe Market Volume (Metric Tons) Forecast by Type, 2020-2035
  • Table 37: Eastern Europe Market Value (USD Billion) Forecast by Application, 2020-2035
  • Table 38: Eastern Europe Market Volume (Metric Tons) Forecast by Application, 2020-2035
  • Table 39: Eastern Europe Market Value (USD Billion) Forecast by Distribution Channel, 2020-2035
  • Table 40: Eastern Europe Market Volume (Metric Tons) Forecast by Distribution Channel, 2020-2035
  • Table 41: East Asia Market Value (USD Billion) Forecast by Country, 2020-2035
  • Table 42: East Asia Market Volume (Metric Tons) Forecast by Country, 2020-2035
  • Table 43: East Asia Market Value (USD Billion) Forecast by Type, 2020-2035
  • Table 44: East Asia Market Volume (Metric Tons) Forecast by Type, 2020-2035
  • Table 45: East Asia Market Value (USD Billion) Forecast by Application, 2020-2035
  • Table 46: East Asia Market Volume (Metric Tons) Forecast by Application, 2020-2035
  • Table 47: East Asia Market Value (USD Billion) Forecast by Distribution Channel, 2020-2035
  • Table 48: East Asia Market Volume (Metric Tons) Forecast by Distribution Channel, 2020-2035
  • Table 49: South Asia & Pacific Market Value (USD Billion) Forecast by Country, 2020-2035
  • Table 50: South Asia & Pacific Market Volume (Metric Tons) Forecast by Country, 2020-2035
  • Table 51: South Asia & Pacific Market Value (USD Billion) Forecast by Type, 2020-2035
  • Table 52: South Asia & Pacific Market Volume (Metric Tons) Forecast by Type, 2020-2035
  • Table 53: South Asia & Pacific Market Value (USD Billion) Forecast by Application, 2020-2035
  • Table 54: South Asia & Pacific Market Volume (Metric Tons) Forecast by Application, 2020-2035
  • Table 55: South Asia & Pacific Market Value (USD Billion) Forecast by Distribution Channel, 2020-2035
  • Table 56: South Asia & Pacific Market Volume (Metric Tons) Forecast by Distribution Channel, 2020-2035
  • Table 57: Middle East and Africa Market Value (USD Billion) Forecast by Country, 2020-2035
  • Table 58: Middle East and Africa Market Volume (Metric Tons) Forecast by Country, 2020-2035
  • Table 59: Middle East and Africa Market Value (USD Billion) Forecast by Type, 2020-2035
  • Table 60: Middle East and Africa Market Volume (Metric Tons) Forecast by Type, 2020-2035
  • Table 61: Middle East and Africa Market Value (USD Billion) Forecast by Application, 2020-2035
  • Table 62: Middle East and Africa Market Volume (Metric Tons) Forecast by Application, 2020-2035
  • Table 63: Middle East and Africa Market Value (USD Billion) Forecast by Distribution Channel, 2020-2035
  • Table 64: Middle East and Africa Market Volume (Metric Tons) Forecast by Distribution Channel, 2020-2035

List of Figures

  • Figure 1: Global Market Volume (Metric Tons) Forecast 2020-2035
  • Figure 2: Global Market Pricing Analysis
  • Figure 3: Global Market Value (USD Billion) Forecast 2020-2035
  • Figure 4: Global Market Value Share and BPS Analysis by Type, 2025 and 2035
  • Figure 5: Global Market Y-o-Y Growth Comparison by Type, 2025-2035
  • Figure 6: Global Market Attractiveness Analysis by Type
  • Figure 7: Global Market Value Share and BPS Analysis by Application, 2025 and 2035
  • Figure 8: Global Market Y-o-Y Growth Comparison by Application, 2025-2035
  • Figure 9: Global Market Attractiveness Analysis by Application
  • Figure 10: Global Market Value Share and BPS Analysis by Distribution Channel, 2025 and 2035
  • Figure 11: Global Market Y-o-Y Growth Comparison by Distribution Channel, 2025-2035
  • Figure 12: Global Market Attractiveness Analysis by Distribution Channel
  • Figure 13: Global Market Value (USD Billion) Share and BPS Analysis by Region, 2025 and 2035
  • Figure 14: Global Market Y-o-Y Growth Comparison by Region, 2025-2035
  • Figure 15: Global Market Attractiveness Analysis by Region
  • Figure 16: North America Market Incremental $ Opportunity, 2025-2035
  • Figure 17: Latin America Market Incremental $ Opportunity, 2025-2035
  • Figure 18: Western Europe Market Incremental $ Opportunity, 2025-2035
  • Figure 19: Eastern Europe Market Incremental $ Opportunity, 2025-2035
  • Figure 20: East Asia Market Incremental $ Opportunity, 2025-2035
  • Figure 21: South Asia & Pacific Market Incremental $ Opportunity, 2025-2035
  • Figure 22: Middle East and Africa Market Incremental $ Opportunity, 2025-2035
  • Figure 23: North America Market Value Share and BPS Analysis by Country, 2025 and 2035
  • Figure 24: North America Market Value Share and BPS Analysis by Type, 2025 and 2035
  • Figure 25: North America Market Y-o-Y Growth Comparison by Type, 2025-2035
  • Figure 26: North America Market Attractiveness Analysis by Type
  • Figure 27: North America Market Value Share and BPS Analysis by Application, 2025 and 2035
  • Figure 28: North America Market Y-o-Y Growth Comparison by Application, 2025-2035
  • Figure 29: North America Market Attractiveness Analysis by Application
  • Figure 30: North America Market Value Share and BPS Analysis by Distribution Channel, 2025 and 2035
  • Figure 31: North America Market Y-o-Y Growth Comparison by Distribution Channel, 2025-2035
  • Figure 32: North America Market Attractiveness Analysis by Distribution Channel
  • Figure 33: Latin America Market Value Share and BPS Analysis by Country, 2025 and 2035
  • Figure 34: Latin America Market Value Share and BPS Analysis by Type, 2025 and 2035
  • Figure 35: Latin America Market Y-o-Y Growth Comparison by Type, 2025-2035
  • Figure 36: Latin America Market Attractiveness Analysis by Type
  • Figure 37: Latin America Market Value Share and BPS Analysis by Application, 2025 and 2035
  • Figure 38: Latin America Market Y-o-Y Growth Comparison by Application, 2025-2035
  • Figure 39: Latin America Market Attractiveness Analysis by Application
  • Figure 40: Latin America Market Value Share and BPS Analysis by Distribution Channel, 2025 and 2035
  • Figure 41: Latin America Market Y-o-Y Growth Comparison by Distribution Channel, 2025-2035
  • Figure 42: Latin America Market Attractiveness Analysis by Distribution Channel
  • Figure 43: Western Europe Market Value Share and BPS Analysis by Country, 2025 and 2035
  • Figure 44: Western Europe Market Value Share and BPS Analysis by Type, 2025 and 2035
  • Figure 45: Western Europe Market Y-o-Y Growth Comparison by Type, 2025-2035
  • Figure 46: Western Europe Market Attractiveness Analysis by Type
  • Figure 47: Western Europe Market Value Share and BPS Analysis by Application, 2025 and 2035
  • Figure 48: Western Europe Market Y-o-Y Growth Comparison by Application, 2025-2035
  • Figure 49: Western Europe Market Attractiveness Analysis by Application
  • Figure 50: Western Europe Market Value Share and BPS Analysis by Distribution Channel, 2025 and 2035
  • Figure 51: Western Europe Market Y-o-Y Growth Comparison by Distribution Channel, 2025-2035
  • Figure 52: Western Europe Market Attractiveness Analysis by Distribution Channel
  • Figure 53: Eastern Europe Market Value Share and BPS Analysis by Country, 2025 and 2035
  • Figure 54: Eastern Europe Market Value Share and BPS Analysis by Type, 2025 and 2035
  • Figure 55: Eastern Europe Market Y-o-Y Growth Comparison by Type, 2025-2035
  • Figure 56: Eastern Europe Market Attractiveness Analysis by Type
  • Figure 57: Eastern Europe Market Value Share and BPS Analysis by Application, 2025 and 2035
  • Figure 58: Eastern Europe Market Y-o-Y Growth Comparison by Application, 2025-2035
  • Figure 59: Eastern Europe Market Attractiveness Analysis by Application
  • Figure 60: Eastern Europe Market Value Share and BPS Analysis by Distribution Channel, 2025 and 2035
  • Figure 61: Eastern Europe Market Y-o-Y Growth Comparison by Distribution Channel, 2025-2035
  • Figure 62: Eastern Europe Market Attractiveness Analysis by Distribution Channel
  • Figure 63: East Asia Market Value Share and BPS Analysis by Country, 2025 and 2035
  • Figure 64: East Asia Market Value Share and BPS Analysis by Type, 2025 and 2035
  • Figure 65: East Asia Market Y-o-Y Growth Comparison by Type, 2025-2035
  • Figure 66: East Asia Market Attractiveness Analysis by Type
  • Figure 67: East Asia Market Value Share and BPS Analysis by Application, 2025 and 2035
  • Figure 68: East Asia Market Y-o-Y Growth Comparison by Application, 2025-2035
  • Figure 69: East Asia Market Attractiveness Analysis by Application
  • Figure 70: East Asia Market Value Share and BPS Analysis by Distribution Channel, 2025 and 2035
  • Figure 71: East Asia Market Y-o-Y Growth Comparison by Distribution Channel, 2025-2035
  • Figure 72: East Asia Market Attractiveness Analysis by Distribution Channel
  • Figure 73: South Asia & Pacific Market Value Share and BPS Analysis by Country, 2025 and 2035
  • Figure 74: South Asia & Pacific Market Value Share and BPS Analysis by Type, 2025 and 2035
  • Figure 75: South Asia & Pacific Market Y-o-Y Growth Comparison by Type, 2025-2035
  • Figure 76: South Asia & Pacific Market Attractiveness Analysis by Type
  • Figure 77: South Asia & Pacific Market Value Share and BPS Analysis by Application, 2025 and 2035
  • Figure 78: South Asia & Pacific Market Y-o-Y Growth Comparison by Application, 2025-2035
  • Figure 79: South Asia & Pacific Market Attractiveness Analysis by Application
  • Figure 80: South Asia & Pacific Market Value Share and BPS Analysis by Distribution Channel, 2025 and 2035
  • Figure 81: South Asia & Pacific Market Y-o-Y Growth Comparison by Distribution Channel, 2025-2035
  • Figure 82: South Asia & Pacific Market Attractiveness Analysis by Distribution Channel
  • Figure 83: Middle East and Africa Market Value Share and BPS Analysis by Country, 2025 and 2035
  • Figure 84: Middle East and Africa Market Value Share and BPS Analysis by Type, 2025 and 2035
  • Figure 85: Middle East and Africa Market Y-o-Y Growth Comparison by Type, 2025-2035
  • Figure 86: Middle East and Africa Market Attractiveness Analysis by Type
  • Figure 87: Middle East and Africa Market Value Share and BPS Analysis by Application, 2025 and 2035
  • Figure 88: Middle East and Africa Market Y-o-Y Growth Comparison by Application, 2025-2035
  • Figure 89: Middle East and Africa Market Attractiveness Analysis by Application
  • Figure 90: Middle East and Africa Market Value Share and BPS Analysis by Distribution Channel, 2025 and 2035
  • Figure 91: Middle East and Africa Market Y-o-Y Growth Comparison by Distribution Channel, 2025-2035
  • Figure 92: Middle East and Africa Market Attractiveness Analysis by Distribution Channel
  • Figure 93: Global Market - Tier Structure Analysis
  • Figure 94: Global Market - Company Share Analysis

Frequently Asked Questions

How big is the specialty cultures market in 2025?

The global specialty cultures market is estimated to be valued at USD 1 billion in 2025.

What will be the size of the specialty cultures market in 2035?

The specialty cultures market size is projected to reach USD 1.6 billion by 2035.

How much will be the specialty cultures market growth between 2025 and 2035?

The specialty cultures market is expected to grow at a 5.0% CAGR between 2025 and 2035.

Which type segment is projected to lead in the specialty cultures market in 2025?

The mesophilic culture segment is projected to lead in the specialty cultures market with a 55% market share in 2025.

Which distribution channel is set to contribute significant share in the specialty cultures market in 2025?

The supermarkets and hypermarkets segment is expected to command a 42% share in the specialty cultures market in 2025.

Explore Similar Insights

Future Market Insights

Specialty Cultures Market

Chat With

MaRIA

Hi There, I am MaRIA, Your Market Research Intelligence Assistant. How may I help you?