The specialty medical chairs industry is projected to witness steady growth during the assessment period from 2025 to 2035. These exam, treatment, and rehabilitation chairs are used in hospitals, specialty clinics, and home healthcare. Increased geriatric population, surge of outpatient procedures, coupled with demand for ergonomic and technical advanced medical furniture’s also serves as market growth drivers.
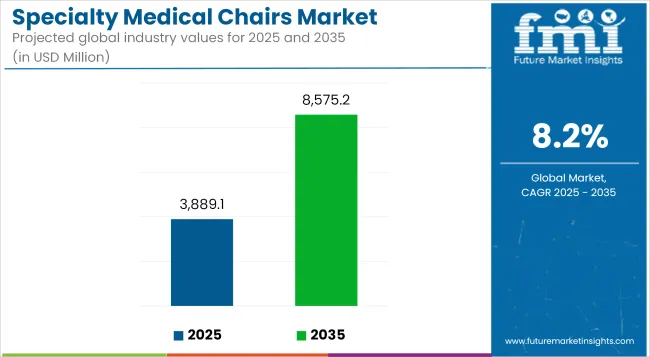
The market was valued at USD 3,889.1 Million in 2025 and grow with a CAGR of 8.2% during the forecast period amounting to the market to USD 8,575.2 Million by 2035. Technological progress in motorized chairs, growing acceptance of home healthcare solutions, and the growth of specialty healthcare centres are propelling the market growth.

Market Metrics
| Metric | Value |
|---|---|
| Market Size (2025E) | USD 3,889.1 Million |
| Market Value (2035F) | USD 8,575.2 Million |
| CAGR (2025 to 2035) | 8.2% |
The Specialty Medical Chairs Market in North America accounts for the highest market share owing to the comprehensive healthcare infrastructure, high adoption of minimally invasive procedures, and the increasing geriatric population requiring mobility assistance.
The United States and Canada are the main contributors due to hospitals, rehabilitation centres, and long-term care facilities that are increasingly investing in ergonomic and motorized medical chairs for patient comfort and safety. Also, government reimbursement policies for disability and geriatric care will increase the market.
The high-tech Specialty Medical Chairs Market is significant in Europe, with Germany, the UK, and France all adopting more advanced equipment. Demand for treatment chairs, dialysis chairs, and rehabilitation chairs is being fuelled by the growing prevalence of chronic conditions, the proliferation of specialty clinics, and the increasing spending on health care. Moreover, stringent regulatory standards for patient safety and ergonomics of medical furniture are augmenting the demand for quality specialty chairs.
The Asia-Pacific region is anticipated to have the fastest growth, driven by the increasing number of healthcare facilities, growing disposable income and rising elderly populations, particularly in China, Japan and India. Increasing demand for home healthcare solutions along with technological improvements in medical devices are the key factors propelling growth of electric and automated specialty chairs market. Subsidized healthcare plans and disability support programs offered by the governments are attracting the market penetration.
Challenge
High Cost of Motorized and Advanced Specialty Chairs
A major barrier to the widespread adoption of advanced specialty medical chairs, particularly those with motorized adjustments, smart sensors and AI-assisted positioning, is their cost. The use of high-end specialty chairs is often cost-prohibitive for small clinics, rehabilitation centres, and home healthcare users, limiting further infiltration into cost-sensitive markets. Moreover, healthcare providers face long-term expenses due to maintenance and repair (M&R) costs associated with technologically advanced chairs.
Opportunity
Growing Demand for Home Healthcare and Technologically Advanced Chairs
Manufacturers have a good opportunity along with the changing world of telemedicine and home healthcare. Demand for customized, foldable, and portable medical chairs is being driven by patients’ need for comfortable, adjustable, and easy-to-use chairs for at-home treatments and rehabilitation.
Further-platforms such as AI-based positioning, smart sensors, and remote-controlled chairs is adding a new dimension to the market. Brands that will focus on affordable, ergonomic, and patient-centric chair designs will have an upper hand in the changing scenario.
The specialty medical chairs market grew from 2020 to 2024 due to the growing number of chronic diseases, increasing need for patient comfort, and advancement in ergonomic designs. The increase in the number of procedures performed on an outpatient basis along with the rising trend of receiving healthcare services in home environment fuelled the demand for patient adjustable, multipurpose medical chairs used in dialysis, dental, ophthalmic and surgical applications.
Electrically operated chairs with improved patient positioning capabilities were adopted, allowing for minimal strain on healthcare professionals; therefore driving the growth of the market. Hospitals and clinics adhered to these chairs market as they were operated with the help of electricity. Due to the growing prevalence of obesity-related diseases, the demand for bariatric medical chairs has also increased.
Despite substantial advancement, challenges remained in the form of high upfront costs of advanced specialty chairs, limited and inconsistent reimbursement policies, as well as widespread supply chain disruptions. All the while, manufacturers worked on technological advancements, such as wireless controls, antimicrobial upholstery, and smart monitoring functions to help improve patient care.
In the period between 2025 and 2035, the specialty medical chairs market will be shifting towards automated advancements driven by AI, along with real-time patient monitoring and innovations towards more sustainable materials.
Smart chairs will use AI to optimize patient comfort while also providing a reduction in the caregiver’s workload by using pressure sensors, biometric tracking, and auto-adjusting ergonomic support. Alternative control options such as remote-control and voice-activated features will improve accessibility for those with mobility impairments.
Sustainability first will mean recyclable, eco-friendly materials and modular designs that support easy maintenance and component replacements. Hospitals will continue to invest in multi-purpose specialty chairs to save space, and improve cost-effectiveness.
As outpatient and telehealth services push forward demand for portable, home-friendly specialty chairs will increase to support chronic disease management and older age. IoT based real-time diagnostics integration will help healthcare providers monitor patient’s vitals and adapt angular positioning from a distance.
Market Shifts: A Comparative Analysis (2020 to 2024 vs. 2025 to 2035)
| Market Shift | 2020 to 2024 |
|---|---|
| Technological Advancements | Electrically operated chairs with ergonomic adjustments. |
| Healthcare Application Growth | Increased use in dialysis, dental, ophthalmic, and surgical settings. |
| Sustainability & Materials | Durable, antimicrobial-coated chairs for infection control. |
| Automation & Smart Features | Electrically operated recline and height adjustments. |
| Patient- Cantered Innovations | Enhanced comfort with pressure-relief padding and customizable positioning. |
| Market Growth Drivers | Aging population, increased outpatient services, and chronic disease management. |
| Market Shift | 2025 to 2035 |
|---|---|
| Technological Advancements | AI-integrated smart chairs with biometric monitoring and auto-adjustment. |
| Healthcare Application Growth | Expansion into home healthcare, telemedicine setups, and rehabilitation centres. |
| Sustainability & Materials | Use of recyclable, modular, and eco-friendly materials for sustainable healthcare. |
| Automation & Smart Features | Voice-controlled, remote-adjustable, and IoT -enabled medical chairs. |
| Patient- Cantered Innovations | Smart posture correction, integrated sensors, and remote patient monitoring. |
| Market Growth Drivers | AI-driven advancements, sustainability initiatives, and rising demand for home healthcare solutions. |

The United States Specialty Medical Chairs market for specialty use is rapidly growing, and is due to us with the increasing aging population, growing prevalence of chronic disease and rising adoption of technologically advanced medical equipment. Increasing patient comfort, as well as continued innovations in ergonomic chair designs, have seen much upsurge in usage in hospitals, dental clinics, and rehabilitation centres.
Furthermore, government plans encouraging the development of healthcare infrastructure, along with a rise in healthcare expenditure, are bolstering the growth of this market. Moreover, the implications of smart features like electric adjustments and automatic positioning systems are adding to the market potential.
| Country | CAGR (2025 to 2035) |
|---|---|
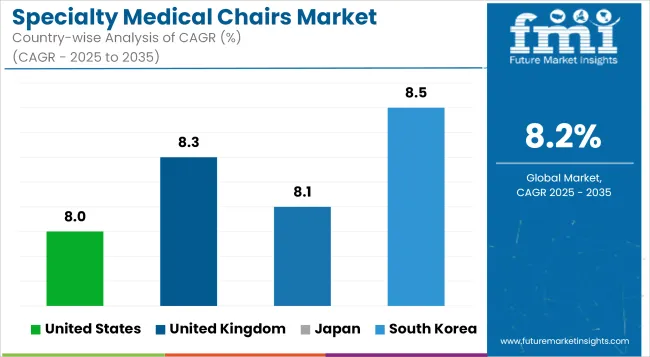
| United States | 8.0% |
The market for specialty medical chairs in the United Kingdom is expanding as a result of increasing healthcare awareness, growing investments in medical infrastructure, and a growing elderly population. As healthcare providers place greater emphasis on enhancing patient comfort and efficiency of treatment, the demand for dental, ophthalmic, and rehabilitation chairs is expected to rise.
Furthermore, increased outpatient procedures and home healthcare services are driving the demand of specialty medical chairs with mobility features. The continuing drive toward sustainable healthcare equipment with recyclable materials and energy-saving designs is also shaping the market.
| Country | CAGR (2025 to 2035) |
|---|---|
| United Kingdom | 8.3% |
Factors such as growing healthcare expenditure, geriatric population, and growing specialized medical facilities in the European Union region will drive the specialty medical chairs market. Countries like Germany, France, and Italy are experiencing higher demand for advanced technological medical chairs used specifically in dental, oncology, and rehabilitation applications.
Market growth can be attributed to the growing volume of ambulatory care services and technological advancements in automated patient positioning systems. Additionally, the emphasis on ergonomic chairs with adjustable features is making patient health and medical efficiency better across the region.
| Region | CAGR (2025 to 2035) |
|---|---|
| European Union (EU) | 8.4% |
Owing to the aging population coupled with the rising utilization of advanced healthcare solutions, the market for medical chairs in Japan is expanding. The rising prevalence of chronic disorders and the growing aging population is driving the demand for better comfort features in patient-centric chairs, which is also driving mobility and support features across medical facilities. All the new surrounding factors of the industry make market demand grow, like robotic-assisted functionalities and AI-driven diagnostics adding medication and home use.
Japan has focused on innovation in its medical technology, and continued market growth is driven by the rise of rehabilitation chairs and dental chairs and technology. Additionally, government programs that endorse elderly care facilities and home healthcare solutions will aid the growth of specialty medical chairs sales.
| Country | CAGR (2025 to 2035) |
|---|---|
| Japan | 8.1% |
In South Korea, the specialty medical chairs market is growing significantly due to the rapid advancement of healthcare technology, an increase in hospital investments, and an increase in the number of outpatient medical services. This is attributed to the rapid rise of healthcare infrastructures, especially dental and ophthalmic facilities, which in turn increases demand for highly sophisticated and highly functional medical chairs.
In addition, increasing transition to home-based medical care and rise in mobility-challenged patient populations are the key factors driving the growth of rehabilitation and bariatric chairs market. Additionally, market expansion is further driven by South Korea’s commitment to digital healthcare innovations, including smart chairs with remote monitoring features.
| Country | CAGR (2025 to 2035) |
|---|---|
| South Korea | 8.5% |

| By Type | Market Share (2025) |
|---|---|
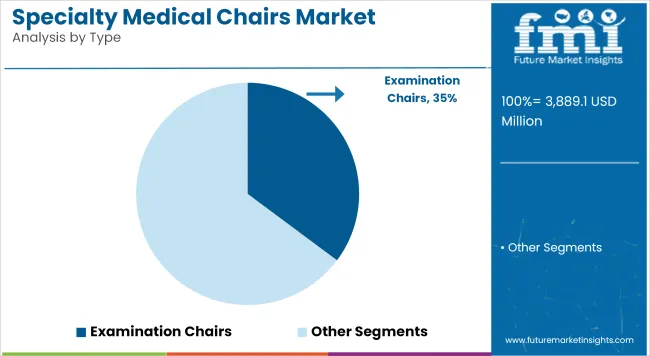
| Examination Chairs | 35.2% |
Examination chairs hold the largest share in the specialty medical chairs market owing to their indispensable need in diagnostic procedures across the hospitals, clinics, and specialty healthcare centres. The chairs improve patient comfort while allowing doctors to conduct intricate examinations in great detail. Flexibility in terms of adjustable height, reclining capabilities, and ergonomic designs have become standard to make accessibility easier for medical practitioners during their work processes, minimizing strain and streamlining the patient positioning.
New-age technologies have made examination chairs interactive, as these are now customized into combo units that feature automated height adjustments, electronic control panels, and options for memory settings to expedite diagnostic functions. Their utility is rendered universal across dermatology, gynaecology, urology, and general practice; applications where patient positioning and stability are critical to the clinical encounter and critical to the diagnostic outcome.
Structures like examination chairs are expected to be made of antimicrobial upholstery fabric, wash basin and upholstery that are easy to clean, long-lasting and with high weight bearing capacity. The growing focus on preventive healthcare, along with the trend of an aging population becoming increasingly reliant on frequent medical check-upss across the world, is also expected to drive the demand for high-performance examination chairs in healthcare facilities.
As the healthcare facilities focus more on patient's comfort, ergonomics and advanced treatment capabilities, the specialty medical chairs market tends to broaden. It actively looks for intelligent systems that update their changes, adapt to their actions, and allow them to roam freely, which improves the aspect of medical procedures and healthcare. The increasing aging population, growing outpatient services and increasing investment in dental, ophthalmic, and dialysis care facilitate market growth further.
Market Share Analysis by Company

| Company Name | Estimated Market Share (%) |
|---|---|
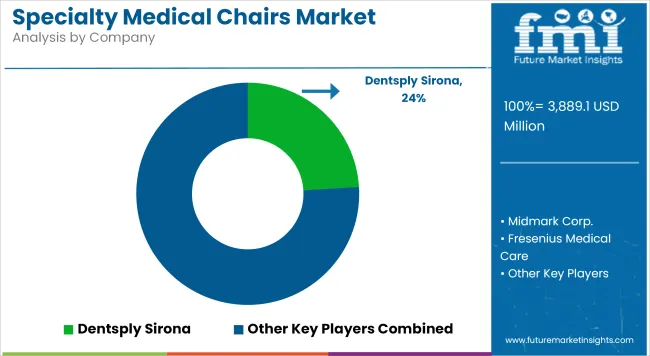
| Dentsply Sirona | 18-22% |
| Midmark Corp. | 15-19% |
| Fresenius Medical Care | 12-16% |
| Planmeca Oy | 10-14% |
| Other Companies (combined) | 30-40% |
| Company Name | Key Offerings/Activities |
|---|---|
| Dentsply Sirona | In 2024, introduced AI-powered dental chairs for improved ergonomics and precision. |
| Midmark Corp. | In 2025, launched a new line of exam chairs with enhanced infection control features. |
| Fresenius Medical Care | In 2024, developed advanced dialysis chairs with integrated monitoring systems. |
| Planmeca Oy | In 2025, expanded its range of ophthalmic chairs with motorized adjustment features. |
Key Company Insights
Dentsply Sirona (18-22%)
Dentsply Sirona leads in the dental chair segment, integrating smart technology and ergonomic designs to enhance patient comfort and precision in procedures.
Midmark Corp. (15-19%)
Midmark strengthens its market presence by focusing on infection-resistant materials and automated positioning, catering to general and specialty medical practices.
Fresenius Medical Care (12-16%)
Fresenius dominates the dialysis chair market, offering integrated patient monitoring and enhanced mobility features for long-term treatment.
Planmeca Oy (10-14%)
Planmeca innovates in ophthalmic chairs with advanced motorized adjustments, making procedures more efficient and accessible for healthcare providers.
Other Key Players (30-40% Combined)
Several companies contribute to the market by offering specialized chairs for dental, dialysis, and surgical applications:
The overall market size for the Specialty Medical Chairs Market was USD 3,889.1 Million in 2025.
The Specialty Medical Chairs Market is expected to reach USD 8,575.2 Million in 2035.
The demand is driven by increasing geriatric population, rising prevalence of chronic diseases requiring long-term care, technological advancements in specialty chairs, growing demand for mobility assistance devices, and expanding healthcare infrastructure worldwide.
The top 5 countries driving market growth are the USA, UK, Europe, Japan and South Korea.
The Examination Chairs segment is expected to command a significant share over the assessment period.
Table 1: Global Market Value (US$ Million) Forecast by Region, 2018 to 2033
Table 2: Global Market Value (US$ Million) Forecast by Type, 2018 to 2033
Table 3: North America Market Value (US$ Million) Forecast by Country, 2018 to 2033
Table 4: North America Market Value (US$ Million) Forecast by Type, 2018 to 2033
Table 5: Latin America Market Value (US$ Million) Forecast by Country, 2018 to 2033
Table 6: Latin America Market Value (US$ Million) Forecast by Type, 2018 to 2033
Table 7: Europe Market Value (US$ Million) Forecast by Country, 2018 to 2033
Table 8: Europe Market Value (US$ Million) Forecast by Type, 2018 to 2033
Table 9: Asia Pacific Market Value (US$ Million) Forecast by Country, 2018 to 2033
Table 10: Asia Pacific Market Value (US$ Million) Forecast by Type, 2018 to 2033
Table 11: Middle East and Africa Market Value (US$ Million) Forecast by Country, 2018 to 2033
Table 12: Middle East and Africa Market Value (US$ Million) Forecast by Type, 2018 to 2033
Figure 1: Global Market Value (US$ Million) by Type, 2023 to 2033
Figure 2: Global Market Value (US$ Million) by Region, 2023 to 2033
Figure 3: Global Market Value (US$ Million) Analysis by Region, 2018 to 2033
Figure 4: Global Market Value Share (%) and BPS Analysis by Region, 2023 to 2033
Figure 5: Global Market Y-o-Y Growth (%) Projections by Region, 2023 to 2033
Figure 6: Global Market Value (US$ Million) Analysis by Type, 2018 to 2033
Figure 7: Global Market Value Share (%) and BPS Analysis by Type, 2023 to 2033
Figure 8: Global Market Y-o-Y Growth (%) Projections by Type, 2023 to 2033
Figure 9: Global Market Attractiveness by Type, 2023 to 2033
Figure 10: Global Market Attractiveness by Region, 2023 to 2033
Figure 11: North America Market Value (US$ Million) by Type, 2023 to 2033
Figure 12: North America Market Value (US$ Million) by Country, 2023 to 2033
Figure 13: North America Market Value (US$ Million) Analysis by Country, 2018 to 2033
Figure 14: North America Market Value Share (%) and BPS Analysis by Country, 2023 to 2033
Figure 15: North America Market Y-o-Y Growth (%) Projections by Country, 2023 to 2033
Figure 16: North America Market Value (US$ Million) Analysis by Type, 2018 to 2033
Figure 17: North America Market Value Share (%) and BPS Analysis by Type, 2023 to 2033
Figure 18: North America Market Y-o-Y Growth (%) Projections by Type, 2023 to 2033
Figure 19: North America Market Attractiveness by Type, 2023 to 2033
Figure 20: North America Market Attractiveness by Country, 2023 to 2033
Figure 21: Latin America Market Value (US$ Million) by Type, 2023 to 2033
Figure 22: Latin America Market Value (US$ Million) by Country, 2023 to 2033
Figure 23: Latin America Market Value (US$ Million) Analysis by Country, 2018 to 2033
Figure 24: Latin America Market Value Share (%) and BPS Analysis by Country, 2023 to 2033
Figure 25: Latin America Market Y-o-Y Growth (%) Projections by Country, 2023 to 2033
Figure 26: Latin America Market Value (US$ Million) Analysis by Type, 2018 to 2033
Figure 27: Latin America Market Value Share (%) and BPS Analysis by Type, 2023 to 2033
Figure 28: Latin America Market Y-o-Y Growth (%) Projections by Type, 2023 to 2033
Figure 29: Latin America Market Attractiveness by Type, 2023 to 2033
Figure 30: Latin America Market Attractiveness by Country, 2023 to 2033
Figure 31: Europe Market Value (US$ Million) by Type, 2023 to 2033
Figure 32: Europe Market Value (US$ Million) by Country, 2023 to 2033
Figure 33: Europe Market Value (US$ Million) Analysis by Country, 2018 to 2033
Figure 34: Europe Market Value Share (%) and BPS Analysis by Country, 2023 to 2033
Figure 35: Europe Market Y-o-Y Growth (%) Projections by Country, 2023 to 2033
Figure 36: Europe Market Value (US$ Million) Analysis by Type, 2018 to 2033
Figure 37: Europe Market Value Share (%) and BPS Analysis by Type, 2023 to 2033
Figure 38: Europe Market Y-o-Y Growth (%) Projections by Type, 2023 to 2033
Figure 39: Europe Market Attractiveness by Type, 2023 to 2033
Figure 40: Europe Market Attractiveness by Country, 2023 to 2033
Figure 41: Asia Pacific Market Value (US$ Million) by Type, 2023 to 2033
Figure 42: Asia Pacific Market Value (US$ Million) by Country, 2023 to 2033
Figure 43: Asia Pacific Market Value (US$ Million) Analysis by Country, 2018 to 2033
Figure 44: Asia Pacific Market Value Share (%) and BPS Analysis by Country, 2023 to 2033
Figure 45: Asia Pacific Market Y-o-Y Growth (%) Projections by Country, 2023 to 2033
Figure 46: Asia Pacific Market Value (US$ Million) Analysis by Type, 2018 to 2033
Figure 47: Asia Pacific Market Value Share (%) and BPS Analysis by Type, 2023 to 2033
Figure 48: Asia Pacific Market Y-o-Y Growth (%) Projections by Type, 2023 to 2033
Figure 49: Asia Pacific Market Attractiveness by Type, 2023 to 2033
Figure 50: Asia Pacific Market Attractiveness by Country, 2023 to 2033
Figure 51: Middle East and Africa Market Value (US$ Million) by Type, 2023 to 2033
Figure 52: Middle East and Africa Market Value (US$ Million) by Country, 2023 to 2033
Figure 53: Middle East and Africa Market Value (US$ Million) Analysis by Country, 2018 to 2033
Figure 54: Middle East and Africa Market Value Share (%) and BPS Analysis by Country, 2023 to 2033
Figure 55: Middle East and Africa Market Y-o-Y Growth (%) Projections by Country, 2023 to 2033
Figure 56: Middle East and Africa Market Value (US$ Million) Analysis by Type, 2018 to 2033
Figure 57: Middle East and Africa Market Value Share (%) and BPS Analysis by Type, 2023 to 2033
Figure 58: Middle East and Africa Market Y-o-Y Growth (%) Projections by Type, 2023 to 2033
Figure 59: Middle East and Africa Market Attractiveness by Type, 2023 to 2033
Figure 60: Middle East and Africa Market Attractiveness by Country, 2023 to 2033


Full Research Suite comprises of:
Market outlook & trends analysis
Interviews & case studies
Strategic recommendations
Vendor profiles & capabilities analysis
5-year forecasts
8 regions and 60+ country-level data splits
Market segment data splits
12 months of continuous data updates
DELIVERED AS:
PDF EXCEL ONLINE
Specialty Silica Market Size and Share Forecast Outlook 2025 to 2035
Specialty Food Ingredients Market Size and Share Forecast Outlook 2025 to 2035
Specialty Polymers Market Size and Share Forecast Outlook 2025 to 2035
Specialty Commercial Deep Fryers Market Size and Share Forecast Outlook 2025 to 2035
Specialty Tapes Market Size and Share Forecast Outlook 2025 to 2035
Specialty Fertilizers Market Size and Share Forecast Outlook 2025 to 2035
Specialty Coatings Market Size and Share Forecast Outlook 2025 to 2035
Specialty Transformer Market Size and Share Forecast Outlook 2025 to 2035
Specialty Chemicals Market Size and Share Forecast Outlook 2025 to 2035
Specialty Nitriles Market Size and Share Forecast Outlook 2025 to 2035
Specialty Fuel Additives Market Size and Share Forecast Outlook 2025 to 2035
Specialty Cultures Market Analysis - Size, Share and Forecast Outlook 2025 to 2035
Specialty Shortenings Market Size and Share Forecast Outlook 2025 to 2035
Specialty Labels Packaging Market Size and Share Forecast Outlook 2025 to 2035
Specialty Commercial Vehicle Market Size and Share Forecast Outlook 2025 to 2035
Specialty Carbon Black Market Size and Share Forecast Outlook 2025 to 2035
Specialty Lighting Market Size and Share Forecast Outlook 2025 to 2035
Specialty Amino Acids Market Size and Share Forecast Outlook 2025 to 2035
Specialty Pulp & Paper Chemicals Market Size, Share & Forecast 2025 to 2035
Specialty Yeast Market Analysis - Size, Growth, and Forecast 2025 to 2035

Thank you!
You will receive an email from our Business Development Manager. Please be sure to check your SPAM/JUNK folder too.
Chat With
MaRIA