Specialty Pulp and Paper Chemicals Market Size and Share Forecast Outlook (2025 to 2035)

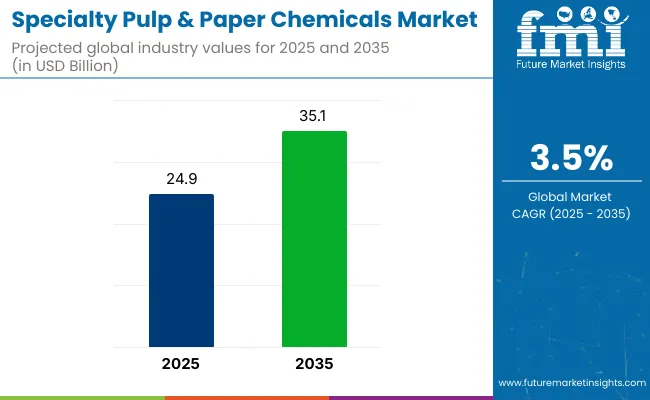
The specialty pulp & paper chemicals market is projected to grow from USD 24.9 billion in 2025 to USD 35.1 billion by 2035, registering a CAGR of 3.5% during the forecast period. Sales in 2024 reached USD 24.0 billion, Expansion is being supported by increased demand for specialty additives in high-grade paper, tissue products, and coated packaging.
Quick Stats of Specialty Pulp & Paper Chemicals Market

  • Market Value (2025): USD 24.9 billion
  • Forecast Value (2035): USD 35.1 billion
  • Forecast CAGR: 3.5%
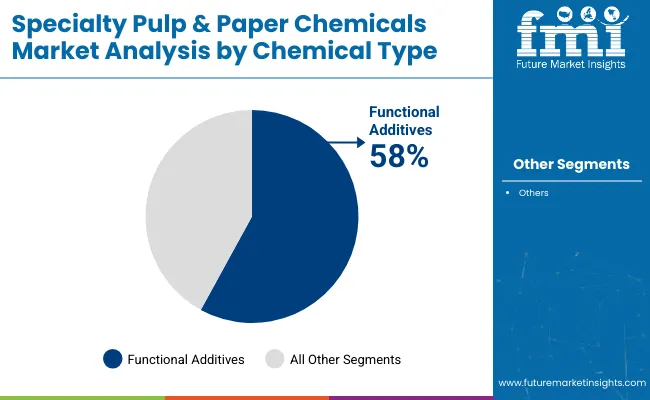
  • Chemical Type Leader in 2025: Functional Additives (58.0% market share)
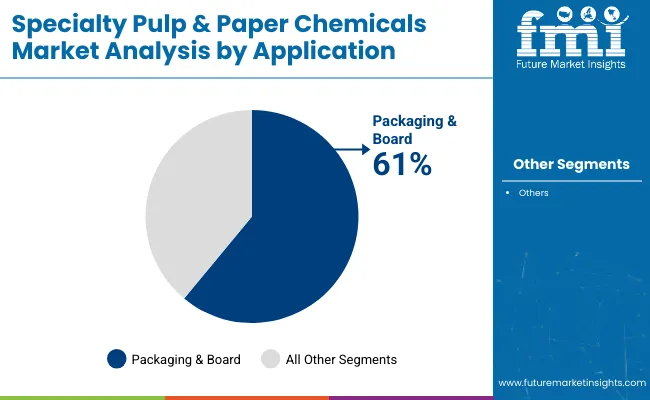
  • Top Application: Packaging & Board (61.0% share)
  • Key Growth Country: Asia-Pacific (Japan is the fastest-growing market with 5.4% CAGR)

Specialty Pulp And Paper Chemicals Market

Metric Value
Market Size (2025E) USD 24.9 billion
Market Value (2035F) USD 35.1 billion
CAGR (2025 to 2035) 3.5%

Growing usage in India’s recycled paper processing and sustainable packaging applications is expected to bolster consumption. Stringent regulatory focus on eco-safe chemicals and end-user preference for higher-performance paper grades are aiding adoption. Global players are also focusing on mill-specific chemical customization. The rise of digital packaging formats and sustainable labeling is anticipated to elevate demand for functional, printable surface treatments across emerging paper substrates.

In March 2025, Chemical leader SNF and Japan’s Mitsubishi Chemical Corporation have partnered in a pioneering project to produce N-vinylformamide (NVF), an advanced monomer essential for polymers used in the paper industry. This collaboration combines the expertise of both companies to drive innovation and sustainability in industrial manufacturing.

“This project exemplifies strategic synergy,” said Pascal Remy, CEO of SNF Group. “By combining Mitsubishi Chemical’s monomer expertise with our leadership in water-soluble polymers, we’ve created a groundbreaking facility that supports the circular economy through recycled paper production. Together, we’re advancing sustainability and innovation.”

Major emphasis is being placed on the integration of biodegradable and bio-based chemicals in pulp processing and surface enhancement. Regulatory standards in India and APAC have pushed for reductions in AOX emissions and improved effluent treatment capabilities in the paper industry.

As a response, suppliers are accelerating the introduction of plant-derived binders, wet strength resins, and retention aids. Digital transformation in chemical dosing and performance analytics is also contributing to operational efficiency. Market traction is further supported by customer partnerships aiming for recyclability and product lifecycle optimization.

Opportunities are anticipated to grow for high-retention, low-energy chemicals, particularly in premium packaging and hygiene paper grades. Asia-Pacific and Latin America are projected to witness elevated demand due to capacity upgrades and rising use of specialty tissue and packaging paper.

Collaborative R&D initiatives, especially those combining Nano cellulose and green chemistry, are expected to strengthen global competitiveness while enhancing product differentiation across specialty paper segments. Continued R&D investment is expected to generate high-performance yet low-impact chemical solutions.

Analyzing Specialty Pulp & Paper Chemicals Market by Top Investment Segment

The market is segmented based on chemical type, function, application segment, and region. By chemical type, the segmentation includes bleaching agents, binding agents, sizing agents, coating chemicals, process chemicals, functional additives, and deinking agents, each contributing to specific paper and pulp performance enhancements.

Functional segmentation encompasses strength enhancement, printability improvement, water resistance, optical brightening, pitch & stickies control, pH adjustment, and drainage & retention aid-tailored for process optimization and quality consistency.

Applications cover printing & writing paper, packaging & board, tissue & towel, newsprint, specialty papers (security, filter, label), and recycled paper processing. Regionally, the market spans North America, Latin America, East Asia, South Asia & Pacific, Eastern Europe, Western Europe, Oceania, and Middle East & Africa.
Functional Additives Favored for Enhancing Paper Performance and Durability

Specialty Pulp And Paper Chemicals Market Analysis By Chemical Type

Functional additives are projected to account for 58.0% of the specialty pulp and paper chemicals market by 2025. These additives have been incorporated to improve paper strength, brightness, water resistance, and printability. Fillers, retention aids, and optical brightening agents have been integrated into production lines to enhance sheet characteristics.

Paper longevity and surface quality have been optimized using tailored chemical blends. Increased demand for high-performance printing and specialty-grade papers has accelerated the use of functional additives. Micro-fibrillated cellulose and nanomaterial-based additives have been adopted for lightweight yet strong paper products. Brightness enhancement has been achieved using fluorescent whitening agents across coated and uncoated substrates. Production speed and machine efficiency have been improved by using retention polymers and drainage aids.

Functional additives have also been applied to meet sustainability goals by reducing raw material inputs. Performance consistency has been ensured across recycled fiber sources through controlled additive dosing. Defoamers and enzyme blends have been used to streamline wet-end processing. Packaging manufacturers have relied on additives to achieve bulk control and improve rigidity.

Innovation has been driven by increasing demand for biodegradable and food-grade additives. Demand from packaging converters and premium paper manufacturers has sustained investment in new chemistries. Smart formulations have been tailored for digital printing compatibility and moisture barrier needs. Ongoing collaboration with chemical suppliers has facilitated customization and faster product development cycles.
Packaging & Board Segment Leads Driven by E-commerce and Food Service Demand

Specialty Pulp And Paper Chemicals Market Analysis By Application

The packaging & board segment is expected to represent 61.0% of the market for specialty pulp and paper chemicals by 2025. Increased consumption of folding cartons, corrugated boxes, and liquid packaging boards has fueled chemical use in this category. Coating chemicals, sizing agents, and strength enhancers have been applied extensively to improve barrier properties and durability.

Light weighting initiatives have been supported through fiber optimization and chemical reinforcement. Sustainability mandates and food safety regulations have driven the adoption of functional and biodegradable additives in packaging boards. Water- and oil-resistant coatings have been deployed to replace polyethylene laminates in food-grade packaging. Custom stiffness and printability profiles have been developed using precision chemical formulations. Recycled fiber usage has been enhanced with deinking agents and strength-rescuing binders.

High-performance boards for e-commerce and logistics applications have required specialized chemical blends. Print-grade and multi-ply packaging formats have been optimized for aesthetics and mechanical strength. Anti-microbial coatings and odor-control additives have been used for fresh food and meat packaging. Producers have favored integrated chemical systems for barrier control, smoothness, and moisture resistance.

Board mills and packaging converters have collaborated with chemical suppliers for inline customization. Application-specific solutions have been designed for beverage cartons, detergent boxes, and frozen food trays. Rapid digital printing growth has prompted the use of additives that enable ink adhesion and color fidelity. As packaging volumes increase globally, the segment is expected to retain its dominant share.

Challenges and Opportunities

Challenge

Environmental Regulations and High Production Costs

Stringent environment regulations highlighting the need of lowering chemical waste and emissions are anticipated to hinder the specialty pulp and paper chemicals market growth. The need for investment into research and development to switch to sustainable and bio-based chemicals and the resultant lack of economies of scale can also lead to higher production costs. Market stability can also be impacted by fluctuations in raw material prices.

Opportunity

Growth in Sustainable and Bio-Based Chemicals

A big trend in the specialty pulp and paper chemicals market is the drive toward green ways and eco-friendly methods.Bio-based and enzymatic chemical innovations can achieve high-performance standards while also decreasing environmental impact for manufacturers. The ones that invest in green chemistry solutions and circular economy initiatives are poised to capture competitive advantage in this changing market landscape.
Country-wise Insights

Specialty Pulp And Paper Chemicals Market Country Wise Analysis

United States

The specialty pulp and paper chemicals market in the USA is growing. This is because more people want green paper goods. Strict rules and new ways to make these chemicals help too. The EPA and FDA make sure these chemicals are safe and green.

Trends show that we are using more enzymes for green paper. Coating chemicals help print better and last longer. There is also more money going to water treatment chemicals which help make the process better and clean waste water. Bio-based chemicals are also liked more because they are better for the earth.

Country CAGR (2025 to 2035)
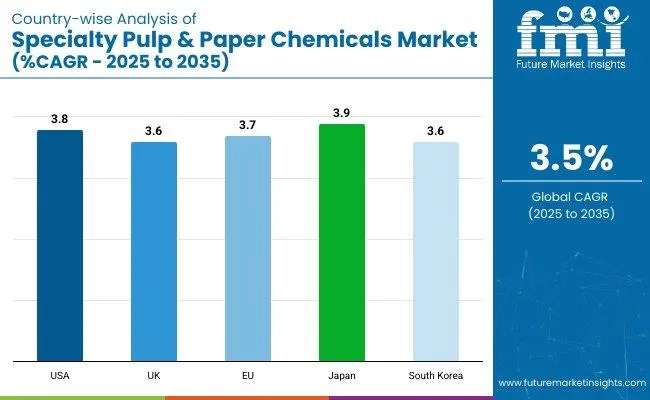
USA 3.8%

United Kingdom

The UK's market for specialty pulp and paper chemicals is seeing steady growth. This is because more people like recycled and biodegradable paper. The government is also pushing for more sustainable practices. New methods in fiber treatment and deinking are helping too. The UK Environment Agency (EA) and the British Paper and Board Industry Federation (BPIF) set rules to make sure the industry follows health and environmental standards.

There are some key trends in this market. People want more functional additives and chemicals that make paper stronger. There is also more use of sustainable coatings for food packaging. Nanotechnology in specialty chemicals is being used a lot for making high-performance paper. Efforts to reduce waste and support a circular economy are sparking new ideas in chemical formulations.

Country CAGR (2025 to 2035)
UK 3.6%

European Union

The market for specialty pulp and paper chemicals in the EU is growing. Strict rules on the environment help this growth. There is a shift to green, bio-based chemicals. Demand for top-quality papers for packaging, printing, and labels is also rising. The European Chemicals Agency and the European Commission watch over the safety rules. They ensure safe use of these special chemicals in paper making.

Big players in this market are Germany, France, and Italy. Their paper tech is advanced. They invest more in green, bio-based chemicals. Need for special coatings and retention agents is high. Strong recycling plans and EU Green Deal rules push the use of these sustainable chemicals.

Country CAGR (2025 to 2035)
European Union (EU) 3.7%

Japan

Japan's market for specialty pulp and paper chemicals is growing fast. This is because of more need for top-quality special papers, new ways to change fibers, and help from the government for recyclable and green paper. Two main players, the Ministry of Economy, Trade and Industry (METI) and the Japan Paper Association (JPA), make sure industry rules follow eco-friendly practices.

Key trends show more use of nanocellulose-based chemicals. There’s also more money going into biodegradable coatings for food wraps. Enzyme treatments are on the rise to better fiber quality and cut chemical waste. Japan’s push for top paper tech also helps specialty chemicals grow in areas like electronics and medical wraps.

Country CAGR (2025 to 2035)
Japan 3.9%

South Korea

South Korea's market for specialty pulp and paper chemicals is growing. There is more need for strong and water-resistant paper. People are making eco-friendly chemicals. The government backs green packaging. The Korean Ministry of Environment (MOE) and Korea Paper Association (KPA) push for safe chemical use in paper making.

The market trends show more use of bio binders and aids. Functional additives in special paper are getting popular. There is more money going into chemicals to treat wastewater. This helps the paper business be greener. Digital printing is getting bigger, so there is more need for good paper coatings and brighteners.

Country CAGR (2025 to 2035)
South Korea 3.6%

Competitive Outlook

The specialty pulp and paper chemicals market is driven by high-performance paper products, eco-friendly chemical formulations, and advances in paper processing technologies. The transition toward sustainable packaging, improved durability of paper, and enhanced printability are driving the market.

Companies are developing bio-based chemicals, specialty coatings as well as optimizing processes to improve efficiency and lower environmental impact. The market consists of five top chemical manufacturers, pulp and paper processing companies, and sustainability-oriented suppliers.

Key Companies

  • International Paper
  • UPM-Kymmene Corporation
  • Stora Enso
  • Sappi Limited
  • Fedrigoni S.p.A.
  • Koehler Paper Group
  • Mondi Group
  • Nippon Paper Industries Co., Ltd.
  • Oji Holdings Corporation
  • Billerud AB

Top Segments Studied in the Specialty Pulp and Paper Chemicals Market Research Report

By Product Type:

  • Basic Chemicals
  • Functional Chemicals
  • Bleaching Chemicals
  • Process Chemicals

By Application:

  • Printing
  • Packaging
  • Labeling
  • Others

By Region:

  • North America
  • Latin America
  • Western Europe
  • Eastern Europe
  • East Asia
  • South Asia Pacific
  • Middle East and Africa

Table of Content

  1. Executive Summary
    • Global Market Outlook
    • Demand-side Trends
    • Supply-side Trends
    • Technology Roadmap Analysis
    • Analysis and Recommendations
  2. Market Overview
    • Market Coverage / Taxonomy
    • Market Definition / Scope / Limitations
  3. Market Background
    • Market Dynamics
      • Drivers
      • Restraints
      • Opportunity
      • Trends
    • Scenario Forecast
      • Demand in Optimistic Scenario
      • Demand in Likely Scenario
      • Demand in Conservative Scenario
    • Opportunity Map Analysis
    • Product Life Cycle Analysis
    • Supply Chain Analysis
      • Supply Side Participants and their Roles
        • Producers
        • Mid-Level Participants (Traders/ Agents/ Brokers)
        • Wholesalers and Distributors
      • Value Added and Value Created at Node in the Supply Chain
      • List of Raw Material Suppliers
      • List of Existing and Potential Buyer’s
    • Investment Feasibility Matrix
    • Value Chain Analysis
      • Profit Margin Analysis
      • Wholesalers and Distributors
      • Retailers
    • PESTLE and Porter’s Analysis
    • Regulatory Landscape
      • By Key Regions
      • By Key Countries
    • Regional Parent Market Outlook
    • Production and Consumption Statistics
    • Import and Export Statistics
  4. Global Market Analysis 2020 to 2024 and Forecast, 2025 to 2035
    • Historical Market Size Value (USD Million) & Volume (Units) Analysis, 2020 to 2024
    • Current and Future Market Size Value (USD Million) & Volume (Units) Projections, 2025 to 2035
      • Y-o-Y Growth Trend Analysis
      • Absolute $ Opportunity Analysis
  5. Global Market Pricing Analysis 2020 to 2024 and Forecast 2025 to 2035
  6. Global Market Analysis 2020 to 2024 and Forecast 2025 to 2035, By Chemical Type
    • Introduction / Key Findings
    • Historical Market Size Value (USD Million) & Volume (Units) Analysis By Chemical Type, 2020 to 2024
    • Current and Future Market Size Value (USD Million) & Volume (Units) Analysis and Forecast By Chemical Type, 2025 to 2035
      • Bleaching Agents
      • Binding Agents
      • Sizing Agents
      • Coating Chemicals
      • Process Chemicals
      • Functional Additives
      • Deinking Agents
    • Y-o-Y Growth Trend Analysis By Chemical Type, 2020 to 2024
    • Absolute $ Opportunity Analysis By Chemical Type, 2025 to 2035
  7. Global Market Analysis 2020 to 2024 and Forecast 2025 to 2035, By Function
    • Introduction / Key Findings
    • Historical Market Size Value (USD Million) & Volume (Units) Analysis By Function, 2020 to 2024
    • Current and Future Market Size Value (USD Million) & Volume (Units) Analysis and Forecast By Function, 2025 to 2035
      • Strength Enhancement
      • Printability Improvement
      • Water Resistance
      • Optical Brightening
      • Pitch & Stickies Control
      • pH Adjustment
      • Drainage & Retention Aid
    • Y-o-Y Growth Trend Analysis By Function, 2020 to 2024
    • Absolute $ Opportunity Analysis By Function, 2025 to 2035
  8. Global Market Analysis 2020 to 2024 and Forecast 2025 to 2035, By Application Segment
    • Introduction / Key Findings
    • Historical Market Size Value (USD Million) & Volume (Units) Analysis By Application Segment, 2020 to 2024
    • Current and Future Market Size Value (USD Million) & Volume (Units) Analysis and Forecast By Application Segment, 2025 to 2035
      • Printing & Writing Paper
      • Packaging & Board
      • Tissue & Towel
      • Newsprint
      • Specialty Papers (Security, Filter, Label)
      • Recycled Paper Processing
    • Y-o-Y Growth Trend Analysis By Application Segment, 2020 to 2024
    • Absolute $ Opportunity Analysis By Application Segment, 2025 to 2035
  9. Global Market Analysis 2020 to 2024 and Forecast 2025 to 2035, By Region
    • Introduction
    • Historical Market Size Value (USD Million) & Volume (Units) Analysis By Region, 2020 to 2024
    • Current Market Size Value (USD Million) & Volume (Units) Analysis and Forecast By Region, 2025 to 2035
      • North America
      • Latin America
      • Europe
      • East Asia
      • South Asia
      • Oceania
      • MEA
    • Market Attractiveness Analysis By Region
  10. North America Market Analysis 2020 to 2024 and Forecast 2025 to 2035, By Country
    • Historical Market Size Value (USD Million) & Volume (Units) Trend Analysis By Market Taxonomy, 2020 to 2024
    • Market Size Value (USD Million) & Volume (Units) Forecast By Market Taxonomy, 2025 to 2035
      • By Country
        • USA
        • Canada
      • By Chemical Type
      • By Function
      • By Application Segment
    • Market Attractiveness Analysis
      • By Country
      • By Chemical Type
      • By Function
      • By Application Segment
    • Key Takeaways
  11. Latin America Market Analysis 2020 to 2024 and Forecast 2025 to 2035, By Country
    • Historical Market Size Value (USD Million) & Volume (Units) Trend Analysis By Market Taxonomy, 2020 to 2024
    • Market Size Value (USD Million) & Volume (Units) Forecast By Market Taxonomy, 2025 to 2035
      • By Country
        • Brazil
        • Mexico
        • Argentina
        • Chile
        • Peru
        • Rest of Latin America
      • By Chemical Type
      • By Function
      • By Application Segment
    • Market Attractiveness Analysis
      • By Country
      • By Chemical Type
      • By Function
      • By Application Segment
    • Key Takeaways
  12. Europe Market Analysis 2020 to 2024 and Forecast 2025 to 2035, By Country
    • Historical Market Size Value (USD Million) & Volume (Units) Trend Analysis By Market Taxonomy, 2020 to 2024
    • Market Size Value (USD Million) & Volume (Units) Forecast By Market Taxonomy, 2025 to 2035
      • By Country
        • Germany
        • Italy
        • France
        • UK
        • Spain
        • Russia
        • BENELUX
        • Rest of Europe
      • By Chemical Type
      • By Function
      • By Application Segment
    • Market Attractiveness Analysis
      • By Country
      • By Chemical Type
      • By Function
      • By Application Segment
    • Key Takeaways
  13. East Asia Market Analysis 2020 to 2024 and Forecast 2025 to 2035, By Country
    • Historical Market Size Value (USD Million) & Volume (Units) Trend Analysis By Market Taxonomy, 2020 to 2024
    • Market Size Value (USD Million) & Volume (Units) Forecast By Market Taxonomy, 2025 to 2035
      • By Country
        • China
        • Japan
        • South Korea
      • By Chemical Type
      • By Function
      • By Application Segment
    • Market Attractiveness Analysis
      • By Country
      • By Chemical Type
      • By Function
      • By Application Segment
    • Key Takeaways
  14. South Asia Market Analysis 2020 to 2024 and Forecast 2025 to 2035, By Country
    • Historical Market Size Value (USD Million) & Volume (Units) Trend Analysis By Market Taxonomy, 2020 to 2024
    • Market Size Value (USD Million) & Volume (Units) Forecast By Market Taxonomy, 2025 to 2035
      • By Country
        • India
        • Thailand
        • Malaysia
        • Indonesia
        • Rest of South Asia
      • By Chemical Type
      • By Function
      • By Application Segment
    • Market Attractiveness Analysis
      • By Country
      • By Chemical Type
      • By Function
      • By Application Segment
    • Key Takeaways
  15. Oceania Market Analysis 2020 to 2024 and Forecast 2025 to 2035, By Country
    • Historical Market Size Value (USD Million) & Volume (Units) Trend Analysis By Market Taxonomy, 2020 to 2024
    • Market Size Value (USD Million) & Volume (Units) Forecast By Market Taxonomy, 2025 to 2035
      • By Country
        • Australia
        • New Zealand
      • By Chemical Type
      • By Function
      • By Application Segment
    • Market Attractiveness Analysis
      • By Country
      • By Chemical Type
      • By Function
      • By Application Segment
    • Key Takeaways
  16. MEA Market Analysis 2020 to 2024 and Forecast 2025 to 2035, By Country
    • Historical Market Size Value (USD Million) & Volume (Units) Trend Analysis By Market Taxonomy, 2020 to 2024
    • Market Size Value (USD Million) & Volume (Units) Forecast By Market Taxonomy, 2025 to 2035
      • By Country
        • GCC
        • Rest of MEA
      • By Chemical Type
      • By Function
      • By Application Segment
    • Market Attractiveness Analysis
      • By Country
      • By Chemical Type
      • By Function
      • By Application Segment
    • Key Takeaways
  17. Key Countries Market Analysis
    • USA
      • Pricing Analysis
      • Market Share Analysis, 2024
        • By Chemical Type
        • By Function
        • By Application Segment
    • Canada
      • Pricing Analysis
      • Market Share Analysis, 2024
        • By Chemical Type
        • By Function
        • By Application Segment
    • Brazil
      • Pricing Analysis
      • Market Share Analysis, 2024
        • By Chemical Type
        • By Function
        • By Application Segment
    • Mexico
      • Pricing Analysis
      • Market Share Analysis, 2024
        • By Chemical Type
        • By Function
        • By Application Segment
    • Argentina
      • Pricing Analysis
      • Market Share Analysis, 2024
        • By Chemical Type
        • By Function
        • By Application Segment
  18. Market Structure Analysis
    • Competition Dashboard
    • Competition Benchmarking
    • Market Share Analysis of Top Players
      • By Regional
      • By Chemical Type
      • By Function
      • By Application Segment
  19. Competition Analysis
    • Competition Deep Dive
      • International Paper
        • Overview
        • Product Portfolio
        • Profitability by Market Segments (Product/Age /Sales Channel/Region)
        • Sales Footprint
        • Strategy Overview
          • Marketing Strategy
          • Product Strategy
          • Channel Strategy
      • UPM-Kymmene Corporation
        • Overview
        • Product Portfolio
        • Profitability by Market Segments (Product/Age /Sales Channel/Region)
        • Sales Footprint
        • Strategy Overview
          • Marketing Strategy
          • Product Strategy
          • Channel Strategy
      • Stora Enso
        • Overview
        • Product Portfolio
        • Profitability by Market Segments (Product/Age /Sales Channel/Region)
        • Sales Footprint
        • Strategy Overview
          • Marketing Strategy
          • Product Strategy
          • Channel Strategy
      • Sappi Limited
        • Overview
        • Product Portfolio
        • Profitability by Market Segments (Product/Age /Sales Channel/Region)
        • Sales Footprint
        • Strategy Overview
          • Marketing Strategy
          • Product Strategy
          • Channel Strategy
      • Fedrigoni S.p.A.
        • Overview
        • Product Portfolio
        • Profitability by Market Segments (Product/Age /Sales Channel/Region)
        • Sales Footprint
        • Strategy Overview
          • Marketing Strategy
          • Product Strategy
          • Channel Strategy
      • Koehler Paper Group
        • Overview
        • Product Portfolio
        • Profitability by Market Segments (Product/Age /Sales Channel/Region)
        • Sales Footprint
        • Strategy Overview
          • Marketing Strategy
          • Product Strategy
          • Channel Strategy
      • Mondi Group
        • Overview
        • Product Portfolio
        • Profitability by Market Segments (Product/Age /Sales Channel/Region)
        • Sales Footprint
        • Strategy Overview
          • Marketing Strategy
          • Product Strategy
          • Channel Strategy
      • Nippon Paper Industries Co., Ltd.
        • Overview
        • Product Portfolio
        • Profitability by Market Segments (Product/Age /Sales Channel/Region)
        • Sales Footprint
        • Strategy Overview
          • Marketing Strategy
          • Product Strategy
          • Channel Strategy
      • Oji Holdings Corporation
        • Overview
        • Product Portfolio
        • Profitability by Market Segments (Product/Age /Sales Channel/Region)
        • Sales Footprint
        • Strategy Overview
          • Marketing Strategy
          • Product Strategy
          • Channel Strategy
      • Billerud AB
        • Overview
        • Product Portfolio
        • Profitability by Market Segments (Product/Age /Sales Channel/Region)
        • Sales Footprint
        • Strategy Overview
          • Marketing Strategy
          • Product Strategy
          • Channel Strategy
  20. Assumptions & Acronyms Used
  21. Research Methodology

List of Tables

  • Table 1: Global Market Value (USD Million) Forecast by Region, 2020-2035
  • Table 2: Global Market Volume (Units) Forecast by Region, 2020-2035
  • Table 3: Global Market Value (USD Million) Forecast by Chemical Type, 2020-2035
  • Table 4: Global Market Volume (Units) Forecast by Chemical Type, 2020-2035
  • Table 5: Global Market Value (USD Million) Forecast by Function, 2020-2035
  • Table 6: Global Market Volume (Units) Forecast by Function, 2020-2035
  • Table 7: Global Market Value (USD Million) Forecast by Application Segment, 2020-2035
  • Table 8: Global Market Volume (Units) Forecast by Application Segment, 2020-2035
  • Table 9: North America Market Value (USD Million) Forecast by Country, 2020-2035
  • Table 10: North America Market Volume (Units) Forecast by Country, 2020-2035
  • Table 11: North America Market Value (USD Million) Forecast by Chemical Type, 2020-2035
  • Table 12: North America Market Volume (Units) Forecast by Chemical Type, 2020-2035
  • Table 13: North America Market Value (USD Million) Forecast by Function, 2020-2035
  • Table 14: North America Market Volume (Units) Forecast by Function, 2020-2035
  • Table 15: North America Market Value (USD Million) Forecast by Application Segment, 2020-2035
  • Table 16: North America Market Volume (Units) Forecast by Application Segment, 2020-2035
  • Table 17: Latin America Market Value (USD Million) Forecast by Country, 2020-2035
  • Table 18: Latin America Market Volume (Units) Forecast by Country, 2020-2035
  • Table 19: Latin America Market Value (USD Million) Forecast by Chemical Type, 2020-2035
  • Table 20: Latin America Market Volume (Units) Forecast by Chemical Type, 2020-2035
  • Table 21: Latin America Market Value (USD Million) Forecast by Function, 2020-2035
  • Table 22: Latin America Market Volume (Units) Forecast by Function, 2020-2035
  • Table 23: Latin America Market Value (USD Million) Forecast by Application Segment, 2020-2035
  • Table 24: Latin America Market Volume (Units) Forecast by Application Segment, 2020-2035
  • Table 25: Europe Market Value (USD Million) Forecast by Country, 2020-2035
  • Table 26: Europe Market Volume (Units) Forecast by Country, 2020-2035
  • Table 27: Europe Market Value (USD Million) Forecast by Chemical Type, 2020-2035
  • Table 28: Europe Market Volume (Units) Forecast by Chemical Type, 2020-2035
  • Table 29: Europe Market Value (USD Million) Forecast by Function, 2020-2035
  • Table 30: Europe Market Volume (Units) Forecast by Function, 2020-2035
  • Table 31: Europe Market Value (USD Million) Forecast by Application Segment, 2020-2035
  • Table 32: Europe Market Volume (Units) Forecast by Application Segment, 2020-2035
  • Table 33: East Asia Market Value (USD Million) Forecast by Country, 2020-2035
  • Table 34: East Asia Market Volume (Units) Forecast by Country, 2020-2035
  • Table 35: East Asia Market Value (USD Million) Forecast by Chemical Type, 2020-2035
  • Table 36: East Asia Market Volume (Units) Forecast by Chemical Type, 2020-2035
  • Table 37: East Asia Market Value (USD Million) Forecast by Function, 2020-2035
  • Table 38: East Asia Market Volume (Units) Forecast by Function, 2020-2035
  • Table 39: East Asia Market Value (USD Million) Forecast by Application Segment, 2020-2035
  • Table 40: East Asia Market Volume (Units) Forecast by Application Segment, 2020-2035
  • Table 41: South Asia Market Value (USD Million) Forecast by Country, 2020-2035
  • Table 42: South Asia Market Volume (Units) Forecast by Country, 2020-2035
  • Table 43: South Asia Market Value (USD Million) Forecast by Chemical Type, 2020-2035
  • Table 44: South Asia Market Volume (Units) Forecast by Chemical Type, 2020-2035
  • Table 45: South Asia Market Value (USD Million) Forecast by Function, 2020-2035
  • Table 46: South Asia Market Volume (Units) Forecast by Function, 2020-2035
  • Table 47: South Asia Market Value (USD Million) Forecast by Application Segment, 2020-2035
  • Table 48: South Asia Market Volume (Units) Forecast by Application Segment, 2020-2035
  • Table 49: Oceania Market Value (USD Million) Forecast by Country, 2020-2035
  • Table 50: Oceania Market Volume (Units) Forecast by Country, 2020-2035
  • Table 51: Oceania Market Value (USD Million) Forecast by Chemical Type, 2020-2035
  • Table 52: Oceania Market Volume (Units) Forecast by Chemical Type, 2020-2035
  • Table 53: Oceania Market Value (USD Million) Forecast by Function, 2020-2035
  • Table 54: Oceania Market Volume (Units) Forecast by Function, 2020-2035
  • Table 55: Oceania Market Value (USD Million) Forecast by Application Segment, 2020-2035
  • Table 56: Oceania Market Volume (Units) Forecast by Application Segment, 2020-2035
  • Table 57: MEA Market Value (USD Million) Forecast by Country, 2020-2035
  • Table 58: MEA Market Volume (Units) Forecast by Country, 2020-2035
  • Table 59: MEA Market Value (USD Million) Forecast by Chemical Type, 2020-2035
  • Table 60: MEA Market Volume (Units) Forecast by Chemical Type, 2020-2035
  • Table 61: MEA Market Value (USD Million) Forecast by Function, 2020-2035
  • Table 62: MEA Market Volume (Units) Forecast by Function, 2020-2035
  • Table 63: MEA Market Value (USD Million) Forecast by Application Segment, 2020-2035
  • Table 64: MEA Market Volume (Units) Forecast by Application Segment, 2020-2035

List of Figures

  • Figure 1: Global Market Volume (Units) Forecast 2020-2035
  • Figure 2: Global Market Pricing Analysis
  • Figure 3: Global Market Value (USD Million) Forecast 2020-2035
  • Figure 4: Global Market Value Share and BPS Analysis by Chemical Type, 2025 and 2035
  • Figure 5: Global Market Y-o-Y Growth Comparison by Chemical Type, 2025-2035
  • Figure 6: Global Market Attractiveness Analysis by Chemical Type
  • Figure 7: Global Market Value Share and BPS Analysis by Function, 2025 and 2035
  • Figure 8: Global Market Y-o-Y Growth Comparison by Function, 2025-2035
  • Figure 9: Global Market Attractiveness Analysis by Function
  • Figure 10: Global Market Value Share and BPS Analysis by Application Segment, 2025 and 2035
  • Figure 11: Global Market Y-o-Y Growth Comparison by Application Segment, 2025-2035
  • Figure 12: Global Market Attractiveness Analysis by Application Segment
  • Figure 13: Global Market Value (USD Million) Share and BPS Analysis by Region, 2025 and 2035
  • Figure 14: Global Market Y-o-Y Growth Comparison by Region, 2025-2035
  • Figure 15: Global Market Attractiveness Analysis by Region
  • Figure 16: North America Market Incremental $ Opportunity, 2025-2035
  • Figure 17: Latin America Market Incremental $ Opportunity, 2025-2035
  • Figure 18: Europe Market Incremental $ Opportunity, 2025-2035
  • Figure 19: East Asia Market Incremental $ Opportunity, 2025-2035
  • Figure 20: South Asia Market Incremental $ Opportunity, 2025-2035
  • Figure 21: Oceania Market Incremental $ Opportunity, 2025-2035
  • Figure 22: MEA Market Incremental $ Opportunity, 2025-2035
  • Figure 23: North America Market Value Share and BPS Analysis by Country, 2025 and 2035
  • Figure 24: North America Market Value Share and BPS Analysis by Chemical Type, 2025 and 2035
  • Figure 25: North America Market Y-o-Y Growth Comparison by Chemical Type, 2025-2035
  • Figure 26: North America Market Attractiveness Analysis by Chemical Type
  • Figure 27: North America Market Value Share and BPS Analysis by Function, 2025 and 2035
  • Figure 28: North America Market Y-o-Y Growth Comparison by Function, 2025-2035
  • Figure 29: North America Market Attractiveness Analysis by Function
  • Figure 30: North America Market Value Share and BPS Analysis by Application Segment, 2025 and 2035
  • Figure 31: North America Market Y-o-Y Growth Comparison by Application Segment, 2025-2035
  • Figure 32: North America Market Attractiveness Analysis by Application Segment
  • Figure 33: Latin America Market Value Share and BPS Analysis by Country, 2025 and 2035
  • Figure 34: Latin America Market Value Share and BPS Analysis by Chemical Type, 2025 and 2035
  • Figure 35: Latin America Market Y-o-Y Growth Comparison by Chemical Type, 2025-2035
  • Figure 36: Latin America Market Attractiveness Analysis by Chemical Type
  • Figure 37: Latin America Market Value Share and BPS Analysis by Function, 2025 and 2035
  • Figure 38: Latin America Market Y-o-Y Growth Comparison by Function, 2025-2035
  • Figure 39: Latin America Market Attractiveness Analysis by Function
  • Figure 40: Latin America Market Value Share and BPS Analysis by Application Segment, 2025 and 2035
  • Figure 41: Latin America Market Y-o-Y Growth Comparison by Application Segment, 2025-2035
  • Figure 42: Latin America Market Attractiveness Analysis by Application Segment
  • Figure 43: Europe Market Value Share and BPS Analysis by Country, 2025 and 2035
  • Figure 44: Europe Market Value Share and BPS Analysis by Chemical Type, 2025 and 2035
  • Figure 45: Europe Market Y-o-Y Growth Comparison by Chemical Type, 2025-2035
  • Figure 46: Europe Market Attractiveness Analysis by Chemical Type
  • Figure 47: Europe Market Value Share and BPS Analysis by Function, 2025 and 2035
  • Figure 48: Europe Market Y-o-Y Growth Comparison by Function, 2025-2035
  • Figure 49: Europe Market Attractiveness Analysis by Function
  • Figure 50: Europe Market Value Share and BPS Analysis by Application Segment, 2025 and 2035
  • Figure 51: Europe Market Y-o-Y Growth Comparison by Application Segment, 2025-2035
  • Figure 52: Europe Market Attractiveness Analysis by Application Segment
  • Figure 53: East Asia Market Value Share and BPS Analysis by Country, 2025 and 2035
  • Figure 54: East Asia Market Value Share and BPS Analysis by Chemical Type, 2025 and 2035
  • Figure 55: East Asia Market Y-o-Y Growth Comparison by Chemical Type, 2025-2035
  • Figure 56: East Asia Market Attractiveness Analysis by Chemical Type
  • Figure 57: East Asia Market Value Share and BPS Analysis by Function, 2025 and 2035
  • Figure 58: East Asia Market Y-o-Y Growth Comparison by Function, 2025-2035
  • Figure 59: East Asia Market Attractiveness Analysis by Function
  • Figure 60: East Asia Market Value Share and BPS Analysis by Application Segment, 2025 and 2035
  • Figure 61: East Asia Market Y-o-Y Growth Comparison by Application Segment, 2025-2035
  • Figure 62: East Asia Market Attractiveness Analysis by Application Segment
  • Figure 63: South Asia Market Value Share and BPS Analysis by Country, 2025 and 2035
  • Figure 64: South Asia Market Value Share and BPS Analysis by Chemical Type, 2025 and 2035
  • Figure 65: South Asia Market Y-o-Y Growth Comparison by Chemical Type, 2025-2035
  • Figure 66: South Asia Market Attractiveness Analysis by Chemical Type
  • Figure 67: South Asia Market Value Share and BPS Analysis by Function, 2025 and 2035
  • Figure 68: South Asia Market Y-o-Y Growth Comparison by Function, 2025-2035
  • Figure 69: South Asia Market Attractiveness Analysis by Function
  • Figure 70: South Asia Market Value Share and BPS Analysis by Application Segment, 2025 and 2035
  • Figure 71: South Asia Market Y-o-Y Growth Comparison by Application Segment, 2025-2035
  • Figure 72: South Asia Market Attractiveness Analysis by Application Segment
  • Figure 73: Oceania Market Value Share and BPS Analysis by Country, 2025 and 2035
  • Figure 74: Oceania Market Value Share and BPS Analysis by Chemical Type, 2025 and 2035
  • Figure 75: Oceania Market Y-o-Y Growth Comparison by Chemical Type, 2025-2035
  • Figure 76: Oceania Market Attractiveness Analysis by Chemical Type
  • Figure 77: Oceania Market Value Share and BPS Analysis by Function, 2025 and 2035
  • Figure 78: Oceania Market Y-o-Y Growth Comparison by Function, 2025-2035
  • Figure 79: Oceania Market Attractiveness Analysis by Function
  • Figure 80: Oceania Market Value Share and BPS Analysis by Application Segment, 2025 and 2035
  • Figure 81: Oceania Market Y-o-Y Growth Comparison by Application Segment, 2025-2035
  • Figure 82: Oceania Market Attractiveness Analysis by Application Segment
  • Figure 83: MEA Market Value Share and BPS Analysis by Country, 2025 and 2035
  • Figure 84: MEA Market Value Share and BPS Analysis by Chemical Type, 2025 and 2035
  • Figure 85: MEA Market Y-o-Y Growth Comparison by Chemical Type, 2025-2035
  • Figure 86: MEA Market Attractiveness Analysis by Chemical Type
  • Figure 87: MEA Market Value Share and BPS Analysis by Function, 2025 and 2035
  • Figure 88: MEA Market Y-o-Y Growth Comparison by Function, 2025-2035
  • Figure 89: MEA Market Attractiveness Analysis by Function
  • Figure 90: MEA Market Value Share and BPS Analysis by Application Segment, 2025 and 2035
  • Figure 91: MEA Market Y-o-Y Growth Comparison by Application Segment, 2025-2035
  • Figure 92: MEA Market Attractiveness Analysis by Application Segment
  • Figure 93: Global Market - Tier Structure Analysis
  • Figure 94: Global Market - Company Share Analysis

Frequently Asked Questions

What was the overall size of the specialty pulp and paper chemicals market in 2025?

The overall market size for the specialty pulp and paper chemicals market was USD 24.9 billion in 2025.

How big is the specialty pulp and paper chemicals market expected to be in 2035?

The specialty pulp and paper chemicals market is expected to reach USD 35.1 billion in 2035.

What will drive the demand for the specialty pulp and paper chemicals market during the forecast period?

Increasing demand for high-performance paper products, advancements in eco-friendly and sustainable chemicals, rising adoption of specialty coatings and functional additives, and growing emphasis on biodegradable packaging solutions will drive market growth.

List the top 5 countries contributing to the specialty pulp and paper chemicals market.

The USA, China, Germany, India, and Japan are key contributors.

Which segment in chemical type is expected to lead in the specialty pulp and paper chemicals market?

The functional chemicals segment is expected to lead due to their wide-ranging applications in enhancing paper strength, printability, and water resistance.

Explore Similar Insights

Future Market Insights

Specialty Pulp and Paper Chemicals Market