Specialty Food Ingredients Market Outlook and Forecast 2025 to 2035 

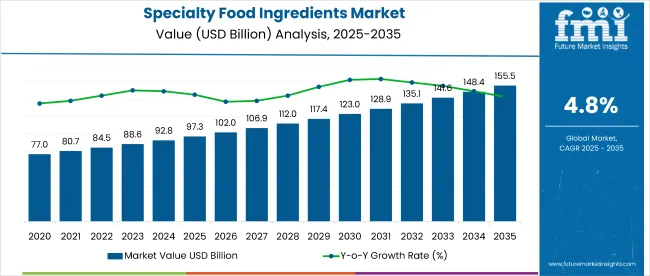
The global specialty food ingredients market is valued at USD 97.3 billion in 2025 and is slated to reach USD 155.5 billion by 2035, reflecting a CAGR of 4.8%. Growth is driven by rising demand for functional and fortified foods, increasing health consciousness among consumers, and advancements in clean-label ingredient formulations. In addition, the post-pandemic recovery and the shift towards convenient, nutrient-enriched products have positively impacted market expansion.
Quick Stats for Specialty Food Ingredients Market

  • Market Value (2025): USD 97.3 billion
  • Forecast Value (2035): USD 155.5 billion
  • Forecast CAGR: 4.8%
  • End Use Leader in 2025: Food and Beverages (70% Market Share)
  • Top Nature Segment: Conventional Ingredients (65% Market Share in 2025)
  • Key Growth Region: Western Europe (Germany is the fastest-growing market with 13.4% CAGR)

Specialty Food Ingredients Market Market Value Analysis

Metric Value
2025 Market Size USD 97.3 billion
2035 Market Size USD 155.5 billion
CAGR (2025 to 2035) 4.8%

Germany is projected to lead with the highest CAGR of 13.4% from 2025 to 2035, driven primarily by rising obesity rates and an increased focus on health-centric food products. France is expected to follow with a steady growth rate of 6.0%, supported by growing demand for natural flavors and functional foods.

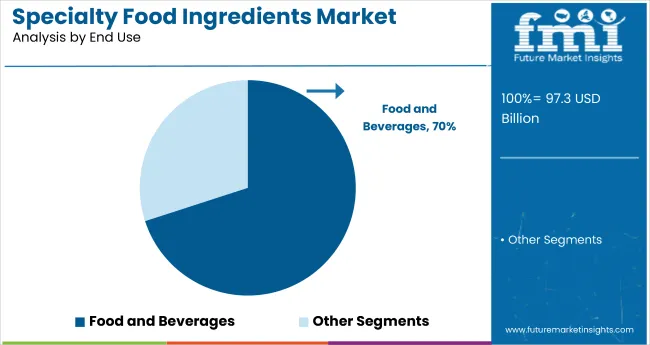
Japan ranks third with a moderate CAGR of 5.8%, fueled by its aging population and the increasing demand for nutraceutical and fortified food products. The top two segments in 2025 are conventional ingredients, leading the nature category with 65% market share, and food and beverages, leading with end-use segment with a 70% share due to broad application across key food categories.

Recent innovations in the specialty food ingredients market include advancements in precision fermentation, biofortification, and enzyme-based processing, enabling cleaner labels and improved nutritional profiles. Companies are leveraging recombinant technologies to produce functional compounds like beta-carotene and lycopene with enhanced efficiency.

Governments across Europe and North America have strengthened regulatory frameworks to support clean-label claims, allergen disclosures, and sustainability certifications. The European Food Safety Authority (EFSA) and the USA FDA have introduced guidelines favoring natural and organic ingredients, while APAC countries like China and India are streamlining approval processes to encourage foreign investments and technological integration in specialty food manufacturing.

The market holds 20-25% of the global food additives market, driven by demand for functional, clean-label, and health-oriented ingredients. Within the functional food and nutraceutical ingredients sectors, it accounts for nearly 30%, particularly due to its role in enhancing nutritional value.

In the processed food market, specialty ingredients contribute around 15-18%, supporting flavor, texture, and shelf-life extension. For the organic food and clean-label markets, the share ranges from 10-15%, as natural ingredients are prioritized. Overall, specialty food ingredients represent a growing portion of these parent markets, especially as health and wellness trends accelerate globally.

Speciality Food Ingredients Market Analysis by Top Investment Segments

The specialty food ingredients market segments include nature, type, end use, distribution channel, and region. The nature segment includes organic and conventional. The type segment comprises antioxidants, colorants, emulsifiers, enzymes, flavors, minerals, preservatives, and vitamins.

The end-use segment includes food and beverages, personal care, and nutrition and health. The food and beverages sub-segment covers bakery, confectionery, beverages, dietary supplements, convenience foods, dairy & frozen foods, functional foods, and meat products.

The personal care, nutrition, and health sub-segment includes nutraceutical ingredients and active pharmaceutical ingredients. The distribution channel segment includes direct and indirect channels, with indirect further categorized into hypermarkets, supermarkets, convenience stores, specialty retail stores, and online retailers. The regional segment includes North America, Latin America, Western Europe, Eastern Europe, South Asia and Pacific, East Asia, and the Middle East & Africa.

Conventional Ingredients to Dominate Nature Segment with 65% Market Share in 2025

The conventional segment currently dominates the specialty food ingredients market, accounting for approximately 65% of the total market share in 2025.

  • Conventional ingredients are preferred by large-scale food processors due to their consistent supply chains, cost-effectiveness, and regulatory compliance.
  • Despite increasing demand for organic alternatives, conventional ingredients remain integral to high-volume product lines, particularly in emerging economies where price sensitivity prevails.

Enzymes to Lead Type Segment with 32.1% Market Share in 2025

Enzymes emerge as the most lucrative segment in the specialty food ingredients market, projected to hold the largest share at 32.1% in 2025.
  • Enzymes also support reduced chemical use and enable natural product positioning, aligning with regulatory and consumer trends.
  • As demand for sustainable and minimally processed foods rises, the enzyme segment is expected to maintain its leadership and record robust growth through 2035.

Food and Beverages Segment to Command End Use Segment with 70% Market Share in 2025

Specialty Food Ingredients Market Analysis By End Use

The food and beverages segment is projected to lead the specialty food ingredients market with a commanding 70% market share. This dominance is driven by the widespread application of specialty ingredients across a variety of food categories such as bakery, beverages, dairy, and convenience foods.
  • Consumers' increasing preference for functional, fortified, and clean-label products has significantly boosted demand within this segment.
  • Additionally, innovation in flavor, texture, shelf life, and nutritional enhancement continues to attract manufacturers toward specialty ingredients, solidifying the segment’s leadership across both developed and emerging markets.

Direct to Lead Distribution Channel Over 55% Market Share in 2025

Specialty Food Ingredients Market Analysis By Distribution Channel

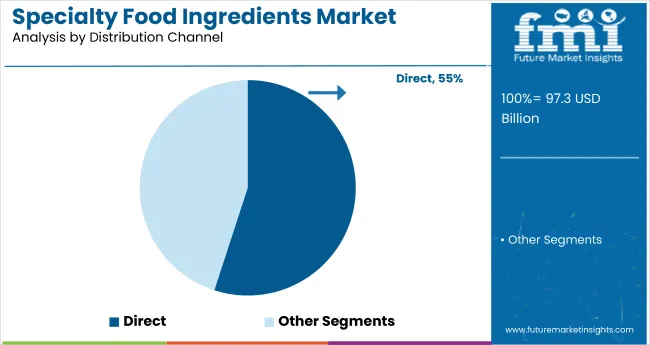
The direct distribution channel is considered the most lucrative in the specialty food ingredients market, projected to account for over 55% of the market share in 2025.

  • This channel is favored by manufacturers and large-scale food processors due to benefits such as bulk purchasing, better pricing control, and strong supplier relationships.
  • It ensures consistent quality, faster delivery, and streamlined logistics, making it the preferred choice for B2B transactions in the food manufacturing sector.

Top Specialty Food Ingredients Market Dynamics

The market is growing steadily, driven by rising demand for clean-label and functional foods, increasing health-conscious consumer behavior, and advancements in enzyme, vitamin, and flavor technologies across the food, beverage, and nutraceutical industries.

Recent Trends in the Specialty Food Ingredients Market
  • Growing consumer preference for clean-label and organic ingredients is boosting demand.
  • Increasing use of enzymes and vitamins for functional food enhancement drives market growth.
  • Rising health consciousness fuels demand for fortified and nutrient-enriched foods.

Challenges in the Specialty Food Ingredients Market

  • High costs and limited availability of organic raw materials restrict market expansion.
  • Regulatory complexities and varying standards across regions slow product approvals.
  • Supply chain disruptions affect consistent ingredient sourcing and delivery.
  • Competition from synthetic additives challenges natural ingredient adoption.

Analyzing Top Countries Producing and Consuming Specialty Food Ingredients

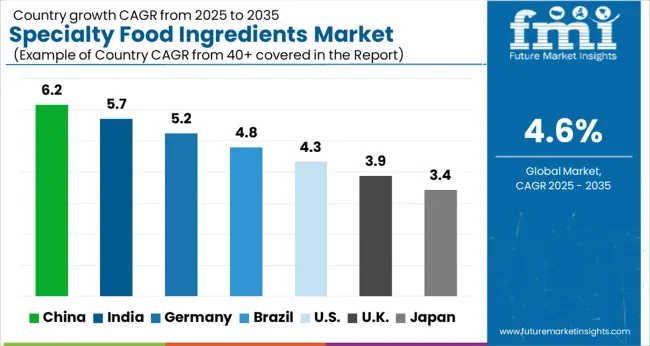
Among the top five countries, Germany leads the specialty food ingredients market with the highest projected CAGR of 13.4% from 2025 to 2035, driven by rising obesity rates and a focus on health-centric products. Japan follows with a moderate CAGR of 5.8%, fueled by an aging population and growing demand for nutraceuticals.

The USA market is expected to grow at 5.2%, supported by clean-label and functional food trends. France and the UK show steady growth rates of 6.0% and 4.6%, respectively, reflecting increased demand for natural ingredients and convenience foods in these mature markets.

The report covers an in-depth analysis of 40+ countries; five top-performing OECD countries are highlighted below. 
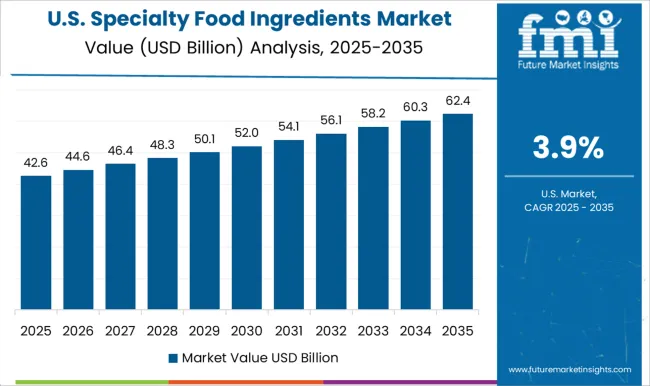
USA Specialty Food Ingredients Analysis

The USA specialty food ingredients are projected to grow at a CAGR of 5.2% from 2025 to 2035, driven by increasing consumer demand for clean-label and functional foods.

  • High consumer preference for organic and fortified foods.
  • Leading manufacturers are investing in product innovation.
  • Well-established distribution networks including direct and online channels.
  • Government regulations encouraging clean-label transparency.

Specialty Food Ingredients Demand Analysis in the UK

The UK specialty food ingredients revenue is expected to grow at a CAGR of 4.6% during 2025 to 2035. Growing health consciousness and demand for convenience foods have led to increased usage of functional and natural ingredients.
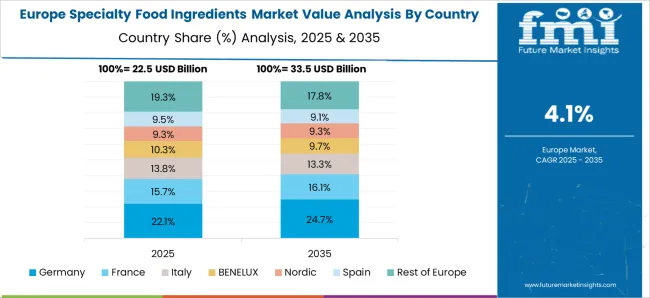
  • Rising demand for natural colorants and preservatives.
  • Expansion of e-commerce platforms for specialty ingredients.
  • Consumer shift towards plant-based and allergen-free products.
  • Active government initiatives promoting sustainable food production.

Specialty Food Ingredients Demand Analysis in Germany

The Germany specialty food ingredients revenue is forecasted to register the highest CAGR of 13.4% between 2025 and 2035, propelled by the growing obese population and increased focus on health-focused food products.

  • Increasing incorporation of biofortified ingredients in food products.
  • Strong investment in food technology and innovation hubs.
  • Growing consumer awareness about obesity and wellness.
  • Supportive policies for organic and sustainable ingredient sourcing.

Specialty Food Ingredients Demand Analysis in France

The specialty food ingredients demand in France is expected to grow at a CAGR of 6.0% from 2025 to 2035. The growth is supported by rising demand for natural flavors and colorants in the bakery and beverage sectors.
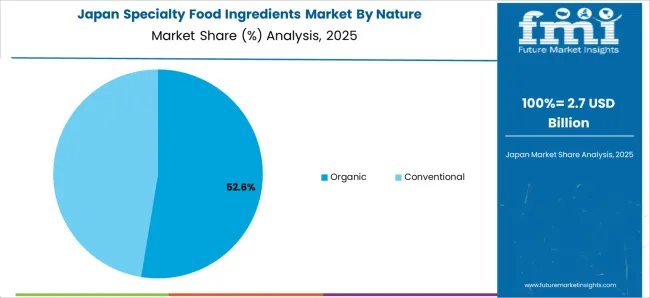
  • High demand for natural and organic food ingredients.
  • Growth in convenience and functional food sectors.
  • Active role of specialty retailers and online distribution channels.
  • Strong food safety regulations encourage transparency.

Japan Specialty Food Ingredients Market Analysis

The Japan specialty food ingredients sales are projected to grow at a CAGR of 5.8% from 2025 to 2035. Rising consumer health awareness and an aging population drive demand for nutraceutical and fortified food products.
  • Growing demand for dietary supplements and functional beverages.
  • Increasing use of enzymes and vitamins in processed foods.
  • Strong collaboration between research institutes and industry.
  • Expanding e-commerce and specialty retail channels.

Leading Specialty Food Ingredients Manufacturers and Suppliers

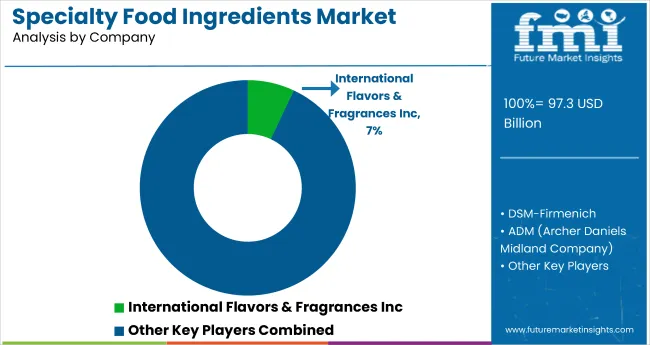
Specialty Food Ingredients Market Analysis By Company

The market is moderately consolidated, with a handful of tier-one companies such as Evonik, Archer Daniels Midland Company, and Koninklijke DSM N.V. holding significant market shares. These leading players compete through strategic investments in innovation, extensive R&D, and global expansion initiatives.

Companies like Cargill Inc. and Ingredion Incorporated are emphasizing sustainability and transparency in their supply chains, investing in natural and organic ingredient lines. Pricing strategies are carefully balanced with innovation to retain competitive advantage while catering to cost-sensitive clients, especially in developing regions.

Specialty Food Ingredients Market Report Scope

Report Attributes Details
Current Total Market Size (2025) USD 97.3 billion
Projected Market Size (2035) USD 155.5 billion
CAGR (2025 to 2035) 4.8%
Base Year for Estimation 2024
Historical Period 2020 to 2024
Projection Period 2025 to 2035
Market Analysis Parameters Revenue in USD billions / Volume in metric tons
By Nature Organic, Conventional
By Type Antioxidants, Colorants, Emulsifiers, Enzymes, Flavors, Minerals, Preservatives, Vitamins
By End Use Food and Beverages (Bakery, Confectionery, Beverages, Dietary Supplements, Convenience Foods, Dairy & Frozen Foods, Functional Foods, Meat Products), Personal Care, Nutrition and Health (Nutraceutical Ingredients, Active Pharmaceutical Ingredients)
By Distribution Channel Direct, Indirect (Hypermarkets, Supermarkets, Convenience Stores, Specialty Retail Stores, Online Retailers)
Regions Covered North America, Latin America, Western Europe, Eastern Europe, East Asia, South Asia & Pacific, Middle East & Africa
Countries Covered United States, Canada, United Kingdom, Germany, France, China, Japan, South Korea, Brazil, Australia, and 40+ countries
Key Players Evonik, Archer Daniels Midland Company, PPG Industries, KF Specialty Ingredients, Koninklijke DSM N.V., Specialty Commodities Inc., Ingredion Incorporated, Prinova Group LLC, Naturex, Kerry Group Plc, E. I. Dupont De Nemours and Company, Cargill Inc., Frutarom, Woodland Foods Inc., Tate & Lyle Plc, AmTech Ingredients LLC, Roquette Frères S.A., Vidhi Limited, Sensient Technologies Corporation.
Additional Attributes Dollar sales by value, market share analysis by region, and country-wise analysis.

Key Segments

By Nature:

  • Organic
  • Conventional

By Type:

  • Antioxidants
  • Colorants
  • Emulsifiers
  • Enzymes
  • Flavors
  • Minerals
  • Preservatives
  • Vitamins

By End Use:

  • Food and Beverages
  • Bakery
  • Confectionery
  • Beverages
  • Dietary Supplements
  • Convenience Foods
  • Dairy & Frozen Foods
  • Functional Foods
  • Meat Products
  • Personal Care
  • Nutrition and Health
  • Nutraceutical Ingredients
  • Active Pharmaceutical Ingredients

By Distribution Channel:

  • Direct
  • Indirect
  • Hypermarkets
  • Supermarkets
  • Convenience Stores
  • Specialty Retail Stores
  • Online Retailers

By Region:

  • North America
  • Latin America
  • Europe
  • East Asia
  • South Asia
  • Oceania
  • Middle East & Africa (MEA)

Table of Content

  1. Executive Summary
    • Global Market Outlook
    • Demand-side Trends
    • Supply-side Trends
    • Technology Roadmap Analysis
    • Analysis and Recommendations
  2. Market Overview
    • Market Coverage / Taxonomy
    • Market Definition / Scope / Limitations
  3. Market Background
    • Market Dynamics
      • Drivers
      • Restraints
      • Opportunity
      • Trends
    • Scenario Forecast
      • Demand in Optimistic Scenario
      • Demand in Likely Scenario
      • Demand in Conservative Scenario
    • Opportunity Map Analysis
    • Product Life Cycle Analysis
    • Supply Chain Analysis
      • Supply Side Participants and their Roles
        • Producers
        • Mid-Level Participants (Traders/ Agents/ Brokers)
        • Wholesalers and Distributors
      • Value Added and Value Created at Node in the Supply Chain
      • List of Raw Material Suppliers
      • List of Existing and Potential Buyer’s
    • Investment Feasibility Matrix
    • Value Chain Analysis
      • Profit Margin Analysis
      • Wholesalers and Distributors
      • Retailers
    • PESTLE and Porter’s Analysis
    • Regulatory Landscape
      • By Key Regions
      • By Key Countries
    • Regional Parent Market Outlook
    • Production and Consumption Statistics
    • Import and Export Statistics
  4. Global Market Analysis 2020 to 2024 and Forecast, 2025 to 2035
    • Historical Market Size Value (USD Billion) & Volume (Metric Tons) Analysis, 2020 to 2024
    • Current and Future Market Size Value (USD Billion) & Volume (Metric Tons) Projections, 2025 to 2035
      • Y-o-Y Growth Trend Analysis
      • Absolute $ Opportunity Analysis
  5. Global Market Pricing Analysis 2020 to 2024 and Forecast 2025 to 2035
  6. Global Market Analysis 2020 to 2024 and Forecast 2025 to 2035, By Nature
    • Introduction / Key Findings
    • Historical Market Size Value (USD Billion) & Volume (Metric Tons) Analysis By Nature, 2020 to 2024
    • Current and Future Market Size Value (USD Billion) & Volume (Metric Tons) Analysis and Forecast By Nature, 2025 to 2035
      • Organic
      • Conventional
    • Y-o-Y Growth Trend Analysis By Nature, 2020 to 2024
    • Absolute $ Opportunity Analysis By Nature, 2025 to 2035
  7. Global Market Analysis 2020 to 2024 and Forecast 2025 to 2035, By Type
    • Introduction / Key Findings
    • Historical Market Size Value (USD Billion) & Volume (Metric Tons) Analysis By Type, 2020 to 2024
    • Current and Future Market Size Value (USD Billion) & Volume (Metric Tons) Analysis and Forecast By Type, 2025 to 2035
      • Antioxidants
      • Colorants
      • Emulsifiers
      • Enzymes
      • Flavors
      • Minerals
      • Preservatives
      • Vitamins
    • Y-o-Y Growth Trend Analysis By Type, 2020 to 2024
    • Absolute $ Opportunity Analysis By Type, 2025 to 2035
  8. Global Market Analysis 2020 to 2024 and Forecast 2025 to 2035, By End Use
    • Introduction / Key Findings
    • Historical Market Size Value (USD Billion) & Volume (Metric Tons) Analysis By End Use, 2020 to 2024
    • Current and Future Market Size Value (USD Billion) & Volume (Metric Tons) Analysis and Forecast By End Use, 2025 to 2035
      • Food and Beverages
        • Bakery
        • Confectionery
        • Beverages
        • Dietary Supplements
        • Convenience Foods
        • Dairy & Frozen Foods
        • Functional Foods
        • Meat Products
      • Personal Care
      • Nutrition and Health
        • Nutraceutical Ingredients
        • Active Pharmaceutical Ingredients
    • Y-o-Y Growth Trend Analysis By End Use, 2020 to 2024
    • Absolute $ Opportunity Analysis By End Use, 2025 to 2035
  9. Global Market Analysis 2020 to 2024 and Forecast 2025 to 2035, By Distribution Channel
    • Introduction / Key Findings
    • Historical Market Size Value (USD Billion) & Volume (Metric Tons) Analysis By Distribution Channel, 2020 to 2024
    • Current and Future Market Size Value (USD Billion) & Volume (Metric Tons) Analysis and Forecast By Distribution Channel, 2025 to 2035
      • Direct
      • Indirect
        • Hypermarkets
        • Supermarkets
        • Convenience Stores
        • Specialty Retail Stores
        • Online Retailers
    • Y-o-Y Growth Trend Analysis By Distribution Channel, 2020 to 2024
    • Absolute $ Opportunity Analysis By Distribution Channel, 2025 to 2035
  10. Global Market Analysis 2020 to 2024 and Forecast 2025 to 2035, By Region
    • Introduction
    • Historical Market Size Value (USD Billion) & Volume (Metric Tons) Analysis By Region, 2020 to 2024
    • Current Market Size Value (USD Billion) & Volume (Metric Tons) Analysis and Forecast By Region, 2025 to 2035
      • North America
      • Latin America
      • Western Europe
      • Eastern Europe
      • East Asia
      • South Asia & Pacific
      • Middle East and Africa
    • Market Attractiveness Analysis By Region
  11. North America Market Analysis 2020 to 2024 and Forecast 2025 to 2035, By Country
    • Historical Market Size Value (USD Billion) & Volume (Metric Tons) Trend Analysis By Market Taxonomy, 2020 to 2024
    • Market Size Value (USD Billion) & Volume (Metric Tons) Forecast By Market Taxonomy, 2025 to 2035
      • By Country
        • USA
        • Canada
        • Mexico
      • By Nature
      • By Type
      • By End Use
      • By Distribution Channel
    • Market Attractiveness Analysis
      • By Country
      • By Nature
      • By Type
      • By End Use
      • By Distribution Channel
    • Key Takeaways
  12. Latin America Market Analysis 2020 to 2024 and Forecast 2025 to 2035, By Country
    • Historical Market Size Value (USD Billion) & Volume (Metric Tons) Trend Analysis By Market Taxonomy, 2020 to 2024
    • Market Size Value (USD Billion) & Volume (Metric Tons) Forecast By Market Taxonomy, 2025 to 2035
      • By Country
        • Brazil
        • Argentina
        • Rest of LATAM
      • By Nature
      • By Type
      • By End Use
      • By Distribution Channel
    • Market Attractiveness Analysis
      • By Country
      • By Nature
      • By Type
      • By End Use
      • By Distribution Channel
    • Key Takeaways
  13. Western Europe Market Analysis 2020 to 2024 and Forecast 2025 to 2035, By Country
    • Historical Market Size Value (USD Billion) & Volume (Metric Tons) Trend Analysis By Market Taxonomy, 2020 to 2024
    • Market Size Value (USD Billion) & Volume (Metric Tons) Forecast By Market Taxonomy, 2025 to 2035
      • By Country
        • Germany
        • Italy
        • France
        • UK
        • Spain
        • BENELUX
        • Nordic
        • Rest of W.Europe
      • By Nature
      • By Type
      • By End Use
      • By Distribution Channel
    • Market Attractiveness Analysis
      • By Country
      • By Nature
      • By Type
      • By End Use
      • By Distribution Channel
    • Key Takeaways
  14. Eastern Europe Market Analysis 2020 to 2024 and Forecast 2025 to 2035, By Country
    • Historical Market Size Value (USD Billion) & Volume (Metric Tons) Trend Analysis By Market Taxonomy, 2020 to 2024
    • Market Size Value (USD Billion) & Volume (Metric Tons) Forecast By Market Taxonomy, 2025 to 2035
      • By Country
        • Russia
        • Hungary
        • Poland
        • Balkan & Baltics
        • Rest of E. Europe
      • By Nature
      • By Type
      • By End Use
      • By Distribution Channel
    • Market Attractiveness Analysis
      • By Country
      • By Nature
      • By Type
      • By End Use
      • By Distribution Channel
    • Key Takeaways
  15. East Asia Market Analysis 2020 to 2024 and Forecast 2025 to 2035, By Country
    • Historical Market Size Value (USD Billion) & Volume (Metric Tons) Trend Analysis By Market Taxonomy, 2020 to 2024
    • Market Size Value (USD Billion) & Volume (Metric Tons) Forecast By Market Taxonomy, 2025 to 2035
      • By Country
        • China
        • Japan
        • South Korea
      • By Nature
      • By Type
      • By End Use
      • By Distribution Channel
    • Market Attractiveness Analysis
      • By Country
      • By Nature
      • By Type
      • By End Use
      • By Distribution Channel
    • Key Takeaways
  16. South Asia & Pacific Market Analysis 2020 to 2024 and Forecast 2025 to 2035, By Country
    • Historical Market Size Value (USD Billion) & Volume (Metric Tons) Trend Analysis By Market Taxonomy, 2020 to 2024
    • Market Size Value (USD Billion) & Volume (Metric Tons) Forecast By Market Taxonomy, 2025 to 2035
      • By Country
        • India
        • Australia & New Zealand
        • ASEAN
        • Rest of SAP
      • By Nature
      • By Type
      • By End Use
      • By Distribution Channel
    • Market Attractiveness Analysis
      • By Country
      • By Nature
      • By Type
      • By End Use
      • By Distribution Channel
    • Key Takeaways
  17. Middle East and Africa Market Analysis 2020 to 2024 and Forecast 2025 to 2035, By Country
    • Historical Market Size Value (USD Billion) & Volume (Metric Tons) Trend Analysis By Market Taxonomy, 2020 to 2024
    • Market Size Value (USD Billion) & Volume (Metric Tons) Forecast By Market Taxonomy, 2025 to 2035
      • By Country
        • GCC Countries
        • Northern Africa
        • South Africa
        • Turkiye
        • Rest of MEA
      • By Nature
      • By Type
      • By End Use
      • By Distribution Channel
    • Market Attractiveness Analysis
      • By Country
      • By Nature
      • By Type
      • By End Use
      • By Distribution Channel
    • Key Takeaways
  18. Key Countries Market Analysis
    • USA
      • Pricing Analysis
      • Market Share Analysis, 2024
        • By Nature
        • By Type
        • By End Use
        • By Distribution Channel
    • Canada
      • Pricing Analysis
      • Market Share Analysis, 2024
        • By Nature
        • By Type
        • By End Use
        • By Distribution Channel
    • Brazil
      • Pricing Analysis
      • Market Share Analysis, 2024
        • By Nature
        • By Type
        • By End Use
        • By Distribution Channel
    • Mexico
      • Pricing Analysis
      • Market Share Analysis, 2024
        • By Nature
        • By Type
        • By End Use
        • By Distribution Channel
    • Argentina
      • Pricing Analysis
      • Market Share Analysis, 2024
        • By Nature
        • By Type
        • By End Use
        • By Distribution Channel
  19. Market Structure Analysis
    • Competition Dashboard
    • Competition Benchmarking
    • Market Share Analysis of Top Players
      • By Regional
      • By Nature
      • By Type
      • By End Use
      • By Distribution Channel
  20. Competition Analysis
    • Competition Deep Dive
      • Evonik
        • Overview
        • Product Portfolio
        • Profitability by Market Segments (Product/Age /Sales Channel/Region)
        • Sales Footprint
        • Strategy Overview
          • Marketing Strategy
          • Product Strategy
          • Channel Strategy
      • Archer Daniels Midland Company
        • Overview
        • Product Portfolio
        • Profitability by Market Segments (Product/Age /Sales Channel/Region)
        • Sales Footprint
        • Strategy Overview
          • Marketing Strategy
          • Product Strategy
          • Channel Strategy
      • PPG Industries
        • Overview
        • Product Portfolio
        • Profitability by Market Segments (Product/Age /Sales Channel/Region)
        • Sales Footprint
        • Strategy Overview
          • Marketing Strategy
          • Product Strategy
          • Channel Strategy
      • KF Specialty Ingredients
        • Overview
        • Product Portfolio
        • Profitability by Market Segments (Product/Age /Sales Channel/Region)
        • Sales Footprint
        • Strategy Overview
          • Marketing Strategy
          • Product Strategy
          • Channel Strategy
      • Koninklijke DSM N.V.
        • Overview
        • Product Portfolio
        • Profitability by Market Segments (Product/Age /Sales Channel/Region)
        • Sales Footprint
        • Strategy Overview
          • Marketing Strategy
          • Product Strategy
          • Channel Strategy
      • Specialty Commodities Inc.
        • Overview
        • Product Portfolio
        • Profitability by Market Segments (Product/Age /Sales Channel/Region)
        • Sales Footprint
        • Strategy Overview
          • Marketing Strategy
          • Product Strategy
          • Channel Strategy
      • Ingredion Incorporated
        • Overview
        • Product Portfolio
        • Profitability by Market Segments (Product/Age /Sales Channel/Region)
        • Sales Footprint
        • Strategy Overview
          • Marketing Strategy
          • Product Strategy
          • Channel Strategy
      • Prinova Group
        • Overview
        • Product Portfolio
        • Profitability by Market Segments (Product/Age /Sales Channel/Region)
        • Sales Footprint
        • Strategy Overview
          • Marketing Strategy
          • Product Strategy
          • Channel Strategy
      • LLC
        • Overview
        • Product Portfolio
        • Profitability by Market Segments (Product/Age /Sales Channel/Region)
        • Sales Footprint
        • Strategy Overview
          • Marketing Strategy
          • Product Strategy
          • Channel Strategy
      • Naturex
        • Overview
        • Product Portfolio
        • Profitability by Market Segments (Product/Age /Sales Channel/Region)
        • Sales Footprint
        • Strategy Overview
          • Marketing Strategy
          • Product Strategy
          • Channel Strategy
      • Kerry Group Plc
        • Overview
        • Product Portfolio
        • Profitability by Market Segments (Product/Age /Sales Channel/Region)
        • Sales Footprint
        • Strategy Overview
          • Marketing Strategy
          • Product Strategy
          • Channel Strategy
      • E. I. Dupont De Nemours and Company
        • Overview
        • Product Portfolio
        • Profitability by Market Segments (Product/Age /Sales Channel/Region)
        • Sales Footprint
        • Strategy Overview
          • Marketing Strategy
          • Product Strategy
          • Channel Strategy
      • Cargill Inc.
        • Overview
        • Product Portfolio
        • Profitability by Market Segments (Product/Age /Sales Channel/Region)
        • Sales Footprint
        • Strategy Overview
          • Marketing Strategy
          • Product Strategy
          • Channel Strategy
      • Frutarom
        • Overview
        • Product Portfolio
        • Profitability by Market Segments (Product/Age /Sales Channel/Region)
        • Sales Footprint
        • Strategy Overview
          • Marketing Strategy
          • Product Strategy
          • Channel Strategy
      • Woodland Foods Inc.
        • Overview
        • Product Portfolio
        • Profitability by Market Segments (Product/Age /Sales Channel/Region)
        • Sales Footprint
        • Strategy Overview
          • Marketing Strategy
          • Product Strategy
          • Channel Strategy
      • Tate & Lyle Plc
        • Overview
        • Product Portfolio
        • Profitability by Market Segments (Product/Age /Sales Channel/Region)
        • Sales Footprint
        • Strategy Overview
          • Marketing Strategy
          • Product Strategy
          • Channel Strategy
      • AmTech Ingredients LLC
        • Overview
        • Product Portfolio
        • Profitability by Market Segments (Product/Age /Sales Channel/Region)
        • Sales Footprint
        • Strategy Overview
          • Marketing Strategy
          • Product Strategy
          • Channel Strategy
      • Roquette Frères S.A.
        • Overview
        • Product Portfolio
        • Profitability by Market Segments (Product/Age /Sales Channel/Region)
        • Sales Footprint
        • Strategy Overview
          • Marketing Strategy
          • Product Strategy
          • Channel Strategy
      • Vidhi Limited
        • Overview
        • Product Portfolio
        • Profitability by Market Segments (Product/Age /Sales Channel/Region)
        • Sales Footprint
        • Strategy Overview
          • Marketing Strategy
          • Product Strategy
          • Channel Strategy
      • Sensient Technologies Corporation
        • Overview
        • Product Portfolio
        • Profitability by Market Segments (Product/Age /Sales Channel/Region)
        • Sales Footprint
        • Strategy Overview
          • Marketing Strategy
          • Product Strategy
          • Channel Strategy
  21. Assumptions & Acronyms Used
  22. Research Methodology

List of Tables

  • Table 1: Global Market Value (USD Billion) Forecast by Region, 2020-2035
  • Table 2: Global Market Volume (Metric Tons) Forecast by Region, 2020-2035
  • Table 3: Global Market Value (USD Billion) Forecast by Nature, 2020-2035
  • Table 4: Global Market Volume (Metric Tons) Forecast by Nature, 2020-2035
  • Table 5: Global Market Value (USD Billion) Forecast by Type, 2020-2035
  • Table 6: Global Market Volume (Metric Tons) Forecast by Type, 2020-2035
  • Table 7: Global Market Value (USD Billion) Forecast by End Use, 2020-2035
  • Table 8: Global Market Volume (Metric Tons) Forecast by End Use, 2020-2035
  • Table 9: Global Market Value (USD Billion) Forecast by Distribution Channel, 2020-2035
  • Table 10: Global Market Volume (Metric Tons) Forecast by Distribution Channel, 2020-2035
  • Table 11: North America Market Value (USD Billion) Forecast by Country, 2020-2035
  • Table 12: North America Market Volume (Metric Tons) Forecast by Country, 2020-2035
  • Table 13: North America Market Value (USD Billion) Forecast by Nature, 2020-2035
  • Table 14: North America Market Volume (Metric Tons) Forecast by Nature, 2020-2035
  • Table 15: North America Market Value (USD Billion) Forecast by Type, 2020-2035
  • Table 16: North America Market Volume (Metric Tons) Forecast by Type, 2020-2035
  • Table 17: North America Market Value (USD Billion) Forecast by End Use, 2020-2035
  • Table 18: North America Market Volume (Metric Tons) Forecast by End Use, 2020-2035
  • Table 19: North America Market Value (USD Billion) Forecast by Distribution Channel, 2020-2035
  • Table 20: North America Market Volume (Metric Tons) Forecast by Distribution Channel, 2020-2035
  • Table 21: Latin America Market Value (USD Billion) Forecast by Country, 2020-2035
  • Table 22: Latin America Market Volume (Metric Tons) Forecast by Country, 2020-2035
  • Table 23: Latin America Market Value (USD Billion) Forecast by Nature, 2020-2035
  • Table 24: Latin America Market Volume (Metric Tons) Forecast by Nature, 2020-2035
  • Table 25: Latin America Market Value (USD Billion) Forecast by Type, 2020-2035
  • Table 26: Latin America Market Volume (Metric Tons) Forecast by Type, 2020-2035
  • Table 27: Latin America Market Value (USD Billion) Forecast by End Use, 2020-2035
  • Table 28: Latin America Market Volume (Metric Tons) Forecast by End Use, 2020-2035
  • Table 29: Latin America Market Value (USD Billion) Forecast by Distribution Channel, 2020-2035
  • Table 30: Latin America Market Volume (Metric Tons) Forecast by Distribution Channel, 2020-2035
  • Table 31: Western Europe Market Value (USD Billion) Forecast by Country, 2020-2035
  • Table 32: Western Europe Market Volume (Metric Tons) Forecast by Country, 2020-2035
  • Table 33: Western Europe Market Value (USD Billion) Forecast by Nature, 2020-2035
  • Table 34: Western Europe Market Volume (Metric Tons) Forecast by Nature, 2020-2035
  • Table 35: Western Europe Market Value (USD Billion) Forecast by Type, 2020-2035
  • Table 36: Western Europe Market Volume (Metric Tons) Forecast by Type, 2020-2035
  • Table 37: Western Europe Market Value (USD Billion) Forecast by End Use, 2020-2035
  • Table 38: Western Europe Market Volume (Metric Tons) Forecast by End Use, 2020-2035
  • Table 39: Western Europe Market Value (USD Billion) Forecast by Distribution Channel, 2020-2035
  • Table 40: Western Europe Market Volume (Metric Tons) Forecast by Distribution Channel, 2020-2035
  • Table 41: Eastern Europe Market Value (USD Billion) Forecast by Country, 2020-2035
  • Table 42: Eastern Europe Market Volume (Metric Tons) Forecast by Country, 2020-2035
  • Table 43: Eastern Europe Market Value (USD Billion) Forecast by Nature, 2020-2035
  • Table 44: Eastern Europe Market Volume (Metric Tons) Forecast by Nature, 2020-2035
  • Table 45: Eastern Europe Market Value (USD Billion) Forecast by Type, 2020-2035
  • Table 46: Eastern Europe Market Volume (Metric Tons) Forecast by Type, 2020-2035
  • Table 47: Eastern Europe Market Value (USD Billion) Forecast by End Use, 2020-2035
  • Table 48: Eastern Europe Market Volume (Metric Tons) Forecast by End Use, 2020-2035
  • Table 49: Eastern Europe Market Value (USD Billion) Forecast by Distribution Channel, 2020-2035
  • Table 50: Eastern Europe Market Volume (Metric Tons) Forecast by Distribution Channel, 2020-2035
  • Table 51: East Asia Market Value (USD Billion) Forecast by Country, 2020-2035
  • Table 52: East Asia Market Volume (Metric Tons) Forecast by Country, 2020-2035
  • Table 53: East Asia Market Value (USD Billion) Forecast by Nature, 2020-2035
  • Table 54: East Asia Market Volume (Metric Tons) Forecast by Nature, 2020-2035
  • Table 55: East Asia Market Value (USD Billion) Forecast by Type, 2020-2035
  • Table 56: East Asia Market Volume (Metric Tons) Forecast by Type, 2020-2035
  • Table 57: East Asia Market Value (USD Billion) Forecast by End Use, 2020-2035
  • Table 58: East Asia Market Volume (Metric Tons) Forecast by End Use, 2020-2035
  • Table 59: East Asia Market Value (USD Billion) Forecast by Distribution Channel, 2020-2035
  • Table 60: East Asia Market Volume (Metric Tons) Forecast by Distribution Channel, 2020-2035
  • Table 61: South Asia & Pacific Market Value (USD Billion) Forecast by Country, 2020-2035
  • Table 62: South Asia & Pacific Market Volume (Metric Tons) Forecast by Country, 2020-2035
  • Table 63: South Asia & Pacific Market Value (USD Billion) Forecast by Nature, 2020-2035
  • Table 64: South Asia & Pacific Market Volume (Metric Tons) Forecast by Nature, 2020-2035
  • Table 65: South Asia & Pacific Market Value (USD Billion) Forecast by Type, 2020-2035
  • Table 66: South Asia & Pacific Market Volume (Metric Tons) Forecast by Type, 2020-2035
  • Table 67: South Asia & Pacific Market Value (USD Billion) Forecast by End Use, 2020-2035
  • Table 68: South Asia & Pacific Market Volume (Metric Tons) Forecast by End Use, 2020-2035
  • Table 69: South Asia & Pacific Market Value (USD Billion) Forecast by Distribution Channel, 2020-2035
  • Table 70: South Asia & Pacific Market Volume (Metric Tons) Forecast by Distribution Channel, 2020-2035
  • Table 71: Middle East and Africa Market Value (USD Billion) Forecast by Country, 2020-2035
  • Table 72: Middle East and Africa Market Volume (Metric Tons) Forecast by Country, 2020-2035
  • Table 73: Middle East and Africa Market Value (USD Billion) Forecast by Nature, 2020-2035
  • Table 74: Middle East and Africa Market Volume (Metric Tons) Forecast by Nature, 2020-2035
  • Table 75: Middle East and Africa Market Value (USD Billion) Forecast by Type, 2020-2035
  • Table 76: Middle East and Africa Market Volume (Metric Tons) Forecast by Type, 2020-2035
  • Table 77: Middle East and Africa Market Value (USD Billion) Forecast by End Use, 2020-2035
  • Table 78: Middle East and Africa Market Volume (Metric Tons) Forecast by End Use, 2020-2035
  • Table 79: Middle East and Africa Market Value (USD Billion) Forecast by Distribution Channel, 2020-2035
  • Table 80: Middle East and Africa Market Volume (Metric Tons) Forecast by Distribution Channel, 2020-2035

List of Figures

  • Figure 1: Global Market Volume (Metric Tons) Forecast 2020-2035
  • Figure 2: Global Market Pricing Analysis
  • Figure 3: Global Market Value (USD Billion) Forecast 2020-2035
  • Figure 4: Global Market Value Share and BPS Analysis by Nature, 2025 and 2035
  • Figure 5: Global Market Y-o-Y Growth Comparison by Nature, 2025-2035
  • Figure 6: Global Market Attractiveness Analysis by Nature
  • Figure 7: Global Market Value Share and BPS Analysis by Type, 2025 and 2035
  • Figure 8: Global Market Y-o-Y Growth Comparison by Type, 2025-2035
  • Figure 9: Global Market Attractiveness Analysis by Type
  • Figure 10: Global Market Value Share and BPS Analysis by End Use, 2025 and 2035
  • Figure 11: Global Market Y-o-Y Growth Comparison by End Use, 2025-2035
  • Figure 12: Global Market Attractiveness Analysis by End Use
  • Figure 13: Global Market Value Share and BPS Analysis by Distribution Channel, 2025 and 2035
  • Figure 14: Global Market Y-o-Y Growth Comparison by Distribution Channel, 2025-2035
  • Figure 15: Global Market Attractiveness Analysis by Distribution Channel
  • Figure 16: Global Market Value (USD Billion) Share and BPS Analysis by Region, 2025 and 2035
  • Figure 17: Global Market Y-o-Y Growth Comparison by Region, 2025-2035
  • Figure 18: Global Market Attractiveness Analysis by Region
  • Figure 19: North America Market Incremental $ Opportunity, 2025-2035
  • Figure 20: Latin America Market Incremental $ Opportunity, 2025-2035
  • Figure 21: Western Europe Market Incremental $ Opportunity, 2025-2035
  • Figure 22: Eastern Europe Market Incremental $ Opportunity, 2025-2035
  • Figure 23: East Asia Market Incremental $ Opportunity, 2025-2035
  • Figure 24: South Asia & Pacific Market Incremental $ Opportunity, 2025-2035
  • Figure 25: Middle East and Africa Market Incremental $ Opportunity, 2025-2035
  • Figure 26: North America Market Value Share and BPS Analysis by Country, 2025 and 2035
  • Figure 27: North America Market Value Share and BPS Analysis by Nature, 2025 and 2035
  • Figure 28: North America Market Y-o-Y Growth Comparison by Nature, 2025-2035
  • Figure 29: North America Market Attractiveness Analysis by Nature
  • Figure 30: North America Market Value Share and BPS Analysis by Type, 2025 and 2035
  • Figure 31: North America Market Y-o-Y Growth Comparison by Type, 2025-2035
  • Figure 32: North America Market Attractiveness Analysis by Type
  • Figure 33: North America Market Value Share and BPS Analysis by End Use, 2025 and 2035
  • Figure 34: North America Market Y-o-Y Growth Comparison by End Use, 2025-2035
  • Figure 35: North America Market Attractiveness Analysis by End Use
  • Figure 36: North America Market Value Share and BPS Analysis by Distribution Channel, 2025 and 2035
  • Figure 37: North America Market Y-o-Y Growth Comparison by Distribution Channel, 2025-2035
  • Figure 38: North America Market Attractiveness Analysis by Distribution Channel
  • Figure 39: Latin America Market Value Share and BPS Analysis by Country, 2025 and 2035
  • Figure 40: Latin America Market Value Share and BPS Analysis by Nature, 2025 and 2035
  • Figure 41: Latin America Market Y-o-Y Growth Comparison by Nature, 2025-2035
  • Figure 42: Latin America Market Attractiveness Analysis by Nature
  • Figure 43: Latin America Market Value Share and BPS Analysis by Type, 2025 and 2035
  • Figure 44: Latin America Market Y-o-Y Growth Comparison by Type, 2025-2035
  • Figure 45: Latin America Market Attractiveness Analysis by Type
  • Figure 46: Latin America Market Value Share and BPS Analysis by End Use, 2025 and 2035
  • Figure 47: Latin America Market Y-o-Y Growth Comparison by End Use, 2025-2035
  • Figure 48: Latin America Market Attractiveness Analysis by End Use
  • Figure 49: Latin America Market Value Share and BPS Analysis by Distribution Channel, 2025 and 2035
  • Figure 50: Latin America Market Y-o-Y Growth Comparison by Distribution Channel, 2025-2035
  • Figure 51: Latin America Market Attractiveness Analysis by Distribution Channel
  • Figure 52: Western Europe Market Value Share and BPS Analysis by Country, 2025 and 2035
  • Figure 53: Western Europe Market Value Share and BPS Analysis by Nature, 2025 and 2035
  • Figure 54: Western Europe Market Y-o-Y Growth Comparison by Nature, 2025-2035
  • Figure 55: Western Europe Market Attractiveness Analysis by Nature
  • Figure 56: Western Europe Market Value Share and BPS Analysis by Type, 2025 and 2035
  • Figure 57: Western Europe Market Y-o-Y Growth Comparison by Type, 2025-2035
  • Figure 58: Western Europe Market Attractiveness Analysis by Type
  • Figure 59: Western Europe Market Value Share and BPS Analysis by End Use, 2025 and 2035
  • Figure 60: Western Europe Market Y-o-Y Growth Comparison by End Use, 2025-2035
  • Figure 61: Western Europe Market Attractiveness Analysis by End Use
  • Figure 62: Western Europe Market Value Share and BPS Analysis by Distribution Channel, 2025 and 2035
  • Figure 63: Western Europe Market Y-o-Y Growth Comparison by Distribution Channel, 2025-2035
  • Figure 64: Western Europe Market Attractiveness Analysis by Distribution Channel
  • Figure 65: Eastern Europe Market Value Share and BPS Analysis by Country, 2025 and 2035
  • Figure 66: Eastern Europe Market Value Share and BPS Analysis by Nature, 2025 and 2035
  • Figure 67: Eastern Europe Market Y-o-Y Growth Comparison by Nature, 2025-2035
  • Figure 68: Eastern Europe Market Attractiveness Analysis by Nature
  • Figure 69: Eastern Europe Market Value Share and BPS Analysis by Type, 2025 and 2035
  • Figure 70: Eastern Europe Market Y-o-Y Growth Comparison by Type, 2025-2035
  • Figure 71: Eastern Europe Market Attractiveness Analysis by Type
  • Figure 72: Eastern Europe Market Value Share and BPS Analysis by End Use, 2025 and 2035
  • Figure 73: Eastern Europe Market Y-o-Y Growth Comparison by End Use, 2025-2035
  • Figure 74: Eastern Europe Market Attractiveness Analysis by End Use
  • Figure 75: Eastern Europe Market Value Share and BPS Analysis by Distribution Channel, 2025 and 2035
  • Figure 76: Eastern Europe Market Y-o-Y Growth Comparison by Distribution Channel, 2025-2035
  • Figure 77: Eastern Europe Market Attractiveness Analysis by Distribution Channel
  • Figure 78: East Asia Market Value Share and BPS Analysis by Country, 2025 and 2035
  • Figure 79: East Asia Market Value Share and BPS Analysis by Nature, 2025 and 2035
  • Figure 80: East Asia Market Y-o-Y Growth Comparison by Nature, 2025-2035
  • Figure 81: East Asia Market Attractiveness Analysis by Nature
  • Figure 82: East Asia Market Value Share and BPS Analysis by Type, 2025 and 2035
  • Figure 83: East Asia Market Y-o-Y Growth Comparison by Type, 2025-2035
  • Figure 84: East Asia Market Attractiveness Analysis by Type
  • Figure 85: East Asia Market Value Share and BPS Analysis by End Use, 2025 and 2035
  • Figure 86: East Asia Market Y-o-Y Growth Comparison by End Use, 2025-2035
  • Figure 87: East Asia Market Attractiveness Analysis by End Use
  • Figure 88: East Asia Market Value Share and BPS Analysis by Distribution Channel, 2025 and 2035
  • Figure 89: East Asia Market Y-o-Y Growth Comparison by Distribution Channel, 2025-2035
  • Figure 90: East Asia Market Attractiveness Analysis by Distribution Channel
  • Figure 91: South Asia & Pacific Market Value Share and BPS Analysis by Country, 2025 and 2035
  • Figure 92: South Asia & Pacific Market Value Share and BPS Analysis by Nature, 2025 and 2035
  • Figure 93: South Asia & Pacific Market Y-o-Y Growth Comparison by Nature, 2025-2035
  • Figure 94: South Asia & Pacific Market Attractiveness Analysis by Nature
  • Figure 95: South Asia & Pacific Market Value Share and BPS Analysis by Type, 2025 and 2035
  • Figure 96: South Asia & Pacific Market Y-o-Y Growth Comparison by Type, 2025-2035
  • Figure 97: South Asia & Pacific Market Attractiveness Analysis by Type
  • Figure 98: South Asia & Pacific Market Value Share and BPS Analysis by End Use, 2025 and 2035
  • Figure 99: South Asia & Pacific Market Y-o-Y Growth Comparison by End Use, 2025-2035
  • Figure 100: South Asia & Pacific Market Attractiveness Analysis by End Use
  • Figure 101: South Asia & Pacific Market Value Share and BPS Analysis by Distribution Channel, 2025 and 2035
  • Figure 102: South Asia & Pacific Market Y-o-Y Growth Comparison by Distribution Channel, 2025-2035
  • Figure 103: South Asia & Pacific Market Attractiveness Analysis by Distribution Channel
  • Figure 104: Middle East and Africa Market Value Share and BPS Analysis by Country, 2025 and 2035
  • Figure 105: Middle East and Africa Market Value Share and BPS Analysis by Nature, 2025 and 2035
  • Figure 106: Middle East and Africa Market Y-o-Y Growth Comparison by Nature, 2025-2035
  • Figure 107: Middle East and Africa Market Attractiveness Analysis by Nature
  • Figure 108: Middle East and Africa Market Value Share and BPS Analysis by Type, 2025 and 2035
  • Figure 109: Middle East and Africa Market Y-o-Y Growth Comparison by Type, 2025-2035
  • Figure 110: Middle East and Africa Market Attractiveness Analysis by Type
  • Figure 111: Middle East and Africa Market Value Share and BPS Analysis by End Use, 2025 and 2035
  • Figure 112: Middle East and Africa Market Y-o-Y Growth Comparison by End Use, 2025-2035
  • Figure 113: Middle East and Africa Market Attractiveness Analysis by End Use
  • Figure 114: Middle East and Africa Market Value Share and BPS Analysis by Distribution Channel, 2025 and 2035
  • Figure 115: Middle East and Africa Market Y-o-Y Growth Comparison by Distribution Channel, 2025-2035
  • Figure 116: Middle East and Africa Market Attractiveness Analysis by Distribution Channel
  • Figure 117: Global Market - Tier Structure Analysis
  • Figure 118: Global Market - Company Share Analysis

Frequently Asked Questions

What is the projected size of the specialty food ingredients market in 2025?

The market is valued at USD 97.3 billion in 2025.

What is the forecasted market value of the specialty food ingredients market by 2035?

The market is projected to reach USD 155.5 billion by 2035.

What is the outlook on specialty food ingredients demand by 2035?

The market is forecasted to reach USD 155.5 billion by 2035, reflecting a CAGR of 4.8%.

Which segment leads the specialty food ingredients market by type in 2025?

Enzymes will lead the type segment, accounting for 32.1% of the global market share in 2025.

What is the top growth country for the specialty food ingredients market in 2025?

Germany is projected to grow at the fastest rate, with a CAGR of 13.4% from 2025 to 2035.

Explore Similar Insights

Future Market Insights

Specialty Food Ingredients Market