Disodium Adenosine Triphosphate Market
Market Insights on Disodium Adenosine Triphosphate covering sales outlook, demand forecast & up-to-date key trends
Disodium Adenosine Triphosphate Market by Product, Capacity, Application, Distribution Channel & Region - Forecast 2022 - 2032
Disodium Adenosine Triphosphate Market Outlook (2022-2032)
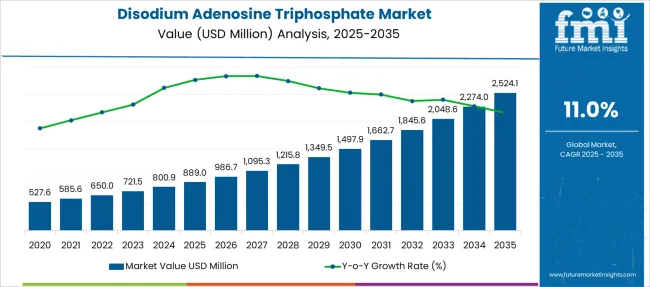
[250 Pages Report] The disodium adenosine triphosphate market is anticipated to secure a CAGR of 11% during the forecast period.
The increasing demand for disodium adenosine triphosphate in various applications, as well as increased knowledge about the benefits of employing disodium adenosine triphosphate, are driving the growth of the disodium adenosine triphosphate market. In addition, the growing use of disodium adenosine triphosphate in personal care and cosmetic items is fuelling the market's expansion.
Attributes |
Details |
Disodium Adenosine Triphosphate Market CAGR |
11% |
Disodium Adenosine Triphosphate Market Value (2022) |
US$ 650 Mn |
Sales of disodium adenosine triphosphate are expected to rise as premature ageing is a widespread skin problem among young people all over the world, and treatments like disodium adenosine triphosphate are becoming increasingly popular in the cosmetic sector.
Increasing pollution is also projected to contribute to the growth of the disodium adenosine triphosphate market share.
The report sheds light on the factors improving the sales of disodium adenosine triphosphate, and, in turn, the opportunities for the market players. However, the disodium adenosine triphosphate market also faces some challenges, which might limit the disodium adenosine triphosphate market share from reaching its potential.
Some of the key disodium adenosine triphosphate market trends indicate that the market has grown as people have become more aware of the items that contain disodium adenosine triphosphate as an ingredient. Manufacturers are expected to place a greater emphasis on product promotion and marketing techniques, with disodium adenosine triphosphate as a significant element. Disodium adenosine triphosphate suppliers are expected to join or partner with top beauty brands to generate more formulations that understand and meet the needs of regional consumers.
Let us know your requirement to get
100% FREE customization
What are the Key Drivers to the Disodium Adenosine Triphosphate Market Share
Disodium adenosine triphosphate is a chemical that is present in the cells of the human body. Disodium adenosine triphosphate has characteristics such as anti-aging, anti-pollution, conditioning, restructuring and replenishing, and moisturizing. These properties have forced the manufacturers of the cosmetic industry to formulate and develop products that include disodium adenosine triphosphate as a critical ingredient. The disodium adenosine triphosphate has the potential to be the key ingredient of many cosmetic products and now has created numerous applications. The sales of disodium adenosine triphosphate are expected to grow in the forecasted period.
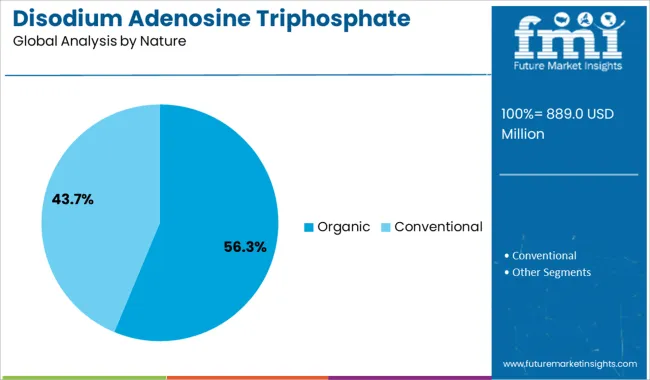
There is an increase in demand for organic cosmetics products by the users due to increased health concerns and awareness about its benefits. The demand for disodium adenosine triphosphate from a natural source is anticipated to drive the forecasted period’s market. The availability of disodium adenosine phosphate in powder, as well as liquid form, makes it easy to use for beauty brands and R&D new applications. Manufacturers are estimated to develop products that offer advantages of both anti-pollution, anti-aging, and de-tan features and include disodium adenosine triphosphate as a critical ingredient.
Increased pollution is the primary driver for the rise in demand for disodium adenosine triphosphate. It has increased the demand from cosmetic makers, which are now focused on formulating new products to increase their sales and fulfill the customer’s needs. Premature aging is one of the common skin issues faced by the young population all over the world, and products, including disodium adenosine triphosphate, are trending in the cosmetic industry.
Increased awareness among the population about the products that contain disodium adenosine triphosphate as an ingredient has fuelled the sales of disodium adenosine triphosphate. Manufacturers are estimated to focus more on promotional and marketing strategies for products, including disodium adenosine triphosphate as a key ingredient. The suppliers of disodium adenosine triphosphate are estimated to merge or collaborate with leading beauty brands to develop more formulations that understand and fulfill the regional demand for disodium adenosine triphosphate. Many businesses to business opportunities are anticipated to boom in the sales of disodium adenosine triphosphate.
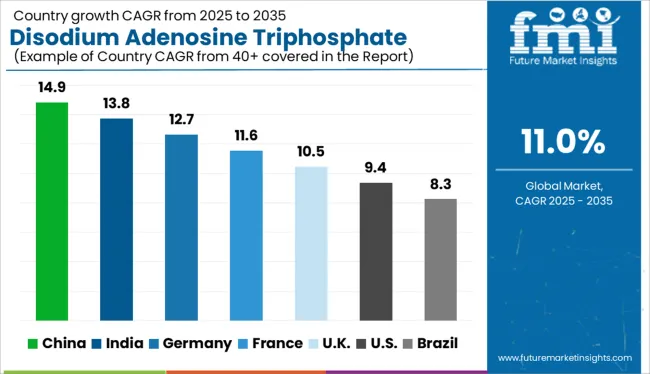
Which is the Leading Region in the Disodium Adenosine Triphosphate Market
The study on the disodium adenosine triphosphate market regionally is categorized into North America, Latin America, Europe, East Asia, South Asia, Oceania, and the Middle East and Africa (MEA). Regionally, East Asia and Europe are estimated to have prominent demand for disodium adenosine triphosphate, owing to product formulations by various beauty brands. Followed by North America, the sales of disodium adenosine triphosphate are expected to have a high growth due to the high demand for anti-aging products.
The high disposable income of the consumers in Oceania and the Middle East and Africa (MEA) is estimated to fuel the sales of disodium adenosine triphosphate. The increasing population in South Asia has increased the demand for cosmetics, and hence, the demand for disodium adenosine triphosphate is anticipated to grow. Moreover, a significant disodium adenosine triphosphate product market share is expected from the developing countries, boosting the overall market growth.
Find your sweet spots for generating winning opportunities in this market.
Talk to AnalystWho are the Key Players in the Disodium Adenosine Triphosphate Market
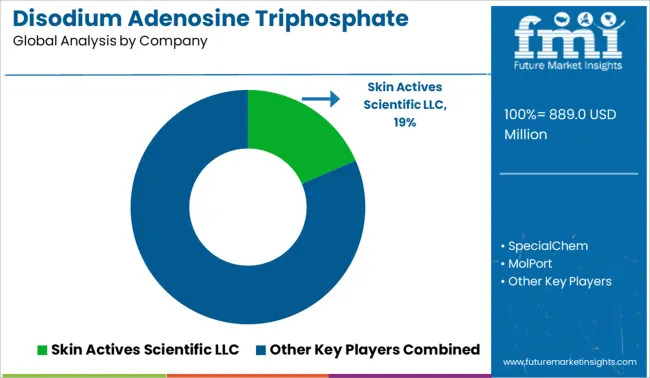
Some of the major players in the disodium adenosine triphosphate market are Skin Actives Scientific LLC, SpecialChem, MolPort, Key Organics, TCI America, Chemyunion Inc., Shenzhen BST Science & Technology Co., Ltd, Parchem fine & specialty chemicals, Spectrum Chemical Mfg Corp., Enzo Life Sciences, BeanTown Chemical, Acros Organics MS, Cayman Chemical, and among others.
These key market players are estimated to enhance the sales of disodium adenosine triphosphate with innovative product formulations. Also, these market players are expected to penetrate into new regions and increase the opportunities and demand for disodium adenosine triphosphate.
The report consists of key players contributing to the disodium adenosine triphosphate market share. It also consists of organic and inorganic growth strategies adopted by market players to improve their market positions. This exclusive report analyzes the competitive landscape and disodium adenosine triphosphate market share acquired by players to strengthen their market position.
Report Scope
Report Attribute |
Details |
Base year for estimation |
2021 |
Historical data |
2015 - 2020 |
Forecast period |
2022 - 2032 |
Quantitative units |
Revenue in USD Million, volume in kilotons, and CAGR from 2022 to 2032 |
Report coverage |
Revenue forecast, volume forecast, company ranking, competitive landscape, growth factors, and trends, Pricing Analysis |
Segments covered |
Product, application, sales channel, region |
Regional scope |
North America; Western Europe, Eastern Europe, Middle East, Africa, ASEAN, South Asia, Rest of Asia, Australia and New Zealand |
Country scope |
U.S.; Canada; Mexico; Germany; U.K.; France; Italy; Spain; Russia; Belgium; Poland; Czech Republic; China; India; Japan; Australia; Brazil; Argentina; Colombia; Saudi Arabia; UAE; Iran; South Africa |
Key companies profiled |
Skin Actives Scientific LLC, SpecialChem, MolPort, Key Organics, TCI America, Chemyunion Inc., Shenzhen BST Science & Technology Co., Ltd, Parchem fine & specialty chemicals, Spectrum Chemical Mfg Corp., Enzo Life Sciences, BeanTown Chemical, Acros Organics MS, Cayman Chemical |
Customization scope |
Free report customization (equivalent to up to 8 analysts working days) with purchase. Addition or alteration to country, regional & segment scope. |
Pricing and purchase options |
Avail customized purchase options to meet your exact research needs. |

An unified Market Research Subscription Platform, built for today’s disparate research needs.
Frequently Asked Questions
Key players holding substantial disodium adenosine triphosphate market share include Skin Actives Scientific LLC, SpecialChem, MolPort, Key Organics, TCI America, Chemyunion Inc., Shenzhen BST Science & Technology Co., Ltd, Parchem fine & specialty chemicals, Spectrum Chemical Mfg Corp., Enzo Life Sciences, BeanTown Chemical, Acros Organics MS, Cayman Chemical, and among others.
Demand for disodium adenosine triphosphate is likely to rise on the back of increasing awareness on the applications of disodium adenosine triphosphate.
North America is expected to have a high growth in the disodium adenosine triphosphate market.
1. Executive Summary
1.1. Global Market Outlook
1.2. Demand-side Trends
1.3. Supply-side Trends
1.4. Technology Roadmap Analysis
1.5. Analysis and Recommendations
2. Market Overview
2.1. Market Coverage / Taxonomy
2.2. Market Definition / Scope / Limitations
3. Market Background
3.1. Market Dynamics
3.1.1. Drivers
3.1.2. Restraints
3.1.3. Opportunity
3.1.4. Trends
3.2. Scenario Forecast
3.2.1. Demand in Optimistic Scenario
3.2.2. Demand in Likely Scenario
3.2.3. Demand in Conservative Scenario
3.3. Opportunity Map Analysis
3.4. Investment Feasibility Matrix
3.5. PESTLE and Porter’s Analysis
3.6. Regulatory Landscape
3.6.1. By Key Regions
3.6.2. By Key Countries
4. Global Disodium Adenosine Triphosphate Market Analysis 2017-2021 and Forecast, 2022-2032
4.1. Historical Market Size Value (US$ Mn) & Volume(Units) Analysis, 2017-2021
4.2. Current and Future Market Size Value (US$ Mn) & Volume(Units) Projections, 2022-2032
4.2.1. Y-o-Y Growth Trend Analysis
4.2.2. Absolute $ Opportunity Analysis
5. Global Disodium Adenosine Triphosphate Market Analysis 2017-2021 and Forecast 2022-2032, By Application
5.1. Introduction / Key Findings
5.2. Historical Market Size Value (US$ Mn) & Volume(Units) Analysis By Application, 2017-2021
5.3. Current and Future Market Size Value (US$ Mn) & Volume(Units) Analysis and Forecast By Application, 2022-2032
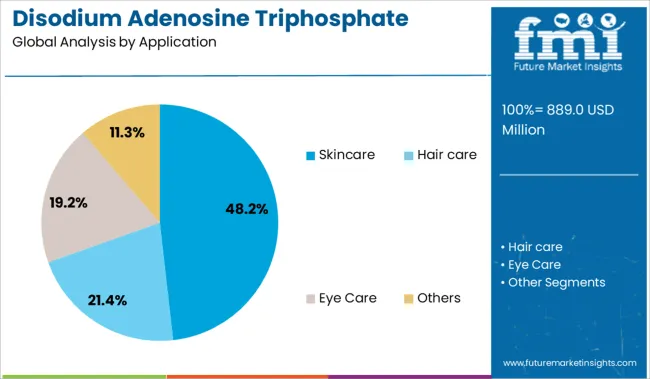
5.3.1. Skin care
5.3.2. Hair care
5.3.3. Eye Care
5.3.4. Others
5.4. Y-o-Y Growth Trend Analysis By Application, 2017-2021
5.5. Absolute $ Opportunity Analysis By Application, 2022-2032
6. Global Disodium Adenosine Triphosphate Market Analysis 2017-2021 and Forecast 2022-2032, By End Use
6.1. Introduction / Key Findings
6.2. Historical Market Size Value (US$ Mn) & Volume(Units) Analysis By End Use, 2017-2021
6.3. Current and Future Market Size Value (US$ Mn) & Volume(Units) Analysis and Forecast By End Use, 2022-2032
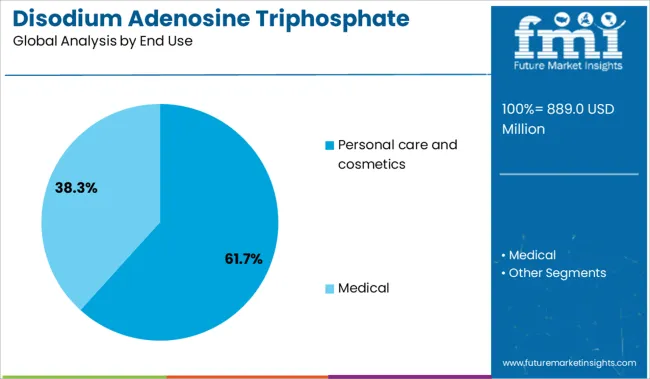
6.3.1. Personal care and cosmetics
6.3.2. Medical
6.4. Y-o-Y Growth Trend Analysis By End Use, 2017-2021
6.5. Absolute $ Opportunity Analysis By End Use, 2022-2032
7. Global Disodium Adenosine Triphosphate Market Analysis 2017-2021 and Forecast 2022-2032, By Nature
7.1. Introduction / Key Findings
7.2. Historical Market Size Value (US$ Mn) & Volume(Units) Analysis By Nature, 2017-2021
7.3. Current and Future Market Size Value (US$ Mn) & Volume(Units) Analysis and Forecast By Nature, 2022-2032
7.3.1. Organic
7.3.2. Conventional
7.4. Y-o-Y Growth Trend Analysis By Nature, 2017-2021
7.5. Absolute $ Opportunity Analysis By Nature, 2022-2032
8. Global Disodium Adenosine Triphosphate Market Analysis 2017-2021 and Forecast 2022-2032, By Form
8.1. Introduction / Key Findings
8.2. Historical Market Size Value (US$ Mn) & Volume(Units) Analysis By Form, 2017-2021
8.3. Current and Future Market Size Value (US$ Mn) & Volume(Units) Analysis and Forecast By Form, 2022-2032
8.3.1. Powder
8.3.2. Liquid
8.4. Y-o-Y Growth Trend Analysis By Form, 2017-2021
8.5. Absolute $ Opportunity Analysis By Form, 2022-2032
9. Global Disodium Adenosine Triphosphate Market Analysis 2017-2021 and Forecast 2022-2032, By Sales Channel
9.1. Introduction / Key Findings
9.2. Historical Market Size Value (US$ Mn) & Volume(Units) Analysis By Sales Channel , 2017-2021
9.3. Current and Future Market Size Value (US$ Mn) & Volume(Units) Analysis and Forecast By Sales Channel , 2022-2032
9.3.1. Direct
9.3.2. Indirect
9.4. Y-o-Y Growth Trend Analysis By Sales Channel , 2017-2021
9.5. Absolute $ Opportunity Analysis By Sales Channel , 2022-2032
10. Global Disodium Adenosine Triphosphate Market Analysis 2017-2021 and Forecast 2022-2032, By Region
10.1. Introduction
10.2. Historical Market Size Value (US$ Mn) & Volume(Units) Analysis By Region, 2017-2021
10.3. Current Market Size Value (US$ Mn) & Volume(Units) Analysis and Forecast By Region, 2022-2032
10.3.1. North America
10.3.2. Latin America
10.3.3. Europe
10.3.4. East Asia
10.3.5. South Asia
10.3.6. Oceania
10.3.7. MEA
10.4. Market Attractiveness Analysis By Region
11. North America Disodium Adenosine Triphosphate Market Analysis 2017-2021 and Forecast 2022-2032, By Country
11.1. Historical Market Size Value (US$ Mn) & Volume(Units) Trend Analysis By Market Taxonomy, 2017-2021
11.2. Market Size Value (US$ Mn) & Volume(Units) Forecast By Market Taxonomy, 2022-2032
11.2.1. By Country
11.2.1.1. U.S.
11.2.1.2. Canada
11.2.2. By Application
11.2.3. By End Use
11.2.4. By Nature
11.2.5. By Form
11.2.6. By Sales Channel
11.3. Market Attractiveness Analysis
11.3.1. By Country
11.3.2. By Application
11.3.3. By End Use
11.3.4. By Nature
11.3.5. By Form
11.3.6. By Sales Channel
11.4. Key Takeaways
12. Latin America Disodium Adenosine Triphosphate Market Analysis 2017-2021 and Forecast 2022-2032, By Country
12.1. Historical Market Size Value (US$ Mn) & Volume(Units) Trend Analysis By Market Taxonomy, 2017-2021
12.2. Market Size Value (US$ Mn) & Volume(Units) Forecast By Market Taxonomy, 2022-2032
12.2.1. By Country
12.2.1.1. Brazil
12.2.1.2. Mexico
12.2.1.3. Rest of Latin America
12.2.2. By Application
12.2.3. By End Use
12.2.4. By Nature
12.2.5. By Form
12.2.6. By Sales Channel
12.3. Market Attractiveness Analysis
12.3.1. By Country
12.3.2. By Application
12.3.3. By End Use
12.3.4. By Nature
12.3.5. By Form
12.3.6. By Sales Channel
12.4. Key Takeaways
13. Europe Disodium Adenosine Triphosphate Market Analysis 2017-2021 and Forecast 2022-2032, By Country
13.1. Historical Market Size Value (US$ Mn) & Volume(Units) Trend Analysis By Market Taxonomy, 2017-2021
13.2. Market Size Value (US$ Mn) & Volume(Units) Forecast By Market Taxonomy, 2022-2032
13.2.1. By Country
13.2.1.1. Germany
13.2.1.2. Italy
13.2.1.3. France
13.2.1.4. U.K.
13.2.1.5. Spain
13.2.1.6. Russia
13.2.1.7. BENELUX
13.2.1.8. Rest of Europe
13.2.2. By Application
13.2.3. By End Use
13.2.4. By Nature
13.2.5. By Form
13.2.6. By Sales Channel
13.3. Market Attractiveness Analysis
13.3.1. By Country
13.3.2. By Application
13.3.3. By End Use
13.3.4. By Nature
13.3.5. By Form
13.3.6. By Sales Channel
13.4. Key Takeaways
14. East Asia Disodium Adenosine Triphosphate Market Analysis 2017-2021 and Forecast 2022-2032, By Country
14.1. Historical Market Size Value (US$ Mn) & Volume(Units) Trend Analysis By Market Taxonomy, 2017-2021
14.2. Market Size Value (US$ Mn) & Volume(Units) Forecast By Market Taxonomy, 2022-2032
14.2.1. By Country
14.2.1.1. China
14.2.1.2. Japan
14.2.1.3. South Korea
14.2.2. By Application
14.2.3. By End Use
14.2.4. By Nature
14.2.5. By Form
14.2.6. By Sales Channel
14.3. Market Attractiveness Analysis
14.3.1. By Country
14.3.2. By Application
14.3.3. By End Use
14.3.4. By Nature
14.3.5. By Form
14.3.6. By Sales Channel
14.4. Key Takeaways
15. South Asia Disodium Adenosine Triphosphate Market Analysis 2017-2021 and Forecast 2022-2032, By Country
15.1. Historical Market Size Value (US$ Mn) & Volume(Units) Trend Analysis By Market Taxonomy, 2017-2021
15.2. Market Size Value (US$ Mn) & Volume(Units) Forecast By Market Taxonomy, 2022-2032
15.2.1. By Country
15.2.1.1. India
15.2.1.2. Thailand
15.2.1.3. Malaysia
15.2.1.4. Indonesia
15.2.1.5. Rest of South Asia
15.2.2. By Application
15.2.3. By End Use
15.2.4. By Nature
15.2.5. By Form
15.2.6. By Sales Channel
15.3. Market Attractiveness Analysis
15.3.1. By Country
15.3.2. By Application
15.3.3. By End Use
15.3.4. By Nature
15.3.5. By Form
15.3.6. By Sales Channel
15.4. Key Takeaways
16. Oceania Disodium Adenosine Triphosphate Market Analysis 2017-2021 and Forecast 2022-2032, By Country
16.1. Historical Market Size Value (US$ Mn) & Volume(Units) Trend Analysis By Market Taxonomy, 2017-2021
16.2. Market Size Value (US$ Mn) & Volume(Units) Forecast By Market Taxonomy, 2022-2032
16.2.1. By Country
16.2.1.1. Australia
16.2.1.2. New Zealand
16.2.2. By Application
16.2.3. By End Use
16.2.4. By Nature
16.2.5. By Form
16.2.6. By Sales Channel
16.3. Market Attractiveness Analysis
16.3.1. By Country
16.3.2. By Application
16.3.3. By End Use
16.3.4. By Nature
16.3.5. By Form
16.3.6. By Sales Channel
16.4. Key Takeaways
17. MEA Disodium Adenosine Triphosphate Market Analysis 2017-2021 and Forecast 2022-2032, By Country
17.1. Historical Market Size Value (US$ Mn) & Volume(Units) Trend Analysis By Market Taxonomy, 2017-2021
17.2. Market Size Value (US$ Mn) & Volume(Units) Forecast By Market Taxonomy, 2022-2032
17.2.1. By Country
17.2.1.1. GCC Countries
17.2.1.2. Turkey
17.2.1.3. Israel
17.2.1.4. South Africa
17.2.1.5. Egypt
17.2.1.6. Rest of MEA
17.2.2. By Application
17.2.3. By End Use
17.2.4. By Nature
17.2.5. By Form
17.2.6. By Sales Channel
17.3. Market Attractiveness Analysis
17.3.1. By Country
17.3.2. By Application
17.3.3. By End Use
17.3.4. By Nature
17.3.5. By Form
17.3.6. By Sales Channel
17.4. Key Takeaways
18. Key Countries Disodium Adenosine Triphosphate Market Analysis
18.1. U.S.
18.1.1. Pricing Analysis
18.1.2. Market Share Analysis, 2021
18.1.2.1. By Application
18.1.2.2. By End Use
18.1.2.3. By Nature
18.1.2.4. By Form
18.1.2.5. By Sales Channel
18.2. Canada
18.2.1. Pricing Analysis
18.2.2. Market Share Analysis, 2021
18.2.2.1. By Application
18.2.2.2. By End Use
18.2.2.3. By Nature
18.2.2.4. By Form
18.2.2.5. By Sales Channel
18.3. Brazil
18.3.1. Pricing Analysis
18.3.2. Market Share Analysis, 2021
18.3.2.1. By Application
18.3.2.2. By End Use
18.3.2.3. By Nature
18.3.2.4. By Form
18.3.2.5. By Sales Channel
18.4. Mexico
18.4.1. Pricing Analysis
18.4.2. Market Share Analysis, 2021
18.4.2.1. By Application
18.4.2.2. By End Use
18.4.2.3. By Nature
18.4.2.4. By Form
18.4.2.5. By Sales Channel
18.5. Argentina
18.5.1. Pricing Analysis
18.5.2. Market Share Analysis, 2021
18.5.2.1. By Application
18.5.2.2. By End Use
18.5.2.3. By Nature
18.5.2.4. By Form
18.5.2.5. By Sales Channel
18.6. Germany
18.6.1. Pricing Analysis
18.6.2. Market Share Analysis, 2021
18.6.2.1. By Application
18.6.2.2. By End Use
18.6.2.3. By Nature
18.6.2.4. By Form
18.6.2.5. By Sales Channel
18.7. Italy
18.7.1. Pricing Analysis
18.7.2. Market Share Analysis, 2021
18.7.2.1. By Application
18.7.2.2. By End Use
18.7.2.3. By Nature
18.7.2.4. By Form
18.7.2.5. By Sales Channel
18.8. France
18.8.1. Pricing Analysis
18.8.2. Market Share Analysis, 2021
18.8.2.1. By Application
18.8.2.2. By End Use
18.8.2.3. By Nature
18.8.2.4. By Form
18.8.2.5. By Sales Channel
18.9. U.K.
18.9.1. Pricing Analysis
18.9.2. Market Share Analysis, 2021
18.9.2.1. By Application
18.9.2.2. By End Use
18.9.2.3. By Nature
18.9.2.4. By Form
18.9.2.5. By Sales Channel
18.10. Spain
18.10.1. Pricing Analysis
18.10.2. Market Share Analysis, 2021
18.10.2.1. By Application
18.10.2.2. By End Use
18.10.2.3. By Nature
18.10.2.4. By Form
18.10.2.5. By Sales Channel
18.11. Russia
18.11.1. Pricing Analysis
18.11.2. Market Share Analysis, 2021
18.11.2.1. By Application
18.11.2.2. By End Use
18.11.2.3. By Nature
18.11.2.4. By Form
18.11.2.5. By Sales Channel
18.12. BENELUX
18.12.1. Pricing Analysis
18.12.2. Market Share Analysis, 2021
18.12.2.1. By Application
18.12.2.2. By End Use
18.12.2.3. By Nature
18.12.2.4. By Form
18.12.2.5. By Sales Channel
18.13. China
18.13.1. Pricing Analysis
18.13.2. Market Share Analysis, 2021
18.13.2.1. By Application
18.13.2.2. By End Use
18.13.2.3. By Nature
18.13.2.4. By Form
18.13.2.5. By Sales Channel
18.14. Japan
18.14.1. Pricing Analysis
18.14.2. Market Share Analysis, 2021
18.14.2.1. By Application
18.14.2.2. By End Use
18.14.2.3. By Nature
18.14.2.4. By Form
18.14.2.5. By Sales Channel
18.15. South Korea
18.15.1. Pricing Analysis
18.15.2. Market Share Analysis, 2021
18.15.2.1. By Application
18.15.2.2. By End Use
18.15.2.3. By Nature
18.15.2.4. By Form
18.15.2.5. By Sales Channel
18.16. India
18.16.1. Pricing Analysis
18.16.2. Market Share Analysis, 2021
18.16.2.1. By Application
18.16.2.2. By End Use
18.16.2.3. By Nature
18.16.2.4. By Form
18.16.2.5. By Sales Channel
18.17. GCC Countries
18.17.1. Pricing Analysis
18.17.2. Market Share Analysis, 2021
18.17.2.1. By Application
18.17.2.2. By End Use
18.17.2.3. By Nature
18.17.2.4. By Form
18.17.2.5. By Sales Channel
18.18. Turkey
18.18.1. Pricing Analysis
18.18.2. Market Share Analysis, 2021
18.18.2.1. By Application
18.18.2.2. By End Use
18.18.2.3. By Nature
18.18.2.4. By Form
18.18.2.5. By Sales Channel
18.19. Israel
18.19.1. Pricing Analysis
18.19.2. Market Share Analysis, 2021
18.19.2.1. By Application
18.19.2.2. By End Use
18.19.2.3. By Nature
18.19.2.4. By Form
18.19.2.5. By Sales Channel
18.20. South Africa
18.20.1. Pricing Analysis
18.20.2. Market Share Analysis, 2021
18.20.2.1. By Application
18.20.2.2. By End Use
18.20.2.3. By Nature
18.20.2.4. By Form
18.20.2.5. By Sales Channel
18.21. Egypt
18.21.1. Pricing Analysis
18.21.2. Market Share Analysis, 2021
18.21.2.1. By Application
18.21.2.2. By End Use
18.21.2.3. By Nature
18.21.2.4. By Form
18.21.2.5. By Sales Channel
19. Market Structure Analysis
19.1. Competition Dashboard
19.2. Competition Benchmarking
19.3. Market Share Analysis of Top Players
19.3.1. By Regional
19.3.2. By Application
19.3.3. By End Use
19.3.4. By Nature
19.3.5. By Form
19.3.6. By Sales Channel
20. Competition Analysis
20.1. Competition Deep Dive
20.1.1. Skin Actives Scientific LLC,
20.1.1.1. Overview
20.1.1.2. Product Portfolio
20.1.1.3. Profitability by Market Segment
20.1.1.4. Sales Footprint
20.1.1.5. Strategy Overview
20.1.1.5.1. Marketing Strategy
20.1.1.5.2. Product Strategy
20.1.2. SpecialChem
20.1.2.1. Overview
20.1.2.2. Product Portfolio
20.1.2.3. Profitability by Market Segment
20.1.2.4. Sales Footprint
20.1.2.5. Strategy Overview
20.1.2.5.1. Marketing Strategy
20.1.2.5.2. Product Strategy
20.1.3. MolPort
20.1.3.1. Overview
20.1.3.2. Product Portfolio
20.1.3.3. Profitability by Market Segment
20.1.3.4. Sales Footprint
20.1.3.5. Strategy Overview
20.1.3.5.1. Marketing Strategy
20.1.3.5.2. Product Strategy
20.1.4. Key Organics
20.1.4.1. Overview
20.1.4.2. Product Portfolio
20.1.4.3. Profitability by Market Segment
20.1.4.4. Sales Footprint
20.1.4.5. Strategy Overview
20.1.4.5.1. Marketing Strategy
20.1.4.5.2. Product Strategy
20.1.5. TCI America
20.1.5.1. Overview
20.1.5.2. Product Portfolio
20.1.5.3. Profitability by Market Segment
20.1.5.4. Sales Footprint
20.1.5.5. Strategy Overview
20.1.5.5.1. Marketing Strategy
20.1.5.5.2. Product Strategy
20.1.6. Chemyunion Inc.
20.1.6.1. Overview
20.1.6.2. Product Portfolio
20.1.6.3. Profitability by Market Segment
20.1.6.4. Sales Footprint
20.1.6.5. Strategy Overview
20.1.6.5.1. Marketing Strategy
20.1.6.5.2. Product Strategy
20.1.7. Shenzhen BST Science & Technology Co.
20.1.7.1. Overview
20.1.7.2. Product Portfolio
20.1.7.3. Profitability by Market Segment
20.1.7.4. Sales Footprint
20.1.7.5. Strategy Overview
20.1.7.5.1. Marketing Strategy
20.1.7.5.2. Product Strategy
20.1.8. Parchem fine & specialty chemicals
20.1.8.1. Overview
20.1.8.2. Product Portfolio
20.1.8.3. Profitability by Market Segment
20.1.8.4. Sales Footprint
20.1.8.5. Strategy Overview
20.1.8.5.1. Marketing Strategy
20.1.8.5.2. Product Strategy
20.1.9. Spectrum Chemical Mfg Corp.
20.1.9.1. Overview
20.1.9.2. Product Portfolio
20.1.9.3. Profitability by Market Segment
20.1.9.4. Sales Footprint
20.1.9.5. Strategy Overview
20.1.9.5.1. Marketing Strategy
20.1.9.5.2. Product Strategy
20.1.10. Enzo Life Sciences
20.1.10.1. Overview
20.1.10.2. Product Portfolio
20.1.10.3. Profitability by Market Segment
20.1.10.4. Sales Footprint
20.1.10.5. Strategy Overview
20.1.10.5.1. Marketing Strategy
20.1.10.5.2. Product Strategy
20.1.11. BeanTown Chemical
20.1.11.1. Overview
20.1.11.2. Product Portfolio
20.1.11.3. Profitability by Market Segment
20.1.11.4. Sales Footprint
20.1.11.5. Strategy Overview
20.1.11.5.1. Marketing Strategy
20.1.11.5.2. Product Strategy
20.1.12. Acros Organics MS
20.1.12.1. Overview
20.1.12.2. Product Portfolio
20.1.12.3. Profitability by Market Segment
20.1.12.4. Sales Footprint
20.1.12.5. Strategy Overview
20.1.12.5.1. Marketing Strategy
20.1.12.5.2. Product Strategy
20.1.13. Cayman Chemical
20.1.13.1. Overview
20.1.13.2. Product Portfolio
20.1.13.3. Profitability by Market Segment
20.1.13.4. Sales Footprint
20.1.13.5. Strategy Overview
20.1.13.5.1. Marketing Strategy
20.1.13.5.2. Product Strategy
21. Assumptions & Acronyms Used
22. Research Methodology
Let us know your requirement to get
100% FREE customization
Table 1: Global Disodium Adenosine Triphosphate Market Value (US$ Mn) Forecast by Region, 2017-2032
Table 2: Global Disodium Adenosine Triphosphate Market Volume(Units) Forecast by Region, 2017-2032
Table 3: Global Disodium Adenosine Triphosphate Market Value (US$ Mn) Forecast by Application, 2017-2032
Table 4: Global Disodium Adenosine Triphosphate Market Volume(Units) Forecast by Application, 2017-2032
Table 5: Global Disodium Adenosine Triphosphate Market Value (US$ Mn) Forecast by End Use, 2017-2032
Table 6: Global Disodium Adenosine Triphosphate Market Volume(Units) Forecast by End Use, 2017-2032
Table 7: Global Disodium Adenosine Triphosphate Market Value (US$ Mn) Forecast by Nature, 2017-2032
Table 8: Global Disodium Adenosine Triphosphate Market Volume(Units) Forecast by Nature, 2017-2032
Table 9: Global Disodium Adenosine Triphosphate Market Value (US$ Mn) Forecast by Form, 2017-2032
Table 10: Global Disodium Adenosine Triphosphate Market Volume(Units) Forecast by Form, 2017-2032
Table 11: Global Disodium Adenosine Triphosphate Market Value (US$ Mn) Forecast by Sales Channel , 2017-2032
Table 12: Global Disodium Adenosine Triphosphate Market Volume(Units) Forecast by Sales Channel , 2017-2032
Table 13: North America Disodium Adenosine Triphosphate Market Value (US$ Mn) Forecast by Country, 2017-2032
Table 14: North America Disodium Adenosine Triphosphate Market Volume(Units) Forecast by Country, 2017-2032
Table 15: North America Disodium Adenosine Triphosphate Market Value (US$ Mn) Forecast by Application, 2017-2032
Table 16: North America Disodium Adenosine Triphosphate Market Volume(Units) Forecast by Application, 2017-2032
Table 17: North America Disodium Adenosine Triphosphate Market Value (US$ Mn) Forecast by End Use, 2017-2032
Table 18: North America Disodium Adenosine Triphosphate Market Volume(Units) Forecast by End Use, 2017-2032
Table 19: North America Disodium Adenosine Triphosphate Market Value (US$ Mn) Forecast by Nature, 2017-2032
Table 20: North America Disodium Adenosine Triphosphate Market Volume(Units) Forecast by Nature, 2017-2032
Table 21: North America Disodium Adenosine Triphosphate Market Value (US$ Mn) Forecast by Form, 2017-2032
Table 22: North America Disodium Adenosine Triphosphate Market Volume(Units) Forecast by Form, 2017-2032
Table 23: North America Disodium Adenosine Triphosphate Market Value (US$ Mn) Forecast by Sales Channel , 2017-2032
Table 24: North America Disodium Adenosine Triphosphate Market Volume(Units) Forecast by Sales Channel , 2017-2032
Table 25: Latin America Disodium Adenosine Triphosphate Market Value (US$ Mn) Forecast by Country, 2017-2032
Table 26: Latin America Disodium Adenosine Triphosphate Market Volume(Units) Forecast by Country, 2017-2032
Table 27: Latin America Disodium Adenosine Triphosphate Market Value (US$ Mn) Forecast by Application, 2017-2032
Table 28: Latin America Disodium Adenosine Triphosphate Market Volume(Units) Forecast by Application, 2017-2032
Table 29: Latin America Disodium Adenosine Triphosphate Market Value (US$ Mn) Forecast by End Use, 2017-2032
Table 30: Latin America Disodium Adenosine Triphosphate Market Volume(Units) Forecast by End Use, 2017-2032
Table 31: Latin America Disodium Adenosine Triphosphate Market Value (US$ Mn) Forecast by Nature, 2017-2032
Table 32: Latin America Disodium Adenosine Triphosphate Market Volume(Units) Forecast by Nature, 2017-2032
Table 33: Latin America Disodium Adenosine Triphosphate Market Value (US$ Mn) Forecast by Form, 2017-2032
Table 34: Latin America Disodium Adenosine Triphosphate Market Volume(Units) Forecast by Form, 2017-2032
Table 35: Latin America Disodium Adenosine Triphosphate Market Value (US$ Mn) Forecast by Sales Channel , 2017-2032
Table 36: Latin America Disodium Adenosine Triphosphate Market Volume(Units) Forecast by Sales Channel , 2017-2032
Table 37: Europe Disodium Adenosine Triphosphate Market Value (US$ Mn) Forecast by Country, 2017-2032
Table 38: Europe Disodium Adenosine Triphosphate Market Volume(Units) Forecast by Country, 2017-2032
Table 39: Europe Disodium Adenosine Triphosphate Market Value (US$ Mn) Forecast by Application, 2017-2032
Table 40: Europe Disodium Adenosine Triphosphate Market Volume(Units) Forecast by Application, 2017-2032
Table 41: Europe Disodium Adenosine Triphosphate Market Value (US$ Mn) Forecast by End Use, 2017-2032
Table 42: Europe Disodium Adenosine Triphosphate Market Volume(Units) Forecast by End Use, 2017-2032
Table 43: Europe Disodium Adenosine Triphosphate Market Value (US$ Mn) Forecast by Nature, 2017-2032
Table 44: Europe Disodium Adenosine Triphosphate Market Volume(Units) Forecast by Nature, 2017-2032
Table 45: Europe Disodium Adenosine Triphosphate Market Value (US$ Mn) Forecast by Form, 2017-2032
Table 46: Europe Disodium Adenosine Triphosphate Market Volume(Units) Forecast by Form, 2017-2032
Table 47: Europe Disodium Adenosine Triphosphate Market Value (US$ Mn) Forecast by Sales Channel , 2017-2032
Table 48: Europe Disodium Adenosine Triphosphate Market Volume(Units) Forecast by Sales Channel , 2017-2032
Table 49: East Asia Disodium Adenosine Triphosphate Market Value (US$ Mn) Forecast by Country, 2017-2032
Table 50: East Asia Disodium Adenosine Triphosphate Market Volume(Units) Forecast by Country, 2017-2032
Table 51: East Asia Disodium Adenosine Triphosphate Market Value (US$ Mn) Forecast by Application, 2017-2032
Table 52: East Asia Disodium Adenosine Triphosphate Market Volume(Units) Forecast by Application, 2017-2032
Table 53: East Asia Disodium Adenosine Triphosphate Market Value (US$ Mn) Forecast by End Use, 2017-2032
Table 54: East Asia Disodium Adenosine Triphosphate Market Volume(Units) Forecast by End Use, 2017-2032
Table 55: East Asia Disodium Adenosine Triphosphate Market Value (US$ Mn) Forecast by Nature, 2017-2032
Table 56: East Asia Disodium Adenosine Triphosphate Market Volume(Units) Forecast by Nature, 2017-2032
Table 57: East Asia Disodium Adenosine Triphosphate Market Value (US$ Mn) Forecast by Form, 2017-2032
Table 58: East Asia Disodium Adenosine Triphosphate Market Volume(Units) Forecast by Form, 2017-2032
Table 59: East Asia Disodium Adenosine Triphosphate Market Value (US$ Mn) Forecast by Sales Channel , 2017-2032
Table 60: East Asia Disodium Adenosine Triphosphate Market Volume(Units) Forecast by Sales Channel , 2017-2032
Table 61: South Asia Disodium Adenosine Triphosphate Market Value (US$ Mn) Forecast by Country, 2017-2032
Table 62: South Asia Disodium Adenosine Triphosphate Market Volume(Units) Forecast by Country, 2017-2032
Table 63: South Asia Disodium Adenosine Triphosphate Market Value (US$ Mn) Forecast by Application, 2017-2032
Table 64: South Asia Disodium Adenosine Triphosphate Market Volume(Units) Forecast by Application, 2017-2032
Table 65: South Asia Disodium Adenosine Triphosphate Market Value (US$ Mn) Forecast by End Use, 2017-2032
Table 66: South Asia Disodium Adenosine Triphosphate Market Volume(Units) Forecast by End Use, 2017-2032
Table 67: South Asia Disodium Adenosine Triphosphate Market Value (US$ Mn) Forecast by Nature, 2017-2032
Table 68: South Asia Disodium Adenosine Triphosphate Market Volume(Units) Forecast by Nature, 2017-2032
Table 69: South Asia Disodium Adenosine Triphosphate Market Value (US$ Mn) Forecast by Form, 2017-2032
Table 70: South Asia Disodium Adenosine Triphosphate Market Volume(Units) Forecast by Form, 2017-2032
Table 71: South Asia Disodium Adenosine Triphosphate Market Value (US$ Mn) Forecast by Sales Channel , 2017-2032
Table 72: South Asia Disodium Adenosine Triphosphate Market Volume(Units) Forecast by Sales Channel , 2017-2032
Table 73: Oceania Disodium Adenosine Triphosphate Market Value (US$ Mn) Forecast by Country, 2017-2032
Table 74: Oceania Disodium Adenosine Triphosphate Market Volume(Units) Forecast by Country, 2017-2032
Table 75: Oceania Disodium Adenosine Triphosphate Market Value (US$ Mn) Forecast by Application, 2017-2032
Table 76: Oceania Disodium Adenosine Triphosphate Market Volume(Units) Forecast by Application, 2017-2032
Table 77: Oceania Disodium Adenosine Triphosphate Market Value (US$ Mn) Forecast by End Use, 2017-2032
Table 78: Oceania Disodium Adenosine Triphosphate Market Volume(Units) Forecast by End Use, 2017-2032
Table 79: Oceania Disodium Adenosine Triphosphate Market Value (US$ Mn) Forecast by Nature, 2017-2032
Table 80: Oceania Disodium Adenosine Triphosphate Market Volume(Units) Forecast by Nature, 2017-2032
Table 81: Oceania Disodium Adenosine Triphosphate Market Value (US$ Mn) Forecast by Form, 2017-2032
Table 82: Oceania Disodium Adenosine Triphosphate Market Volume(Units) Forecast by Form, 2017-2032
Table 83: Oceania Disodium Adenosine Triphosphate Market Value (US$ Mn) Forecast by Sales Channel , 2017-2032
Table 84: Oceania Disodium Adenosine Triphosphate Market Volume(Units) Forecast by Sales Channel , 2017-2032
Table 85: MEA Disodium Adenosine Triphosphate Market Value (US$ Mn) Forecast by Country, 2017-2032
Table 86: MEA Disodium Adenosine Triphosphate Market Volume(Units) Forecast by Country, 2017-2032
Table 87: MEA Disodium Adenosine Triphosphate Market Value (US$ Mn) Forecast by Application, 2017-2032
Table 88: MEA Disodium Adenosine Triphosphate Market Volume(Units) Forecast by Application, 2017-2032
Table 89: MEA Disodium Adenosine Triphosphate Market Value (US$ Mn) Forecast by End Use, 2017-2032
Table 90: MEA Disodium Adenosine Triphosphate Market Volume(Units) Forecast by End Use, 2017-2032
Table 91: MEA Disodium Adenosine Triphosphate Market Value (US$ Mn) Forecast by Nature, 2017-2032
Table 92: MEA Disodium Adenosine Triphosphate Market Volume(Units) Forecast by Nature, 2017-2032
Table 93: MEA Disodium Adenosine Triphosphate Market Value (US$ Mn) Forecast by Form, 2017-2032
Table 94: MEA Disodium Adenosine Triphosphate Market Volume(Units) Forecast by Form, 2017-2032
Table 95: MEA Disodium Adenosine Triphosphate Market Value (US$ Mn) Forecast by Sales Channel , 2017-2032
Table 96: MEA Disodium Adenosine Triphosphate Market Volume(Units) Forecast by Sales Channel , 2017-2032
Find your sweet spots for generating winning opportunities in this market.
Talk to AnalystFigure 1: Global Disodium Adenosine Triphosphate Market Value (US$ Mn) by Application, 2022-2032
Figure 2: Global Disodium Adenosine Triphosphate Market Value (US$ Mn) by End Use, 2022-2032
Figure 3: Global Disodium Adenosine Triphosphate Market Value (US$ Mn) by Nature, 2022-2032
Figure 4: Global Disodium Adenosine Triphosphate Market Value (US$ Mn) by Form, 2022-2032
Figure 5: Global Disodium Adenosine Triphosphate Market Value (US$ Mn) by Sales Channel , 2022-2032
Figure 6: Global Disodium Adenosine Triphosphate Market Value (US$ Mn) by Region, 2022-2032
Figure 7: Global Disodium Adenosine Triphosphate Market Value (US$ Mn) Analysis by Region, 2017-2032
Figure 8: Global Disodium Adenosine Triphosphate Market Volume(Units) Analysis by Region, 2017-2032
Figure 9: Global Disodium Adenosine Triphosphate Market Value Share (%) and BPS Analysis by Region, 2022-2032
Figure 10: Global Disodium Adenosine Triphosphate Market Y-o-Y Growth (%) Projections by Region, 2022-2032
Figure 11: Global Disodium Adenosine Triphosphate Market Value (US$ Mn) Analysis by Application, 2017-2032
Figure 12: Global Disodium Adenosine Triphosphate Market Volume(Units) Analysis by Application, 2017-2032
Figure 13: Global Disodium Adenosine Triphosphate Market Value Share (%) and BPS Analysis by Application, 2022-2032
Figure 14: Global Disodium Adenosine Triphosphate Market Y-o-Y Growth (%) Projections by Application, 2022-2032
Figure 15: Global Disodium Adenosine Triphosphate Market Value (US$ Mn) Analysis by End Use, 2017-2032
Figure 16: Global Disodium Adenosine Triphosphate Market Volume(Units) Analysis by End Use, 2017-2032
Figure 17: Global Disodium Adenosine Triphosphate Market Value Share (%) and BPS Analysis by End Use, 2022-2032
Figure 18: Global Disodium Adenosine Triphosphate Market Y-o-Y Growth (%) Projections by End Use, 2022-2032
Figure 19: Global Disodium Adenosine Triphosphate Market Value (US$ Mn) Analysis by Nature, 2017-2032
Figure 20: Global Disodium Adenosine Triphosphate Market Volume(Units) Analysis by Nature, 2017-2032
Figure 21: Global Disodium Adenosine Triphosphate Market Value Share (%) and BPS Analysis by Nature, 2022-2032
Figure 22: Global Disodium Adenosine Triphosphate Market Y-o-Y Growth (%) Projections by Nature, 2022-2032
Figure 23: Global Disodium Adenosine Triphosphate Market Value (US$ Mn) Analysis by Form, 2017-2032
Figure 24: Global Disodium Adenosine Triphosphate Market Volume(Units) Analysis by Form, 2017-2032
Figure 25: Global Disodium Adenosine Triphosphate Market Value Share (%) and BPS Analysis by Form, 2022-2032
Figure 26: Global Disodium Adenosine Triphosphate Market Y-o-Y Growth (%) Projections by Form, 2022-2032
Figure 27: Global Disodium Adenosine Triphosphate Market Value (US$ Mn) Analysis by Sales Channel , 2017-2032
Figure 28: Global Disodium Adenosine Triphosphate Market Volume(Units) Analysis by Sales Channel , 2017-2032
Figure 29: Global Disodium Adenosine Triphosphate Market Value Share (%) and BPS Analysis by Sales Channel , 2022-2032
Figure 30: Global Disodium Adenosine Triphosphate Market Y-o-Y Growth (%) Projections by Sales Channel , 2022-2032
Figure 31: Global Disodium Adenosine Triphosphate Market Attractiveness by Application, 2022-2032
Figure 32: Global Disodium Adenosine Triphosphate Market Attractiveness by End Use, 2022-2032
Figure 33: Global Disodium Adenosine Triphosphate Market Attractiveness by Nature, 2022-2032
Figure 34: Global Disodium Adenosine Triphosphate Market Attractiveness by Form, 2022-2032
Figure 35: Global Disodium Adenosine Triphosphate Market Attractiveness by Sales Channel , 2022-2032
Figure 36: Global Disodium Adenosine Triphosphate Market Attractiveness by Region, 2022-2032
Figure 37: North America Disodium Adenosine Triphosphate Market Value (US$ Mn) by Application, 2022-2032
Figure 38: North America Disodium Adenosine Triphosphate Market Value (US$ Mn) by End Use, 2022-2032
Figure 39: North America Disodium Adenosine Triphosphate Market Value (US$ Mn) by Nature, 2022-2032
Figure 40: North America Disodium Adenosine Triphosphate Market Value (US$ Mn) by Form, 2022-2032
Figure 41: North America Disodium Adenosine Triphosphate Market Value (US$ Mn) by Sales Channel , 2022-2032
Figure 42: North America Disodium Adenosine Triphosphate Market Value (US$ Mn) by Country, 2022-2032
Figure 43: North America Disodium Adenosine Triphosphate Market Value (US$ Mn) Analysis by Country, 2017-2032
Figure 44: North America Disodium Adenosine Triphosphate Market Volume(Units) Analysis by Country, 2017-2032
Figure 45: North America Disodium Adenosine Triphosphate Market Value Share (%) and BPS Analysis by Country, 2022-2032
Figure 46: North America Disodium Adenosine Triphosphate Market Y-o-Y Growth (%) Projections by Country, 2022-2032
Figure 47: North America Disodium Adenosine Triphosphate Market Value (US$ Mn) Analysis by Application, 2017-2032
Figure 48: North America Disodium Adenosine Triphosphate Market Volume(Units) Analysis by Application, 2017-2032
Figure 49: North America Disodium Adenosine Triphosphate Market Value Share (%) and BPS Analysis by Application, 2022-2032
Figure 50: North America Disodium Adenosine Triphosphate Market Y-o-Y Growth (%) Projections by Application, 2022-2032
Figure 51: North America Disodium Adenosine Triphosphate Market Value (US$ Mn) Analysis by End Use, 2017-2032
Figure 52: North America Disodium Adenosine Triphosphate Market Volume(Units) Analysis by End Use, 2017-2032
Figure 53: North America Disodium Adenosine Triphosphate Market Value Share (%) and BPS Analysis by End Use, 2022-2032
Figure 54: North America Disodium Adenosine Triphosphate Market Y-o-Y Growth (%) Projections by End Use, 2022-2032
Figure 55: North America Disodium Adenosine Triphosphate Market Value (US$ Mn) Analysis by Nature, 2017-2032
Figure 56: North America Disodium Adenosine Triphosphate Market Volume(Units) Analysis by Nature, 2017-2032
Figure 57: North America Disodium Adenosine Triphosphate Market Value Share (%) and BPS Analysis by Nature, 2022-2032
Figure 58: North America Disodium Adenosine Triphosphate Market Y-o-Y Growth (%) Projections by Nature, 2022-2032
Figure 59: North America Disodium Adenosine Triphosphate Market Value (US$ Mn) Analysis by Form, 2017-2032
Figure 60: North America Disodium Adenosine Triphosphate Market Volume(Units) Analysis by Form, 2017-2032
Figure 61: North America Disodium Adenosine Triphosphate Market Value Share (%) and BPS Analysis by Form, 2022-2032
Figure 62: North America Disodium Adenosine Triphosphate Market Y-o-Y Growth (%) Projections by Form, 2022-2032
Figure 63: North America Disodium Adenosine Triphosphate Market Value (US$ Mn) Analysis by Sales Channel , 2017-2032
Figure 64: North America Disodium Adenosine Triphosphate Market Volume(Units) Analysis by Sales Channel , 2017-2032
Figure 65: North America Disodium Adenosine Triphosphate Market Value Share (%) and BPS Analysis by Sales Channel , 2022-2032
Figure 66: North America Disodium Adenosine Triphosphate Market Y-o-Y Growth (%) Projections by Sales Channel , 2022-2032
Figure 67: North America Disodium Adenosine Triphosphate Market Attractiveness by Application, 2022-2032
Figure 68: North America Disodium Adenosine Triphosphate Market Attractiveness by End Use, 2022-2032
Figure 69: North America Disodium Adenosine Triphosphate Market Attractiveness by Nature, 2022-2032
Figure 70: North America Disodium Adenosine Triphosphate Market Attractiveness by Form, 2022-2032
Figure 71: North America Disodium Adenosine Triphosphate Market Attractiveness by Sales Channel , 2022-2032
Figure 72: North America Disodium Adenosine Triphosphate Market Attractiveness by Country, 2022-2032
Figure 73: Latin America Disodium Adenosine Triphosphate Market Value (US$ Mn) by Application, 2022-2032
Figure 74: Latin America Disodium Adenosine Triphosphate Market Value (US$ Mn) by End Use, 2022-2032
Figure 75: Latin America Disodium Adenosine Triphosphate Market Value (US$ Mn) by Nature, 2022-2032
Figure 76: Latin America Disodium Adenosine Triphosphate Market Value (US$ Mn) by Form, 2022-2032
Figure 77: Latin America Disodium Adenosine Triphosphate Market Value (US$ Mn) by Sales Channel , 2022-2032
Figure 78: Latin America Disodium Adenosine Triphosphate Market Value (US$ Mn) by Country, 2022-2032
Figure 79: Latin America Disodium Adenosine Triphosphate Market Value (US$ Mn) Analysis by Country, 2017-2032
Figure 80: Latin America Disodium Adenosine Triphosphate Market Volume(Units) Analysis by Country, 2017-2032
Figure 81: Latin America Disodium Adenosine Triphosphate Market Value Share (%) and BPS Analysis by Country, 2022-2032
Figure 82: Latin America Disodium Adenosine Triphosphate Market Y-o-Y Growth (%) Projections by Country, 2022-2032
Figure 83: Latin America Disodium Adenosine Triphosphate Market Value (US$ Mn) Analysis by Application, 2017-2032
Figure 84: Latin America Disodium Adenosine Triphosphate Market Volume(Units) Analysis by Application, 2017-2032
Figure 85: Latin America Disodium Adenosine Triphosphate Market Value Share (%) and BPS Analysis by Application, 2022-2032
Figure 86: Latin America Disodium Adenosine Triphosphate Market Y-o-Y Growth (%) Projections by Application, 2022-2032
Figure 87: Latin America Disodium Adenosine Triphosphate Market Value (US$ Mn) Analysis by End Use, 2017-2032
Figure 88: Latin America Disodium Adenosine Triphosphate Market Volume(Units) Analysis by End Use, 2017-2032
Figure 89: Latin America Disodium Adenosine Triphosphate Market Value Share (%) and BPS Analysis by End Use, 2022-2032
Figure 90: Latin America Disodium Adenosine Triphosphate Market Y-o-Y Growth (%) Projections by End Use, 2022-2032
Figure 91: Latin America Disodium Adenosine Triphosphate Market Value (US$ Mn) Analysis by Nature, 2017-2032
Figure 92: Latin America Disodium Adenosine Triphosphate Market Volume(Units) Analysis by Nature, 2017-2032
Figure 93: Latin America Disodium Adenosine Triphosphate Market Value Share (%) and BPS Analysis by Nature, 2022-2032
Figure 94: Latin America Disodium Adenosine Triphosphate Market Y-o-Y Growth (%) Projections by Nature, 2022-2032
Figure 95: Latin America Disodium Adenosine Triphosphate Market Value (US$ Mn) Analysis by Form, 2017-2032
Figure 96: Latin America Disodium Adenosine Triphosphate Market Volume(Units) Analysis by Form, 2017-2032
Figure 97: Latin America Disodium Adenosine Triphosphate Market Value Share (%) and BPS Analysis by Form, 2022-2032
Figure 98: Latin America Disodium Adenosine Triphosphate Market Y-o-Y Growth (%) Projections by Form, 2022-2032
Figure 99: Latin America Disodium Adenosine Triphosphate Market Value (US$ Mn) Analysis by Sales Channel , 2017-2032
Figure 100: Latin America Disodium Adenosine Triphosphate Market Volume(Units) Analysis by Sales Channel , 2017-2032
Figure 101: Latin America Disodium Adenosine Triphosphate Market Value Share (%) and BPS Analysis by Sales Channel , 2022-2032
Figure 102: Latin America Disodium Adenosine Triphosphate Market Y-o-Y Growth (%) Projections by Sales Channel , 2022-2032
Figure 103: Latin America Disodium Adenosine Triphosphate Market Attractiveness by Application, 2022-2032
Figure 104: Latin America Disodium Adenosine Triphosphate Market Attractiveness by End Use, 2022-2032
Figure 105: Latin America Disodium Adenosine Triphosphate Market Attractiveness by Nature, 2022-2032
Figure 106: Latin America Disodium Adenosine Triphosphate Market Attractiveness by Form, 2022-2032
Figure 107: Latin America Disodium Adenosine Triphosphate Market Attractiveness by Sales Channel , 2022-2032
Figure 108: Latin America Disodium Adenosine Triphosphate Market Attractiveness by Country, 2022-2032
Figure 109: Europe Disodium Adenosine Triphosphate Market Value (US$ Mn) by Application, 2022-2032
Figure 110: Europe Disodium Adenosine Triphosphate Market Value (US$ Mn) by End Use, 2022-2032
Figure 111: Europe Disodium Adenosine Triphosphate Market Value (US$ Mn) by Nature, 2022-2032
Figure 112: Europe Disodium Adenosine Triphosphate Market Value (US$ Mn) by Form, 2022-2032
Figure 113: Europe Disodium Adenosine Triphosphate Market Value (US$ Mn) by Sales Channel , 2022-2032
Figure 114: Europe Disodium Adenosine Triphosphate Market Value (US$ Mn) by Country, 2022-2032
Figure 115: Europe Disodium Adenosine Triphosphate Market Value (US$ Mn) Analysis by Country, 2017-2032
Figure 116: Europe Disodium Adenosine Triphosphate Market Volume(Units) Analysis by Country, 2017-2032
Figure 117: Europe Disodium Adenosine Triphosphate Market Value Share (%) and BPS Analysis by Country, 2022-2032
Figure 118: Europe Disodium Adenosine Triphosphate Market Y-o-Y Growth (%) Projections by Country, 2022-2032
Figure 119: Europe Disodium Adenosine Triphosphate Market Value (US$ Mn) Analysis by Application, 2017-2032
Figure 120: Europe Disodium Adenosine Triphosphate Market Volume(Units) Analysis by Application, 2017-2032
Figure 121: Europe Disodium Adenosine Triphosphate Market Value Share (%) and BPS Analysis by Application, 2022-2032
Figure 122: Europe Disodium Adenosine Triphosphate Market Y-o-Y Growth (%) Projections by Application, 2022-2032
Figure 123: Europe Disodium Adenosine Triphosphate Market Value (US$ Mn) Analysis by End Use, 2017-2032
Figure 124: Europe Disodium Adenosine Triphosphate Market Volume(Units) Analysis by End Use, 2017-2032
Figure 125: Europe Disodium Adenosine Triphosphate Market Value Share (%) and BPS Analysis by End Use, 2022-2032
Figure 126: Europe Disodium Adenosine Triphosphate Market Y-o-Y Growth (%) Projections by End Use, 2022-2032
Figure 127: Europe Disodium Adenosine Triphosphate Market Value (US$ Mn) Analysis by Nature, 2017-2032
Figure 128: Europe Disodium Adenosine Triphosphate Market Volume(Units) Analysis by Nature, 2017-2032
Figure 129: Europe Disodium Adenosine Triphosphate Market Value Share (%) and BPS Analysis by Nature, 2022-2032
Figure 130: Europe Disodium Adenosine Triphosphate Market Y-o-Y Growth (%) Projections by Nature, 2022-2032
Figure 131: Europe Disodium Adenosine Triphosphate Market Value (US$ Mn) Analysis by Form, 2017-2032
Figure 132: Europe Disodium Adenosine Triphosphate Market Volume(Units) Analysis by Form, 2017-2032
Figure 133: Europe Disodium Adenosine Triphosphate Market Value Share (%) and BPS Analysis by Form, 2022-2032
Figure 134: Europe Disodium Adenosine Triphosphate Market Y-o-Y Growth (%) Projections by Form, 2022-2032
Figure 135: Europe Disodium Adenosine Triphosphate Market Value (US$ Mn) Analysis by Sales Channel , 2017-2032
Figure 136: Europe Disodium Adenosine Triphosphate Market Volume(Units) Analysis by Sales Channel , 2017-2032
Figure 137: Europe Disodium Adenosine Triphosphate Market Value Share (%) and BPS Analysis by Sales Channel , 2022-2032
Figure 138: Europe Disodium Adenosine Triphosphate Market Y-o-Y Growth (%) Projections by Sales Channel , 2022-2032
Figure 139: Europe Disodium Adenosine Triphosphate Market Attractiveness by Application, 2022-2032
Figure 140: Europe Disodium Adenosine Triphosphate Market Attractiveness by End Use, 2022-2032
Figure 141: Europe Disodium Adenosine Triphosphate Market Attractiveness by Nature, 2022-2032
Figure 142: Europe Disodium Adenosine Triphosphate Market Attractiveness by Form, 2022-2032
Figure 143: Europe Disodium Adenosine Triphosphate Market Attractiveness by Sales Channel , 2022-2032
Figure 144: Europe Disodium Adenosine Triphosphate Market Attractiveness by Country, 2022-2032
Figure 145: East Asia Disodium Adenosine Triphosphate Market Value (US$ Mn) by Application, 2022-2032
Figure 146: East Asia Disodium Adenosine Triphosphate Market Value (US$ Mn) by End Use, 2022-2032
Figure 147: East Asia Disodium Adenosine Triphosphate Market Value (US$ Mn) by Nature, 2022-2032
Figure 148: East Asia Disodium Adenosine Triphosphate Market Value (US$ Mn) by Form, 2022-2032
Figure 149: East Asia Disodium Adenosine Triphosphate Market Value (US$ Mn) by Sales Channel , 2022-2032
Figure 150: East Asia Disodium Adenosine Triphosphate Market Value (US$ Mn) by Country, 2022-2032
Figure 151: East Asia Disodium Adenosine Triphosphate Market Value (US$ Mn) Analysis by Country, 2017-2032
Figure 152: East Asia Disodium Adenosine Triphosphate Market Volume(Units) Analysis by Country, 2017-2032
Figure 153: East Asia Disodium Adenosine Triphosphate Market Value Share (%) and BPS Analysis by Country, 2022-2032
Figure 154: East Asia Disodium Adenosine Triphosphate Market Y-o-Y Growth (%) Projections by Country, 2022-2032
Figure 155: East Asia Disodium Adenosine Triphosphate Market Value (US$ Mn) Analysis by Application, 2017-2032
Figure 156: East Asia Disodium Adenosine Triphosphate Market Volume(Units) Analysis by Application, 2017-2032
Figure 157: East Asia Disodium Adenosine Triphosphate Market Value Share (%) and BPS Analysis by Application, 2022-2032
Figure 158: East Asia Disodium Adenosine Triphosphate Market Y-o-Y Growth (%) Projections by Application, 2022-2032
Figure 159: East Asia Disodium Adenosine Triphosphate Market Value (US$ Mn) Analysis by End Use, 2017-2032
Figure 160: East Asia Disodium Adenosine Triphosphate Market Volume(Units) Analysis by End Use, 2017-2032
Figure 161: East Asia Disodium Adenosine Triphosphate Market Value Share (%) and BPS Analysis by End Use, 2022-2032
Figure 162: East Asia Disodium Adenosine Triphosphate Market Y-o-Y Growth (%) Projections by End Use, 2022-2032
Figure 163: East Asia Disodium Adenosine Triphosphate Market Value (US$ Mn) Analysis by Nature, 2017-2032
Figure 164: East Asia Disodium Adenosine Triphosphate Market Volume(Units) Analysis by Nature, 2017-2032
Figure 165: East Asia Disodium Adenosine Triphosphate Market Value Share (%) and BPS Analysis by Nature, 2022-2032
Figure 166: East Asia Disodium Adenosine Triphosphate Market Y-o-Y Growth (%) Projections by Nature, 2022-2032
Figure 167: East Asia Disodium Adenosine Triphosphate Market Value (US$ Mn) Analysis by Form, 2017-2032
Figure 168: East Asia Disodium Adenosine Triphosphate Market Volume(Units) Analysis by Form, 2017-2032
Figure 169: East Asia Disodium Adenosine Triphosphate Market Value Share (%) and BPS Analysis by Form, 2022-2032
Figure 170: East Asia Disodium Adenosine Triphosphate Market Y-o-Y Growth (%) Projections by Form, 2022-2032
Figure 171: East Asia Disodium Adenosine Triphosphate Market Value (US$ Mn) Analysis by Sales Channel , 2017-2032
Figure 172: East Asia Disodium Adenosine Triphosphate Market Volume(Units) Analysis by Sales Channel , 2017-2032
Figure 173: East Asia Disodium Adenosine Triphosphate Market Value Share (%) and BPS Analysis by Sales Channel , 2022-2032
Figure 174: East Asia Disodium Adenosine Triphosphate Market Y-o-Y Growth (%) Projections by Sales Channel , 2022-2032
Figure 175: East Asia Disodium Adenosine Triphosphate Market Attractiveness by Application, 2022-2032
Figure 176: East Asia Disodium Adenosine Triphosphate Market Attractiveness by End Use, 2022-2032
Figure 177: East Asia Disodium Adenosine Triphosphate Market Attractiveness by Nature, 2022-2032
Figure 178: East Asia Disodium Adenosine Triphosphate Market Attractiveness by Form, 2022-2032
Figure 179: East Asia Disodium Adenosine Triphosphate Market Attractiveness by Sales Channel , 2022-2032
Figure 180: East Asia Disodium Adenosine Triphosphate Market Attractiveness by Country, 2022-2032
Figure 181: South Asia Disodium Adenosine Triphosphate Market Value (US$ Mn) by Application, 2022-2032
Figure 182: South Asia Disodium Adenosine Triphosphate Market Value (US$ Mn) by End Use, 2022-2032
Figure 183: South Asia Disodium Adenosine Triphosphate Market Value (US$ Mn) by Nature, 2022-2032
Figure 184: South Asia Disodium Adenosine Triphosphate Market Value (US$ Mn) by Form, 2022-2032
Figure 185: South Asia Disodium Adenosine Triphosphate Market Value (US$ Mn) by Sales Channel , 2022-2032
Figure 186: South Asia Disodium Adenosine Triphosphate Market Value (US$ Mn) by Country, 2022-2032
Figure 187: South Asia Disodium Adenosine Triphosphate Market Value (US$ Mn) Analysis by Country, 2017-2032
Figure 188: South Asia Disodium Adenosine Triphosphate Market Volume(Units) Analysis by Country, 2017-2032
Figure 189: South Asia Disodium Adenosine Triphosphate Market Value Share (%) and BPS Analysis by Country, 2022-2032
Figure 190: South Asia Disodium Adenosine Triphosphate Market Y-o-Y Growth (%) Projections by Country, 2022-2032
Figure 191: South Asia Disodium Adenosine Triphosphate Market Value (US$ Mn) Analysis by Application, 2017-2032
Figure 192: South Asia Disodium Adenosine Triphosphate Market Volume(Units) Analysis by Application, 2017-2032
Figure 193: South Asia Disodium Adenosine Triphosphate Market Value Share (%) and BPS Analysis by Application, 2022-2032
Figure 194: South Asia Disodium Adenosine Triphosphate Market Y-o-Y Growth (%) Projections by Application, 2022-2032
Figure 195: South Asia Disodium Adenosine Triphosphate Market Value (US$ Mn) Analysis by End Use, 2017-2032
Figure 196: South Asia Disodium Adenosine Triphosphate Market Volume(Units) Analysis by End Use, 2017-2032
Figure 197: South Asia Disodium Adenosine Triphosphate Market Value Share (%) and BPS Analysis by End Use, 2022-2032
Figure 198: South Asia Disodium Adenosine Triphosphate Market Y-o-Y Growth (%) Projections by End Use, 2022-2032
Figure 199: South Asia Disodium Adenosine Triphosphate Market Value (US$ Mn) Analysis by Nature, 2017-2032
Figure 200: South Asia Disodium Adenosine Triphosphate Market Volume(Units) Analysis by Nature, 2017-2032
Figure 201: South Asia Disodium Adenosine Triphosphate Market Value Share (%) and BPS Analysis by Nature, 2022-2032
Figure 202: South Asia Disodium Adenosine Triphosphate Market Y-o-Y Growth (%) Projections by Nature, 2022-2032
Figure 203: South Asia Disodium Adenosine Triphosphate Market Value (US$ Mn) Analysis by Form, 2017-2032
Figure 204: South Asia Disodium Adenosine Triphosphate Market Volume(Units) Analysis by Form, 2017-2032
Figure 205: South Asia Disodium Adenosine Triphosphate Market Value Share (%) and BPS Analysis by Form, 2022-2032
Figure 206: South Asia Disodium Adenosine Triphosphate Market Y-o-Y Growth (%) Projections by Form, 2022-2032
Figure 207: South Asia Disodium Adenosine Triphosphate Market Value (US$ Mn) Analysis by Sales Channel , 2017-2032
Figure 208: South Asia Disodium Adenosine Triphosphate Market Volume(Units) Analysis by Sales Channel , 2017-2032
Figure 209: South Asia Disodium Adenosine Triphosphate Market Value Share (%) and BPS Analysis by Sales Channel , 2022-2032
Figure 210: South Asia Disodium Adenosine Triphosphate Market Y-o-Y Growth (%) Projections by Sales Channel , 2022-2032
Figure 211: South Asia Disodium Adenosine Triphosphate Market Attractiveness by Application, 2022-2032
Figure 212: South Asia Disodium Adenosine Triphosphate Market Attractiveness by End Use, 2022-2032
Figure 213: South Asia Disodium Adenosine Triphosphate Market Attractiveness by Nature, 2022-2032
Figure 214: South Asia Disodium Adenosine Triphosphate Market Attractiveness by Form, 2022-2032
Figure 215: South Asia Disodium Adenosine Triphosphate Market Attractiveness by Sales Channel , 2022-2032
Figure 216: South Asia Disodium Adenosine Triphosphate Market Attractiveness by Country, 2022-2032
Figure 217: Oceania Disodium Adenosine Triphosphate Market Value (US$ Mn) by Application, 2022-2032
Figure 218: Oceania Disodium Adenosine Triphosphate Market Value (US$ Mn) by End Use, 2022-2032
Figure 219: Oceania Disodium Adenosine Triphosphate Market Value (US$ Mn) by Nature, 2022-2032
Figure 220: Oceania Disodium Adenosine Triphosphate Market Value (US$ Mn) by Form, 2022-2032
Figure 221: Oceania Disodium Adenosine Triphosphate Market Value (US$ Mn) by Sales Channel , 2022-2032
Figure 222: Oceania Disodium Adenosine Triphosphate Market Value (US$ Mn) by Country, 2022-2032
Figure 223: Oceania Disodium Adenosine Triphosphate Market Value (US$ Mn) Analysis by Country, 2017-2032
Figure 224: Oceania Disodium Adenosine Triphosphate Market Volume(Units) Analysis by Country, 2017-2032
Figure 225: Oceania Disodium Adenosine Triphosphate Market Value Share (%) and BPS Analysis by Country, 2022-2032
Figure 226: Oceania Disodium Adenosine Triphosphate Market Y-o-Y Growth (%) Projections by Country, 2022-2032
Figure 227: Oceania Disodium Adenosine Triphosphate Market Value (US$ Mn) Analysis by Application, 2017-2032
Figure 228: Oceania Disodium Adenosine Triphosphate Market Volume(Units) Analysis by Application, 2017-2032
Figure 229: Oceania Disodium Adenosine Triphosphate Market Value Share (%) and BPS Analysis by Application, 2022-2032
Figure 230: Oceania Disodium Adenosine Triphosphate Market Y-o-Y Growth (%) Projections by Application, 2022-2032
Figure 231: Oceania Disodium Adenosine Triphosphate Market Value (US$ Mn) Analysis by End Use, 2017-2032
Figure 232: Oceania Disodium Adenosine Triphosphate Market Volume(Units) Analysis by End Use, 2017-2032
Figure 233: Oceania Disodium Adenosine Triphosphate Market Value Share (%) and BPS Analysis by End Use, 2022-2032
Figure 234: Oceania Disodium Adenosine Triphosphate Market Y-o-Y Growth (%) Projections by End Use, 2022-2032
Figure 235: Oceania Disodium Adenosine Triphosphate Market Value (US$ Mn) Analysis by Nature, 2017-2032
Figure 236: Oceania Disodium Adenosine Triphosphate Market Volume(Units) Analysis by Nature, 2017-2032
Figure 237: Oceania Disodium Adenosine Triphosphate Market Value Share (%) and BPS Analysis by Nature, 2022-2032
Figure 238: Oceania Disodium Adenosine Triphosphate Market Y-o-Y Growth (%) Projections by Nature, 2022-2032
Figure 239: Oceania Disodium Adenosine Triphosphate Market Value (US$ Mn) Analysis by Form, 2017-2032
Figure 240: Oceania Disodium Adenosine Triphosphate Market Volume(Units) Analysis by Form, 2017-2032
Figure 241: Oceania Disodium Adenosine Triphosphate Market Value Share (%) and BPS Analysis by Form, 2022-2032
Figure 242: Oceania Disodium Adenosine Triphosphate Market Y-o-Y Growth (%) Projections by Form, 2022-2032
Figure 243: Oceania Disodium Adenosine Triphosphate Market Value (US$ Mn) Analysis by Sales Channel , 2017-2032
Figure 244: Oceania Disodium Adenosine Triphosphate Market Volume(Units) Analysis by Sales Channel , 2017-2032
Figure 245: Oceania Disodium Adenosine Triphosphate Market Value Share (%) and BPS Analysis by Sales Channel , 2022-2032
Figure 246: Oceania Disodium Adenosine Triphosphate Market Y-o-Y Growth (%) Projections by Sales Channel , 2022-2032
Figure 247: Oceania Disodium Adenosine Triphosphate Market Attractiveness by Application, 2022-2032
Figure 248: Oceania Disodium Adenosine Triphosphate Market Attractiveness by End Use, 2022-2032
Figure 249: Oceania Disodium Adenosine Triphosphate Market Attractiveness by Nature, 2022-2032
Figure 250: Oceania Disodium Adenosine Triphosphate Market Attractiveness by Form, 2022-2032
Figure 251: Oceania Disodium Adenosine Triphosphate Market Attractiveness by Sales Channel , 2022-2032
Figure 252: Oceania Disodium Adenosine Triphosphate Market Attractiveness by Country, 2022-2032
Figure 253: MEA Disodium Adenosine Triphosphate Market Value (US$ Mn) by Application, 2022-2032
Figure 254: MEA Disodium Adenosine Triphosphate Market Value (US$ Mn) by End Use, 2022-2032
Figure 255: MEA Disodium Adenosine Triphosphate Market Value (US$ Mn) by Nature, 2022-2032
Figure 256: MEA Disodium Adenosine Triphosphate Market Value (US$ Mn) by Form, 2022-2032
Figure 257: MEA Disodium Adenosine Triphosphate Market Value (US$ Mn) by Sales Channel , 2022-2032
Figure 258: MEA Disodium Adenosine Triphosphate Market Value (US$ Mn) by Country, 2022-2032
Figure 259: MEA Disodium Adenosine Triphosphate Market Value (US$ Mn) Analysis by Country, 2017-2032
Figure 260: MEA Disodium Adenosine Triphosphate Market Volume(Units) Analysis by Country, 2017-2032
Figure 261: MEA Disodium Adenosine Triphosphate Market Value Share (%) and BPS Analysis by Country, 2022-2032
Figure 262: MEA Disodium Adenosine Triphosphate Market Y-o-Y Growth (%) Projections by Country, 2022-2032
Figure 263: MEA Disodium Adenosine Triphosphate Market Value (US$ Mn) Analysis by Application, 2017-2032
Figure 264: MEA Disodium Adenosine Triphosphate Market Volume(Units) Analysis by Application, 2017-2032
Figure 265: MEA Disodium Adenosine Triphosphate Market Value Share (%) and BPS Analysis by Application, 2022-2032
Figure 266: MEA Disodium Adenosine Triphosphate Market Y-o-Y Growth (%) Projections by Application, 2022-2032
Figure 267: MEA Disodium Adenosine Triphosphate Market Value (US$ Mn) Analysis by End Use, 2017-2032
Figure 268: MEA Disodium Adenosine Triphosphate Market Volume(Units) Analysis by End Use, 2017-2032
Figure 269: MEA Disodium Adenosine Triphosphate Market Value Share (%) and BPS Analysis by End Use, 2022-2032
Figure 270: MEA Disodium Adenosine Triphosphate Market Y-o-Y Growth (%) Projections by End Use, 2022-2032
Figure 271: MEA Disodium Adenosine Triphosphate Market Value (US$ Mn) Analysis by Nature, 2017-2032
Figure 272: MEA Disodium Adenosine Triphosphate Market Volume(Units) Analysis by Nature, 2017-2032
Figure 273: MEA Disodium Adenosine Triphosphate Market Value Share (%) and BPS Analysis by Nature, 2022-2032
Figure 274: MEA Disodium Adenosine Triphosphate Market Y-o-Y Growth (%) Projections by Nature, 2022-2032
Figure 275: MEA Disodium Adenosine Triphosphate Market Value (US$ Mn) Analysis by Form, 2017-2032
Figure 276: MEA Disodium Adenosine Triphosphate Market Volume(Units) Analysis by Form, 2017-2032
Figure 277: MEA Disodium Adenosine Triphosphate Market Value Share (%) and BPS Analysis by Form, 2022-2032
Figure 278: MEA Disodium Adenosine Triphosphate Market Y-o-Y Growth (%) Projections by Form, 2022-2032
Figure 279: MEA Disodium Adenosine Triphosphate Market Value (US$ Mn) Analysis by Sales Channel , 2017-2032
Figure 280: MEA Disodium Adenosine Triphosphate Market Volume(Units) Analysis by Sales Channel , 2017-2032
Figure 281: MEA Disodium Adenosine Triphosphate Market Value Share (%) and BPS Analysis by Sales Channel , 2022-2032
Figure 282: MEA Disodium Adenosine Triphosphate Market Y-o-Y Growth (%) Projections by Sales Channel , 2022-2032
Figure 283: MEA Disodium Adenosine Triphosphate Market Attractiveness by Application, 2022-2032
Figure 284: MEA Disodium Adenosine Triphosphate Market Attractiveness by End Use, 2022-2032
Figure 285: MEA Disodium Adenosine Triphosphate Market Attractiveness by Nature, 2022-2032
Figure 286: MEA Disodium Adenosine Triphosphate Market Attractiveness by Form, 2022-2032
Figure 287: MEA Disodium Adenosine Triphosphate Market Attractiveness by Sales Channel , 2022-2032
Figure 288: MEA Disodium Adenosine Triphosphate Market Attractiveness by Country, 2022-2032
Need specific information?
Request CustomizationExplore Consumer Product Insights
View Reports