DIY Eyelash Extension Market
Market Insights on DIY Eyelash Extension covering sales outlook, demand forecast & up-to-date key trends
DIY Eyelash Extension Market by Product Type, Material Type, Supply Channel & Region | Forecast 2023 to 2033
DIY Eyelash Extension Market Outlook - 2023 to 2033
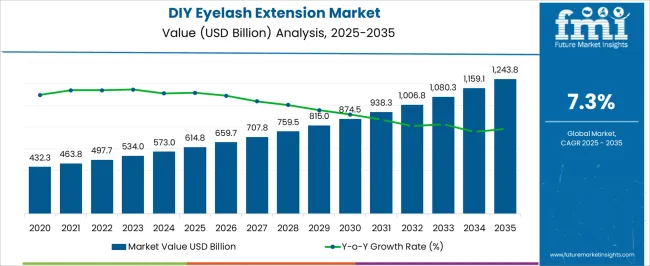
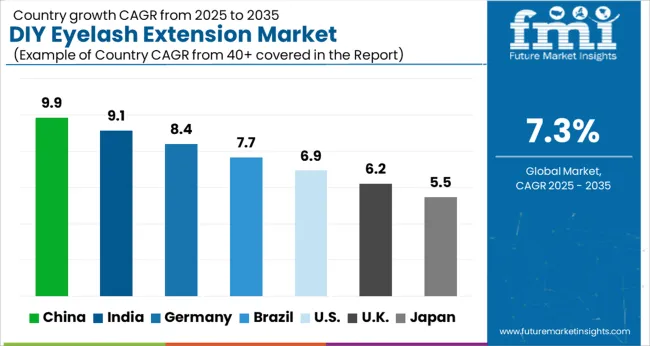
As per newly released data by Future Market Insights (FMI), the DIY eyelash extension market is estimated at USD 534.0 million in 2023 and is projected to reach USD 1,093.6 million by 2033, at a CAGR of ~7.3% from 2023 to 2033. The share of DIY Eyelash Extension market in its parent market (Eye Extension Market) is approximately ~25% to 35%.
Attribute |
Details |
Estimated DIY Eyelash Extension Market Size (2023E) |
US$ 534.0 Million |
Projected DIY Eyelash Extension Market Valuation (2033F) |
US$ 1,093.6 Million |
Value-based CAGR (2023 to 2033) |
~7.3% |
Collective Value Share: Top 5 Countries (2022A) |
~35% to 40% |
Let us know your requirement to get
100% FREE customization
2018 to 2022 Global DIY Eyelash Extension Market Outlook Compared to 2023 to 2033 Forecast
The cosmetic industry's rapid development, as well as women's willingness to spend on beauty products, is likely to remain a major factor driving the market. As a result, the DIY Eyelash Extension market is expected to grow at a ~7.3% CAGR from 2023 to 2033, compared to a ~4.6% CAGR from 2018 to 2022.
During the forecast period, the DIY eyelashes extension Market is expected to see a growing trend of more prominent eyelashes along with novel beauty products. The growing number of employed women is likely to have a considerable positive impact on the market. In addition, the rapid emergence of social media influencers and the growing popularity of e-commerce are projected to play a significant role in boosting product demand.
Comparative View of Adjacent DIY Eyelash Extension Market
The global DIY eyelash extension market is set to be impacted by the peer, or tangential markets in the industry. These include hair extensions market and heated eyelash curler market. On analysis of these related industries future market insights has found profound insights that will be helpful for developing unique differentiating strategies to pursue for growth and opportunity.
DIY Eyelash Extension Market:
Attribute |
DIY Eyelash Extension Market |
CAGR (2023 to 2033) |
~7.3% |
Market Value (2023) |
US$ 534.0 Million |
Growth Factor |
Increasing Cases of Hair Loss |
Key Trend |
Increased Prevalence of Personal Grooming among Men |
Hair Extensions Market:
Attribute |
Hair Extensions Market |
CAGR (2023 to 2033) |
5.3% |
Market Value (2023) |
US$ 2.5 Billion |
Growth Factor |
Popularity among Geriatric Population |
Key Trend |
Extensive Marketing Campaigns and Celebrity Endorsement |
Heated Eyelash Curler Market:
Attribute |
Hair Restoration Market |
CAGR (2023 to 2033) |
~2.3% |
Market Value (2023) |
US$ 1.3 Billion |
Growth Factor |
Growing Consumer Awareness about the Product |
Key Trend |
Growing Consumer Preference for Higher Quality Product |
Find your sweet spots for generating winning opportunities in this market.
Talk to AnalystKey Dynamics in the DIY Eyelash Extension Market Worldwide
- Digital Marketing Gaining Popularity
The demand for DIY eyelash extensions in the industry is being driven by the quick rise in social media influences and the increased popularity of DIY eyelash extension companies through social media networks. The DIY eyelash extension market sales are driven by some the factors like they are at low –cost alternative to professional eyelash extensions, there is no need to wear as much makeup, many women's everyday make-up routines have changed as a result of it.
Further, it not only gives them the true beauty feelings they always wanted to project, but it also allows them to get ready for nearly any event in no time. These products last longer than traditional false lashes. Some other factors which drive the sales for these products are that they are more comfortable, much lighter, and much more customizable than strip lashes.
- Women are the Driving Force
Women's spending on personal care and well-being items has increased as a result of their changing lifestyles and greater disposable income, which will drive up demand for DIY eyelash extensions. Women's changing lifestyles have increased the rivalry for external beauty, as well as understanding of interior components used in cosmetic product manufacturing.
- Use of Toxic Ingredients
Applying a DIY eyelash extension requires patience and professional work as the glue which is used for applying the extension can harm the consumer’s eyes and might cause eye infections such as conjunctivitis and more such infections. People are growing more and more health conscious and aware about the products they use on their body.
Some manufacturers of low quality products in the market tend to use low quality ingredients which may cause irritation and harm the user’s eyes, which acts as a restrain factor for the growth of DIY eyelash extension market.
Market Statistics |
Details |
Jan to Jun (H1), 2021 (A) |
5.8% |
Jul to Dec (H2), 2021 (A) |
5.9% |
Jan to Jun (H1), 2022 Projected (P) |
5.9% |
Jan to Jun (H1), 2022 Outlook (O) |
6.5% |
Jul to Dec (H2), 2022 Outlook (O) |
6.6% |
Jul to Dec (H2), 2022 Projected (P) |
6.0% |
Jan to Jun (H1), 2023 Projected (P) |
6.4% |
BPS Change: H1, 2022 (O) to H1, 2022 (P) |
(+) 59 |
BPS Change: H1, 2021 (O) to H1, 2022 (A) |
(-) 65 |
BPS Change: H2, 2022 (O) to H2, 2022 (P) |
(+) 60 |
BPS Change: H2, 2021 (O) to H2, 2022 (P) |
(-) 66 |
Country Wise Insight
Country |
USA |
Market Share (2023) |
24.0% |
Market Share (2033) |
15.2% |
BPS Analysis |
(-) 888 |
Country |
Germany |
Market Share (2023) |
4.3% |
Market Share (2033) |
3.2% |
BPS Analysis |
(-) 117 |
Country |
India |
Market Share (2023) |
4.2% |
Market Share (2033) |
7.6% |
BPS Analysis |
(+) 345 |
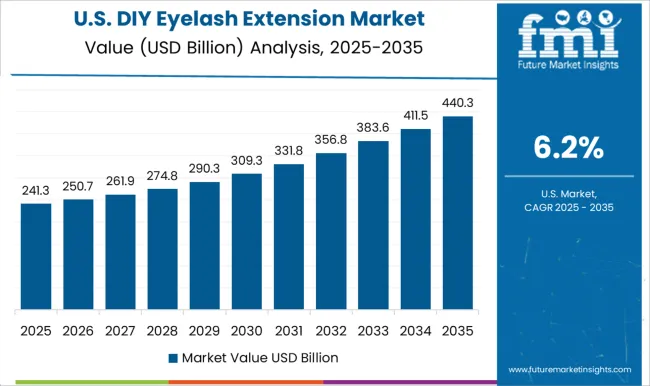
What drives the sales for DIY Eyelashes Extension market in USA?
Consumers and Beauty Influencers are preferring DIY Strip Lashes
The DIY eyelash extension market in the USA is benefiting from an increase in the number of working women and the number of beauty clinics. Due to the rise of beauty vloggers whose videos and Instagram stories demonstrate how to use DIY eyelash extension products, customers are discovering new products and interacting with companies in new ways.
Other factors that are expected to fuel DIY eyelash extension demand include rising per capita spending on personal appearance, a solid regulatory environment, and the rise of beauty products.
What drives the sales for DIY Eyelash Extension market in Germany?
Growing Preference for Online Retail
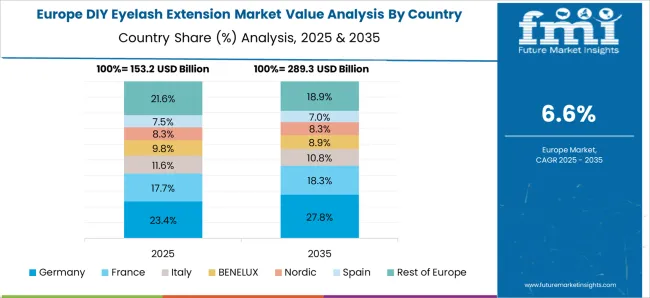
In Europe, Germany have dominated the market for DIY eyelash extension market the reason being Women and younger consumers drive the German DIY eyelash extension industry, since they are prepared to spend more money on such products. Because of their convenient location and vast assortment of mass-market beauty brands, drug shops are the leading distribution channel in the beauty and personal care business in Germany.
What drives the sales for DIY Eyelash Extension market in India?
Increasing Product Promotion by Beauty Influencers
The DIY eyelash extension business is one of India's fastest-growing markets, because to an increase in the embrace of western culture. The adoption of DIY eyelash extension items in the Indian market is expanding as the visual attractiveness of the youthful population grows. In terms of DIY eyelash extension, India is thought to be one of the fastest-growing countries in the South Asia region. Products from other countries have had a significant impact on the Indian market. As far as lifestyle enhancement items go, Indian customers prefer international brands.

A unified Market Research Subscription Platform, built for today's disparate research needs.
Category Wise Insight
What Drives the Sales for Individual DIY Eyelash Extension?
Growing Expenditure on Beauty Products
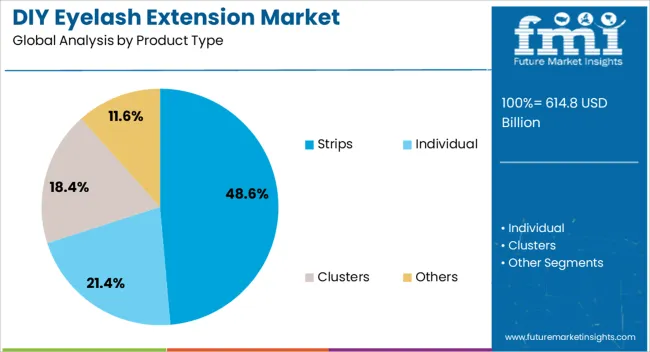
Individual DIY eyelash extension gives more natural looks compared to the other types, and they are easy to apply and remove using only adhesive glue and tweezers when compared with false lashes which are harder to remove and affect natural lashes. Whereas on a regular basis Strip DIY eyelash extensions can look overly thick and false if they aren't applied correctly, or if the buyer chooses heavy fluttery lashes that aren't right for them.
Which is the Most Popular Material Type in DIY Eyelash Extension Market?
Increasing Demand for Natural DIY Eyelash Extensions
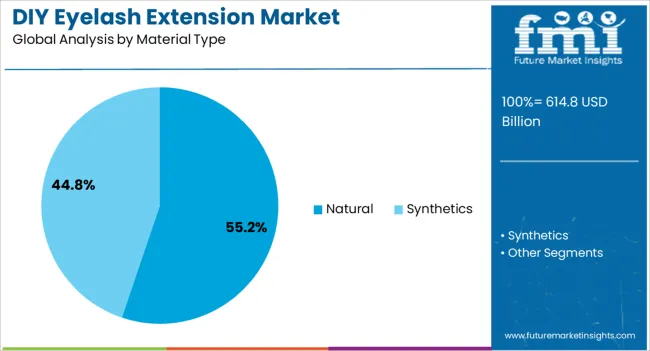
The reason which drives the sales for natural type DIY eyelash extensions is, these are narrower at the tip and thicken as they progress down the lash line. This makes the eyelashes appear fuller and more natural. Natural eyelash extensions, unlike acrylic eyelash extensions, are smooth and easy to wear.
These products last for a span of six to eight weeks compared to others DIY eyelash extension. As they are made from natural products they are not harmful for eyes and skin. However, synthetic material type contributes the major share of about ~68.5% of the global market in 2022.
Which Sales Channel is anticipated to Gain Traction during the Forecast Period?
Online Retailing is anticipated to Gain Traction
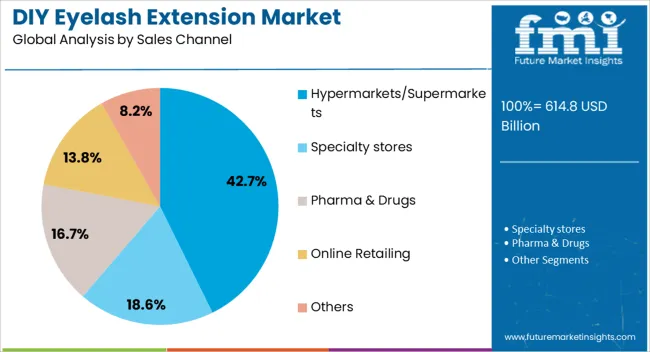
A surge in internet consumption has been recorded since the pandemic. Populations throughout the world are increasingly relying on online platforms for various tasks. The trend of shopping online has also grown at a great extent, as it provides convenience. While, retailers offer massive discounts for shopping online which is attracting more and more customers.
As a result, the online retailing segment is estimated to grow at the fastest rate with a CAGR of ~10.9% during the forecast period.
Competitive Insight
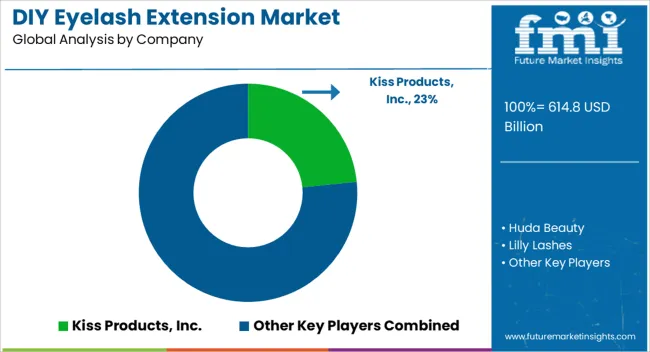
In order to enter regional markets and realize the benefits these attractive markets offer, companies have focused on inorganic growth tactics. Public figures and celebrities are also collaborating with cosmetics businesses to launch new products.
- For Instance, in the Year 2021, XIZI LASHES introduced new range of DIY Eyelash Extension in more than 10 ranges.
Scope of Report
Attribute |
Details |
Forecast Period |
2023 to 2033 |
Historical Data Available for |
2018 to 2022 |
Market Analysis |
US$ Million/Billion for Value |
Key Countries Covered |
|
Key Segments Covered |
|
Key Companies Profiled |
|
Report Coverage |
Market Forecast, Company Share Analysis, Competition Intelligence, DROT Analysis, Market Dynamics and Challenges, and Strategic Growth Initiatives |
Customization & Pricing |
Available upon Request |
Global DIY Eyelash Extension Market by Category
By Product Type, DIY Eyelash Extension Market is segmented as:
- Strips
- Individual
- Clusters
- Others
By Material Type, Global DIY Eyelash Extension Market is segmented as:
- Natural
- Synthetics
By Sales Channel, Global DIY Eyelash Extension Market is segmented as:
- Hypermarkets/Supermarkets
- Specialty stores
- Pharma & Drugs
- Online Retailing
- Others
By Region, Global DIY Eyelash Extension Market is segmented as:
- North America
- Latin America
- Europe
- East Asia
- South Asia
- Oceania
- MEA
Frequently Asked Questions
What is the current DIY eyelash extensions market value?
The DIY eyelash extension market reached a valuation of US$ 534.0 million in 2023.
At what rate did the global DIY eyelash extensions market grow between 2018 and 2022?
The DIY eyelash extension market grew at a sluggish ~4.6% CAGR between 2018 and 2022.
What are the key trends driving DIY eyelash extensions sales?
Growing popularity of online stores, new product launches, and increasing mergers and acquisitions etc., are the key trends in the market.
Who are the leading players in the global DIY eyelash extensions market?
Leading players operating in the global DIY eyelash extension market are Beyelian Lashes, Qingdao Elour Beauty, Emeda eyelash Company, XIZI LASHES, and H.B. Fuller among others.
What will be the demand outlook for North America DIY eyelash extensions market?
The North America DIY eyelash extension market is projected to grow at a ~2.7% CAGR over the forecast period.
What is the market share of the leading players operating in the DIY eyelash extensions market?
Leading players in the global DIY eyelash extension market are estimated to account for approximately ~1.6 % - 6.1% of the total market share.
What is the DIY eyelash extensions demand outlook for Europe?
The Europe DIY eyelash extension market is anticipated to expand at ~4.1% CAGR over the forecast period.
Table of Content
1. Executive Summary | DIY Eyelash Extension Market 1.1. Global Market Outlook 1.2. Summary of Key Statistics 1.3. Summary of Key Findings 1.4. Product Evolution Analysis 1.5. FMI Analysis and Recommendations 2. Market Overview 2.1. Market Taxonomy 2.2. Market Definition 3. Key Market Trends 3.1. Key Trends Impacting the Market 3.2. Winning Themes 3.3. Key Product Development Trends 3.3.1. Product Launches 3.3.2. Acquisition & Mergers 3.3.3. Expansion 4. Global Market Demand Analysis 2018 to 2022 and Forecast, 2023 to 2033 4.1. Historical Market Volume (‘000 Units) Analysis, 2018 to 2022 4.2. Current and Future Market Volume (‘000 Units) Projections, 2023 to 2033 4.3. Y-o-Y Growth Trend Analysis 5. Global Market - Pricing Analysis 5.1. Regional Pricing Analysis By Material Type 5.2. Pricing Break-up 5.2.1. Manufacturer Level Pricing 5.2.2. Distributor Level Pricing 5.3. Global Average Pricing Analysis Benchmark 6. Global Market Demand (in Value or Size in US$ Million) Analysis 2018 to 2022 and Forecast, 2023 to 2033 6.1. Historical Market Value (US$ Million) Analysis, 2018 to 2022 6.2. Current and Future Market Value (US$ Million) Projections, 2023 to 2033 6.2.1. Y-o-Y Growth Trend Analysis 6.2.2. Absolute $ Opportunity Analysis 7. Market Background 7.1. Macro-Economic Factors 7.1.1. Global GDP Growth Outlook 7.1.2. Global Industry Value Added 7.1.3. Global Consumer Spending Outlook 7.1.4. Global E-Commerce Industry Outlook 7.1.5. Per Capital Spending Outlook 7.1.6. Urbanization Growth Outlook 7.1.7. Other Key Macro-Economic Factors 7.2. Industry Value and Supply Chain Analysis 7.3. Forecast Factors - Relevance & Impact 7.3.1. Top Companies Historical Growth 7.3.2. Global Population Growth Outlook 7.3.3. GDP Growth Rate Analysis 7.3.4. Contribution to GDP & Employment 7.3.5. Urbanization Growth Outlook 7.3.6. Manufacturing Sector GVA 7.3.7. Per Capita Disposable Income 7.3.8. Other Key Forecast Factors 7.4. PESTLE Analysis of Market 7.5. Porter’s Five Force 7.6. Investment Feasibility Analysis 7.7. Market Dynamics 7.7.1. Drivers 7.7.2. Restraints 7.7.3. Opportunity Analysis 8. Global Market Analysis 2018 to 2022 and Forecast 2023 to 2033, by Product Type 8.1. Introduction / Key Findings 8.2. Historical Market Size (US$ Million) and Volume Analysis By Product Type, 2018 to 2022 8.3. Current and Future Market Size (US$ Million) and Volume Analysis and Forecast By Product Type, 2023 to 2033 8.3.1. Strips 8.3.2. Individual 8.3.3. Clusters 8.3.4. Others 8.4. Market Attractiveness Analysis By Product Type 9. Global Market Analysis 2018 to 2022 and Forecast 2023 to 2033, by Material Type 9.1. Introduction / Key Findings 9.2. Historical Market Size (US$ Million) and Volume Analysis By Material Type, 2018 to 2022 9.3. Current and Future Market Size (US$ Million) and Volume Analysis and Forecast By Material Type, 2023 to 2033 9.3.1. Natural 9.3.2. Synthetic 9.4. Market Attractiveness Analysis By Material Type 10. Global Market Analysis 2018 to 2022 and Forecast 2023 to 2033, by Sales Channel 10.1. Introduction / Key Findings 10.2. Historical Market Size (US$ Million) and Volume Analysis By Sales Channel, 2018 to 2022 10.3. Current and Future Market Size (US$ Million) and Volume Analysis and Forecast Sales Channel, 2023 to 2033 10.3.1. Hypermarkets/Supermarkets 10.3.2. Specialty Stores 10.3.3. Drug & Pharmacy stores 10.3.4. Online Retailing 10.3.5. Others 10.4. Market Attractiveness Analysis By Sales Channel 11. Global Market Analysis 2018 to 2022 and Forecast 2023 to 2033, by Country 11.1. Introduction 11.2. Historical Market Size (US$ Million) and Volume Analysis By Country, 2018 to 2022 11.3. Current Market Size (US$ Million) and Volume Analysis and Forecast By Country, 2023 to 2033 11.3.1. USA 11.3.2. Canada 11.3.3. Mexico 11.3.4. Argentina 11.3.5. Brazil 11.3.6. Germany 11.3.7. UK 11.3.8. Spain 11.3.9. France 11.3.10. Italy 11.3.11. China 11.3.12. Japan 11.3.13. India 11.3.14. South Korea 11.3.15. Thailand 11.3.16. Indonesia 11.3.17. Malaysia 11.3.18. Singapore 11.3.19. Australia 11.3.20. UAE 11.3.21. KSA 11.3.22. Others (As Requested) 11.4. Market Attractiveness Analysis By Country 12. North America Market Analysis 2018 to 2022 and Forecast 2023 to 2033 12.1. Introduction 12.2. Pricing Analysis 12.3. Historical Market Size (US$ Million) and Volume Trend Analysis By Market Taxonomy, 2018 to 2022 12.4. Market Size (US$ Million) and Volume Forecast By Market Taxonomy, 2023 to 2033 12.4.1. By Country 12.4.1.1. US 12.4.1.2. Canada 12.4.2. By Product Type 12.4.3. By Material Type 12.4.4. By Sales Channel 12.5. Market Attractiveness Analysis 12.5.1. By Country 12.5.2. By Product Type 12.5.3. By Material Type 12.5.4. By Sales Channel 12.6. Market Trends 12.7. Key Market Participants - Intensity Mapping 12.8. Drivers and Restraints - Impact Analysis 13. Latin America Market Analysis 2018 to 2022 and Forecast 2023 to 2033 13.1. Introduction 13.2. Pricing Analysis 13.3. Historical Market Size (US$ Million) and Volume Trend Analysis By Market Taxonomy, 2018 to 2022 13.4. Market Size (US$ Million) and Volume Forecast By Market Taxonomy, 2023 to 2033 13.4.1. By Country 13.4.1.1. Brazil 13.4.1.2. Mexico 13.4.1.3. Rest of Latin America 13.4.2. By Product Type 13.4.3. By Material Type 13.4.4. By Sales Channel 13.5. Market Attractiveness Analysis 13.5.1. By Country 13.5.2. By Product Type 13.5.3. By Material Type 13.5.4. By Sales Channel 13.6. Market Trends 13.7. Key Market Participants - Intensity Mapping 13.8. Drivers and Restraints - Impact Analysis 14. Europe Market Analysis 2018 to 2022 and Forecast 2023 to 2033 14.1. Introduction 14.2. Pricing Analysis 14.3. Historical Market Size (US$ Million) and Volume Trend Analysis By Market Taxonomy, 2018 to 2022 14.4. Market Size (US$ Million) and Volume Forecast By Market Taxonomy, 2023 to 2033 14.4.1. By Country 14.4.1.1. United kingdom 14.4.1.2. France 14.4.1.3. Germany 14.4.1.4. Italy 14.4.1.5. Spain 14.4.1.6. Rest of Europe 14.4.2. By Product Type 14.4.3. By Material Type 14.4.4. By Sales Channel 14.5. Market Attractiveness Analysis 14.5.1. By Country 14.5.2. By Product Type 14.5.3. By Material Type 14.5.4. By Sales Channel 14.6. Market Trends 14.7. Key Market Participants - Intensity Mapping 14.8. Drivers and Restraints - Impact Analysis 15. East Asia Market Analysis 2018 to 2022 and Forecast 2023 to 2033 15.1. Introduction 15.2. Pricing Analysis 15.3. Historical Market Size (US$ Million) and Volume Trend Analysis By Market Taxonomy, 2018 to 2022 15.4. Market Size (US$ Million) and Volume Forecast By Market Taxonomy, 2023 to 2033 15.4.1. By Country 15.4.1.1. China 15.4.1.2. Japan 15.4.1.3. South Korea 15.4.2. By Product Type 15.4.3. By Material Type 15.4.4. By Sales Channel 15.5. Market Attractiveness Analysis 15.5.1. By Country 15.5.2. By Product Type 15.5.3. By Material Type 15.5.4. By Sales Channel 15.6. Market Trends 15.7. Key Market Participants - Intensity Mapping 15.8. Drivers and Restraints - Impact Analysis 16. South Asia Market Analysis 2018 to 2022 and Forecast 2023 to 2033 16.1. Introduction 16.2. Pricing Analysis 16.3. Historical Market Size (US$ Million) and Volume Trend Analysis By Market Taxonomy, 2018 to 2022 16.4. Market Size (US$ Million) and Volume Forecast By Market Taxonomy, 2023 to 2033 16.4.1. By Country 16.4.1.1. India 16.4.1.2. Indonesia 16.4.1.3. Malaysia 16.4.1.4. Thailand 16.4.1.5. Rest of South Asia 16.4.2. By Product Type 16.4.3. By Material Type 16.4.4. By Sales Channel 16.5. Market Attractiveness Analysis 16.5.1. By Country 16.5.2. By Product Type 16.5.3. By Material Type 16.5.4. By Sales Channel 16.6. Market Trends 16.7. Key Market Participants - Intensity Mapping 16.8. Drivers and Restraints - Impact Analysis 17. Oceania Market Analysis 2018 to 2022 and Forecast 2023 to 2033 17.1. Introduction 17.2. Pricing Analysis 17.3. Historical Market Size (US$ Million) and Volume Trend Analysis By Market Taxonomy, 2018 to 2022 17.4. Market Size (US$ Million) and Volume Forecast By Market Taxonomy, 2023 to 2033 17.4.1. By Country 17.4.1.1. Australia 17.4.1.2. New Zealand 17.4.2. By Product Type 17.4.3. By Material Type 17.4.4. By Sales Channel 17.5. Market Attractiveness Analysis 17.5.1. By Country 17.5.2. By Product Type 17.5.3. By Material Type 17.5.4. By Sales Channel 17.6. Market Trends 17.7. Key Market Participants - Intensity Mapping 17.8. Drivers and Restraints - Impact Analysis 18. MEA Market Analysis 2018 to 2022 and Forecast 2023 to 2033 18.1. Introduction 18.2. Pricing Analysis 18.3. Historical Market Size (US$ Million) and Volume Trend Analysis By Market Taxonomy, 2018 to 2022 18.4. Market Size (US$ Million) and Volume Forecast By Market Taxonomy, 2023 to 2033 18.4.1. By Country 18.4.1.1. GCC Countries 18.4.1.2. South Africa 18.4.1.3. North Africa 18.4.1.4. Rest of MEA 18.4.2. By Product Type 18.4.3. By Material Type 18.4.4. By Sales Channel 18.5. Market Attractiveness Analysis 18.5.1. By Country 18.5.2. By Product Type 18.5.3. By Material Type 18.5.4. By Sales Channel 18.6. Market Trends 18.7. Key Market Participants - Intensity Mapping 18.8. Drivers and Restraints - Impact Analysis 19. Market Structure Analysis 19.1. Market Analysis by Tier of Companies (DIY Eyelash Extension) 19.2. Market Concentration 19.3. Market Share Analysis of Top Players 19.4. Market Presence Analysis 19.4.1. By Regional footprint of Players 19.4.2. Product foot print by Players 19.4.3. Channel Foot Print by Players 20. Competition Analysis 20.1. Competition Dashboard 20.2. Pricing Analysis by Competition 20.3. Competition Benchmarking 20.4. Competition Deep Dive 20.4.1. Kiss Products, Inc. 20.4.1.1. Overview 20.4.1.2. Product Portfolio 20.4.1.3. Profitability by Market Segments (Product/Channel/Region) 20.4.1.4. Sales Footprint 20.4.1.5. Strategy Overview 20.4.2. Huda Beauty 20.4.2.1. Overview 20.4.2.2. Product Portfolio 20.4.2.3. Profitability by Market Segments (Product/Channel/Region) 20.4.2.4. Sales Footprint 20.4.2.5. Strategy Overview 20.4.3. Lilly Lashes 20.4.3.1. Overview 20.4.3.2. Product Portfolio 20.4.3.3. Profitability by Market Segments (Product/Channel/Region) 20.4.3.4. Sales Footprint 20.4.3.5. Strategy Overview 20.4.4. Babil Lashes Factory Company KORRES SA 20.4.4.1. Overview 20.4.4.2. Product Portfolio 20.4.4.3. Profitability by Market Segments (Product/Channel/Region) 20.4.4.4. Sales Footprint 20.4.4.5. Strategy Overview 20.4.5. Lashview Beauty 20.4.5.1. Overview 20.4.5.2. Product Portfolio 20.4.5.3. Profitability by Market Segments (Product/Channel/Region) 20.4.5.4. Sales Footprint 20.4.5.5. Strategy Overview 20.4.6. I-ENVY by Kiss 20.4.6.1. Overview 20.4.6.2. Product Portfolio 20.4.6.3. Profitability by Market Segments (Product/Channel/Region) 20.4.6.4. Sales Footprint 20.4.6.5. Strategy Overview 20.4.7. Calailis Beauty 20.4.7.1. Overview 20.4.7.2. Product Portfolio 20.4.7.3. Profitability by Market Segments (Product/Channel/Region) 20.4.7.4. Sales Footprint 20.4.7.5. Strategy Overview 20.4.8. Beyelian Lashes 20.4.8.1. Overview 20.4.8.2. Product Portfolio 20.4.8.3. Profitability by Market Segments (Product/Channel/Region) 20.4.8.4. Sales Footprint 20.4.8.5. Strategy Overview 20.4.9. Qingdao Elour Beauty 20.4.9.1. Overview 20.4.9.2. Product Portfolio 20.4.9.3. Profitability by Market Segments (Product/Channel/Region) 20.4.9.4. Sales Footprint 20.4.9.5. Strategy Overview 20.4.10. Emeda eyelash Company 20.4.10.1. Overview 20.4.10.2. Product Portfolio 20.4.10.3. Profitability by Market Segments (Product/Channel/Region) 20.4.10.4. Sales Footprint 20.4.10.5. Strategy Overview 20.4.11. XIZI LASHES BIOMILK™ Skincare 20.4.11.1. Overview 20.4.11.2. Product Portfolio 20.4.11.3. Profitability by Market Segments (Product/Channel/Region) 20.4.11.4. Sales Footprint 20.4.11.5. Strategy Overview 20.4.12. H.B. Fuller Company 20.4.12.1. Overview 20.4.12.2. Product Portfolio 20.4.12.3. Profitability by Market Segments (Product/Channel/Region) 20.4.12.4. Sales Footprint 20.4.12.5. Strategy Overview 20.4.13. Others 20.4.13.1. Overview 20.4.13.2. Product Portfolio 20.4.13.3. Profitability by Market Segments (Product/Channel/Region) 20.4.13.4. Sales Footprint 20.4.13.5. Strategy Overview 21. Assumptions and Acronyms Used 22. Research Methodology
Let us know your requirement to get
100% FREE customization
List of Tables
Table 1: Global Market Value (US$ Million) Forecast by Region, 2018 to 2033 Table 2: Global Market Volume (‘000 Units) Forecast by Region, 2018 to 2033 Table 3: Global Market Value (US$ Million) Forecast by Product Type, 2018 to 2033 Table 4: Global Market Volume (‘000 Units) Forecast by Product Type, 2018 to 2033 Table 5: Global Market Value (US$ Million) Forecast by Material Type, 2018 to 2033 Table 6: Global Market Volume (‘000 Units) Forecast by Material Type, 2018 to 2033 Table 7: Global Market Value (US$ Million) Forecast, By Sales Channel, 2018 to 2033 Table 8: Global Market Volume (‘000 Units) Forecast, By Sales Channel, 2018 to 2033 Table 9: North America Market Value (US$ Million) Forecast, By Country, 2018 to 2033 Table 10: North America Market Volume (‘000 Units) Forecast, By Country, 2018 to 2033 Table 11: North America Market Value (US$ Million) Forecast by Product Type, 2018 to 2033 Table 12: North America Market Volume (‘000 Units) Forecast by Product Type, 2018 to 2033 Table 13: North America Market Value (US$ Million) Forecast by Material Type, 2018 to 2033 Table 14: North America Market Volume (‘000 Units) Forecast, By Material Type, 2018 to 2033 Table 15: North America Market Value (US$ Million) Forecast, By Sales Channel, 2018 to 2033 Table 16: North America Market Volume (‘000 Units) Forecast, By Sales Channel, 2018 to 2033 Table 17: Latin America Market Value (US$ Million) Forecast, By Country, 2018 to 2033 Table 18: Latin America Market Volume (‘000 Units) Forecast, By Country, 2018 to 2033 Table 19: Latin America Market Value (US$ Million) Forecast by Product Type, 2018 to 2033 Table 20: Latin America Market Volume (‘000 Units) Forecast by Product Type, 2018 to 2033 Table 21: Latin America Market Value (US$ Million) Forecast by Material Type, 2018 to 2033 Table 22: Latin America Market Volume (‘000 Units) Forecast, By Material Type, 2018 to 2033 Table 23: Latin America Market Value (US$ Million) Forecast, By Sales Channel, 2018 to 2033 Table 24: Latin America Market Volume (‘000 Units) Forecast, By Sales Channel, 2018 to 2033 Table 25: Europe Market Value (US$ Million) Forecast, By Country, 2018 to 2033 Table 26: Europe Market Volume (‘000 Units) Forecast, By Country, 2018 to 2033 Table 27: Europe Market Value (US$ Million) Forecast by Product Type, 2018 to 2033 Table 28: Europe Market Volume (‘000 Units) Forecast by Product Type, 2018 to 2033 Table 29: Europe Market Value (US$ Million) Forecast by Material Type, 2018 to 2033 Table 30: Europe Market Volume (‘000 Units) Forecast, By Material Type, 2018 to 2033 Table 31: Europe Market Value (US$ Million) Forecast, By Sales Channel, 2018 to 2033 Table 32: Europe Market Volume (‘000 Units) Forecast, By Sales Channel, 2018 to 2033 Table 33: East Asia Market Value (US$ Million) Forecast, By Country, 2018 to 2033 Table 34: East Asia Market Volume (‘000 Units) Forecast, By Country, 2018 to 2033 Table 35: East Asia Market Value (US$ Million) Forecast by Product Type, 2018 to 2033 Table 36: East Asia Market Volume (‘000 Units) Forecast by Product Type, 2018 to 2033 Table 37: East Asia Market Value (US$ Million) Forecast by Material Type, 2018 to 2033 Table 38: East Asia Market Volume (‘000 Units) Forecast, By Material Type, 2018 to 2033 Table 39: East Asia Market Value (US$ Million) Forecast, By Sales Channel, 2018 to 2033 Table 40: East Asia Market Volume (‘000 Units) Forecast, By Sales Channel, 2018 to 2033 Table 41: South Asia Market Value (US$ Million) Forecast, By Country, 2018 to 2033 Table 42: South Asia Market Volume (‘000 Units) Forecast, By Country, 2018 to 2033 Table 43: South Asia Market Value (US$ Million) Forecast by Product Type, 2018 to 2033 Table 44: South Asia Market Volume (‘000 Units) Forecast by Product Type, 2018 to 2033 Table 45: South Asia Market Value (US$ Million) Forecast by Material Type, 2018 to 2033 Table 46: South Asia Market Volume (‘000 Units) Forecast, By Material Type, 2018 to 2033 Table 47: South Asia Market Value (US$ Million) Forecast, By Sales Channel, 2018 to 2033 Table 48: South Asia Market Volume (‘000 Units) Forecast, By Sales Channel, 2018 to 2033 Table 49: Oceania Market Value (US$ Million) Forecast, By Country, 2018 to 2033 Table 50: Oceania Market Volume (‘000 Units) Forecast, By Country, 2018 to 2033 Table 51: Oceania Market Value (US$ Million) Forecast by Product Type, 2018 to 2033 Table 52: Oceania Market Volume (‘000 Units) Forecast by Product Type, 2018 to 2033 Table 53: Oceania Market Value (US$ Million) Forecast by Material Type, 2018 to 2033 Table 54: Oceania Market Volume (‘000 Units) Forecast, By Material Type, 2018 to 2033 Table 55: Oceania Market Value (US$ Million) Forecast, By Sales Channel, 2018 to 2033 Table 56: Oceania Market Volume (‘000 Units) Forecast, By Sales Channel, 2018 to 2033 Table 57: MEA Market Value (US$ Million) Forecast, By Country, 2018 to 2033 Table 58: MEA Market Volume (‘000 Units) Forecast, By Country, 2018 to 2033 Table 59: MEA Market Value (US$ Million) Forecast by Product Type, 2018 to 2033 Table 60: MEA Market Volume (‘000 Units) Forecast by Product Type, 2018 to 2033 Table 61: MEA Market Value (US$ Million) Forecast by Material Type, 2018 to 2033 Table 62: MEA Market Volume (‘000 Units) Forecast, By Material Type, 2018 to 2033 Table 63: MEA Market Value (US$ Million) Forecast, By Sales Channel, 2018 to 2033 Table 64: MEA Market Volume (‘000 Units) Forecast, By Sales Channel, 2018 to 2033
Find your sweet spots for generating winning opportunities in this market.
Talk to AnalystList of Charts
Figure 01: Global Market Value (US$ Million) and Volume (‘000 Units) Analysis, 2018 to 2022 Figure 02: Global Market Value (US$ Million) and Volume (‘000 Units) Forecast, 2023 to 2033 Figure 03: Global Market Value (US$ Million) Analysis, 2018 to 2022 Figure 04: Global Market Value (US$ Million) Forecast, 2023 to 2033 Figure 05: Global Market Absolute $ Opportunity Value (US$ Million), 2023 to 2033 Figure 06: Global Market Value (US$ Million) Analysis by Product Type, 2018 to 2033 Figure 07: Global Market Volume (‘000 Units) Analysis by Product Type, 2018 to 2033 Figure 08: Global Market Y-o-Y Growth (%) Projections, By Product Type, 2023 to 2033 Figure 09: Global Market Attractiveness by Product Type, 2023 to 2033 Figure 10: Global Market Value (US$ Million) Analysis by Material Type, 2018 to 2033 Figure 11: Global Market Volume (‘000 Units) Analysis by Material Type, 2018 to 2033 Figure 12: Global Market Y-o-Y Growth (%) Projections, By Material Type, 2023 to 2033 Figure 13: Global Market Attractiveness by Material Type, 2023 to 2033 Figure 14: Global Market Value (US$ Million) Analysis by Sales Channel, 2018 to 2033 Figure 15: Global Market Volume (‘000 Units) Analysis by Sales Channel, 2018 to 2033 Figure 16: Global Market Y-o-Y Growth (%) Projections, By Sales Channel, 2023 to 2033 Figure 17: Global Market Attractiveness by Sales Channel, 2023 to 2033 Figure 18: Global Market Value (US$ Million) Analysis by Region, 2018 to 2033 Figure 19: Global Market Volume (‘000 Units) Analysis by Region, 2018 to 2033 Figure 20: Global Market Y-o-Y Growth (%) Projections, By Region, 2023 to 2033 Figure 21: Global Market Attractiveness by Region, 2023 to 2033 Figure 22: North America Market Value (US$ Million) Analysis by Country, 2018 to 2033 Figure 23: North America Market Volume (‘000 Units) Analysis by Country, 2018 to 2033 Figure 24: North America Market Y-o-Y Growth (%) Projections, By Country, 2023 to 2033 Figure 25: North America Market Attractiveness by Country, 2023 to 2033 Figure 26: North America Market Value (US$ Million) Analysis by Product Type, 2018 to 2033 Figure 27: North America Market Volume (‘000 Units) Analysis by Product Type, 2018 to 2033 Figure 28: North America Market Y-o-Y Growth (%) Projections, By Product Type, 2023 to 2033 Figure 29: North America Market Attractiveness by Product Type, 2023 to 2033 Figure 30: North America Market Value (US$ Million) Analysis by Material Type, 2018 to 2033 Figure 31: North America Market Volume (‘000 Units) Analysis by Material Type, 2018 to 2033 Figure 32: North America Market Y-o-Y Growth (%) Projections, By Material Type, 2023 to 2033 Figure 33: North America Market Attractiveness by Material Type, 2023 to 2033 Figure 34: North America Market Value (US$ Million) Analysis by Sales Channel, 2018 to 2033 Figure 35: North America Market Volume (‘000 Units) Analysis by Sales Channel, 2018 to 2033 Figure 36: North America Market Y-o-Y Growth (%) Projections, By Sales Channel, 2023 to 2033 Figure 37: North America Market Attractiveness by Sales Channel, 2023 to 2033 Figure 38: Latin America Market Value (US$ Million) Analysis by Country, 2018 to 2033 Figure 39: Latin America Market Volume (‘000 Units) Analysis by Country, 2018 to 2033 Figure 40: Latin America Market Y-o-Y Growth (%) Projections, By Country, 2023 to 2033 Figure 41: Latin America Market Attractiveness by Country, 2023 to 2033 Figure 42: Latin America Market Value (US$ Million) Analysis by Product Type, 2018 to 2033 Figure 43: Latin America Market Volume (‘000 Units) Analysis by Product Type, 2018 to 2033 Figure 44: Latin America Market Y-o-Y Growth (%) Projections, By Product Type, 2023 to 2033 Figure 45: Latin America Market Attractiveness by Product Type, 2023 to 2033 Figure 46: Latin America Market Value (US$ Million) Analysis by Material Type, 2018 to 2033 Figure 47: Latin America Market Volume (‘000 Units) Analysis by Material Type, 2018 to 2033 Figure 48: Latin America Market Y-o-Y Growth (%) Projections, By Material Type, 2023 to 2033 Figure 49: Latin America Market Attractiveness by Material Type, 2023 to 2033 Figure 50: Latin America Market Value (US$ Million) Analysis by Sales Channel, 2018 to 2033 Figure 51: Latin America Market Volume (‘000 Units) Analysis by Sales Channel, 2018 to 2033 Figure 52: Latin America Market Y-o-Y Growth (%) Projections, By Sales Channel, 2023 to 2033 Figure 53: Latin America Market Attractiveness by Sales Channel, 2023 to 2033 Figure 54: Europe Market Value (US$ Million) Analysis by Country, 2018 to 2033 Figure 55: Europe Market Volume (‘000 Units) Analysis by Country, 2018 to 2033 Figure 56: Europe Market Y-o-Y Growth (%) Projections, By Country, 2023 to 2033 Figure 57: Europe Market Attractiveness by Country, 2023 to 2033 Figure 58: Europe Market Value (US$ Million) Analysis by Product Type, 2018 to 2033 Figure 59: Europe Market Volume (‘000 Units) Analysis by Product Type, 2018 to 2033 Figure 60: Europe Market Y-o-Y Growth (%) Projections, By Product Type, 2023 to 2033 Figure 61: Europe Market Attractiveness by Product Type, 2023 to 2033 Figure 62: Europe Market Value (US$ Million) Analysis by Material Type, 2018 to 2033 Figure 63: Europe Market Volume (‘000 Units) Analysis by Material Type, 2018 to 2033 Figure 64: Europe Market Y-o-Y Growth (%) Projections, By Material Type, 2023 to 2033 Figure 65: Europe Market Attractiveness by Material Type, 2023 to 2033 Figure 66: Europe Market Value (US$ Million) Analysis by Sales Channel, 2018 to 2033 Figure 67: Europe Market Volume (‘000 Units) Analysis by Sales Channel, 2018 to 2033 Figure 68: Europe Market Y-o-Y Growth (%) Projections, By Sales Channel, 2023 to 2033 Figure 69: Europe Market Attractiveness by Sales Channel, 2023 to 2033 Figure 70: East Asia Market Value (US$ Million) Analysis by Country, 2018 to 2033 Figure 71: East Asia Market Volume (‘000 Units) Analysis by Country, 2018 to 2033 Figure 72: East Asia Market Y-o-Y Growth (%) Projections, By Country, 2023 to 2033 Figure 73: East Asia Market Attractiveness by Country, 2023 to 2033 Figure 74: East Asia Market Value (US$ Million) Analysis by Product Type, 2018 to 2033 Figure 75: East Asia Market Volume (‘000 Units) Analysis by Product Type, 2018 to 2033 Figure 76: East Asia Market Y-o-Y Growth (%) Projections, By Product Type, 2023 to 2033 Figure 77: East Asia Market Attractiveness by Product Type, 2023 to 2033 Figure 78: East Asia Market Value (US$ Million) Analysis by Material Type, 2018 to 2033 Figure 79: East Asia Market Volume (‘000 Units) Analysis by Material Type, 2018 to 2033 Figure 80: East Asia Market Y-o-Y Growth (%) Projections, By Material Type, 2023 to 2033 Figure 81: East Asia Market Attractiveness by Material Type, 2023 to 2033 Figure 82: East Asia Market Value (US$ Million) Analysis by Sales Channel, 2018 to 2033 Figure 83: East Asia Market Volume (‘000 Units) Analysis by Sales Channel, 2018 to 2033 Figure 84: East Asia Market Y-o-Y Growth (%) Projections, By Sales Channel, 2023 to 2033 Figure 85: East Asia Market Attractiveness by Sales Channel, 2023 to 2033 Figure 86: South Asia Market Value (US$ Million) Analysis by Country, 2018 to 2033 Figure 87: South Asia Market Volume (‘000 Units) Analysis by Country, 2018 to 2033 Figure 88: South Asia Market Y-o-Y Growth (%) Projections, By Country, 2023 to 2033 Figure 89: South Asia Market Attractiveness by Country, 2023 to 2033 Figure 90: South Asia Market Value (US$ Million) Analysis by Product Type, 2018 to 2033 Figure 91: South Asia Market Volume (‘000 Units) Analysis by Product Type, 2018 to 2033 Figure 92: South Asia Market Y-o-Y Growth (%) Projections, By Product Type, 2023 to 2033 Figure 93: South Asia Market Attractiveness by Product Type, 2023 to 2033 Figure 94: South Asia Market Value (US$ Million) Analysis by Material Type, 2018 to 2033 Figure 95: South Asia Market Volume (‘000 Units) Analysis by Material Type, 2018 to 2033 Figure 96: South Asia Market Y-o-Y Growth (%) Projections, By Material Type, 2023 to 2033 Figure 97: South Asia Market Attractiveness by Material Type, 2023 to 2033 Figure 98: South Asia Market Value (US$ Million) Analysis by Sales Channel, 2018 to 2033 Figure 99: South Asia Market Volume (‘000 Units) Analysis by Sales Channel, 2018 to 2033 Figure 100: South Asia Market Y-o-Y Growth (%) Projections, By Sales Channel, 2023 to 2033 Figure 101: South Asia Market Attractiveness by Sales Channel, 2023 to 2033 Figure 102: Oceania Market Value (US$ Million) Analysis by Country, 2018 to 2033 Figure 103: Oceania Market Volume (‘000 Units) Analysis by Country, 2018 to 2033 Figure 104: Oceania Market Y-o-Y Growth (%) Projections, By Country, 2023 to 2033 Figure 105: Oceania Market Attractiveness by Country, 2023 to 2033 Figure 106: Oceania Market Value (US$ Million) Analysis by Product Type, 2018 to 2033 Figure 107: Oceania Market Volume (‘000 Units) Analysis by Product Type, 2018 to 2033 Figure 108: Oceania Market Y-o-Y Growth (%) Projections, By Product Type, 2023 to 2033 Figure 109: Oceania Market Attractiveness by Product Type, 2023 to 2033 Figure 110: Oceania Market Value (US$ Million) Analysis by Material Type, 2018 to 2033 Figure 111: Oceania Market Volume (‘000 Units) Analysis by Material Type, 2018 to 2033 Figure 112: Oceania Market Y-o-Y Growth (%) Projections, By Material Type, 2023 to 2033 Figure 113: Oceania Market Attractiveness by Material Type, 2023 to 2033 Figure 114: Oceania Market Value (US$ Million) Analysis by Sales Channel, 2018 to 2033 Figure 115: Oceania Market Volume (‘000 Units) Analysis by Sales Channel, 2018 to 2033 Figure 116: Oceania Market Y-o-Y Growth (%) Projections, By Sales Channel, 2023 to 2033 Figure 117: Oceania Market Attractiveness by Sales Channel, 2023 to 2033 Figure 118: MEA Market Value (US$ Million) Analysis by Country, 2018 to 2033 Figure 119: MEA Market Volume (‘000 Units) Analysis by Country, 2018 to 2033 Figure 120: MEA Market Y-o-Y Growth (%) Projections, By Country, 2023 to 2033 Figure 121: MEA Market Attractiveness by Country, 2023 to 2033 Figure 122: MEA Market Value (US$ Million) Analysis by Product Type, 2018 to 2033 Figure 123: MEA Market Volume (‘000 Units) Analysis by Product Type, 2018 to 2033 Figure 124: MEA Market Y-o-Y Growth (%) Projections, By Product Type, 2023 to 2033 Figure 125: MEA Market Attractiveness by Product Type, 2023 to 2033 Figure 126: MEA Market Value (US$ Million) Analysis by Material Type, 2018 to 2033 Figure 127: MEA Market Volume (‘000 Units) Analysis by Material Type, 2018 to 2033 Figure 128: MEA Market Y-o-Y Growth (%) Projections, By Material Type, 2023 to 2033 Figure 129: MEA Market Attractiveness by Material Type, 2023 to 2033 Figure 130: MEA Market Value (US$ Million) Analysis by Sales Channel, 2018 to 2033 Figure 131: MEA Market Volume (‘000 Units) Analysis by Sales Channel, 2018 to 2033 Figure 132: MEA Market Y-o-Y Growth (%) Projections, By Sales Channel, 2023 to 2033 Figure 133: MEA Market Attractiveness by Sales Channel, 2023 to 2033
Need specific information?
Request CustomizationExplore Consumer Product Insights
View Reports