Reports

- Global Locations -

Headquarters

Future Market Insights, Inc.

Christiana Corporate, 200
Continental Drive, Suite 401,
Newark, Delaware - 19713,
United States

T: +1-845-579-5705

Americas

Future Market Insights, Inc.

616 Corporate Way, Suite 2-9018,
Valley Cottage, NY 10989, United States

T: +1-347-918-3531

MEA

Future Market Insights

1602-6 Jumeirah Bay X2 Tower, Plot No: JLT-PH2-X2A,
Jumeirah Lakes Towers, Dubai,
United Arab Emirates

Europe

Future Market Insights

3rd Floor, 207 Regent Street,
W1B 3HH London
United Kingdom

T: + 44 (0) 20 8123 9659
D: +44 (0) 20 3287 4268

Asia Pacific

Future Market Insights

IndiaLand Global Tech Park, Unit UG-1, Behind Grand HighStreet, Phase 1, Hinjawadi, MH, Pune – 411057, India

DIY Ball Mill Market Outlook (2023 to 2033)

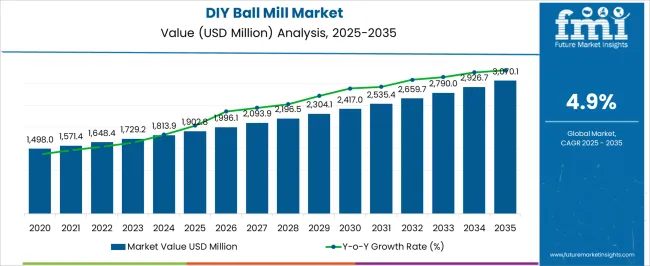
During the forecast period between 2023 and 2033, the global DIY ball mill market is anticipated to exceed a CAGR of 4.9%. The value of the market is expected to surge from US$ 1,729.2 million in 2023 to US$ 2,790.0 million by 2033.

DIY ball mills are referred to as novel instrument that is capable of grinding a wide range of materials into an incredibly fine powder form. These mills are extensively utilized in ceramics, selective laser sintering, mineral dressing, paints, and pyrotechnics. The idea of impact and attrition governs how a homemade ball mill operates. As these balls fall from near the top of shells, size reduction is accomplished by impact.

Building a DIY ball mill is considered to be a very upfront method, even though accuracy is still required. A cylinder, which is often made of steel, a liner that is typically made of rubber or ceramic, balls made of different materials depending on the application, and a drive system make up the primary components. Together, these components help to turn the cylinder. The cylinder must first be trimmed to the required length for operation.

Increasing demand for planetary ball mills among companies for grinding solvent-free samples is expected to drive sales in the next ten years. Planetary ball mills are set to be an attractive synthesis solution that would help to prevent waste generated by chemicals. They would also help to ensure a less hazardous and safe environment.

Key players are expected to initiate innovations in the field of DIY ball mills by integrating drive systems, as well as alternatives for fixed speed options and variable speed solutions to offer customization to every user as per their requirements. The inclusion of variable speed or inching by ball mill manufacturers is projected to enable the rotation of mills to slow down, thereby allowing users to replace liners present in the mills safely.

Attributes Key Insights
DIY Ball Mill Market Estimated Size (2023E) US$ 1,729.2 million
Projected Market Valuation (2033F) US$ 2,790.0 million
Value-based CAGR (2023 to 2033) 4.9%
The United States DIY Ball Mill Market Share 35.0%

Don't pay for what you don't need

Customize your report by selecting specific countries or regions and save 30%!

2018 to 2022 DIY Ball Mill Market Outlook Compared to 2023 to 2033 Demand Forecast

The global market for DIY ball mills reached a valuation of US$ 1,648.4 million in 2022 from US$ 1,325.6 million in 2018. The observed CAGR during the historical period (2018­ ­to 2022) was 5.6%, and this growth was mainly driven by the increasing popularity of home brewing and rapid adoption of the DIY culture among gen z and millennials.

There is a wide range of factors driving growth in the global DIY ball mill market. The increasing popularity of home brewing is estimated to be one of the leading factors behind the growth. Home brewing is considered to be a primary hobby that has seen renewed interest in recent years, thanks to the rise of the craft beer industry. The immense popularity and availability of home brewing kits is another crucial factor that has eventually led to increasing demand for DIY ball mills, as they are necessary for crushing malt grains into powder form.

DIY Ball Mill Market

Market-o-Nomics -Highlighting the Key Trends

A wide range of influential factors has been evaluated to stir the soup in the DIY ball mill industry. Analysts at Future Market Insights have analyzed the restraining elements, lucrative opportunities, and upcoming threats that can pose a challenge to the progression of the market for DIY ball mills.

The drivers, restraints, opportunities, and threats identified are as follows:

DRIVERS

  • DIY ball mills are capable of producing fine powder and particle sizes can be equal to or less than 10 microns, which would boost sales.
  • DIY ball mills are considered to be ideal for milling numerous toxic materials as they are utilized in a completely enclosed form, which would drive demand.

RESTRAINTS

  • Owing to wear and tear occurring partially from the casing or from the balls, contamination of products may take place.
  • If the cylinder is made out of metal, a high machine noise level can be expected, which may hamper their demand.

OPPORTUNITIES

  • Key players are set to develop stainless steel balls as they are highly preferred for the manufacturing of parenteral and ophthalmic products.
  • Leading companies are expected to come up with new DIY ball mills for the grinding of abrasive and hard materials.

THREATS

  • Energy consumption is relatively large in a few DIY ball mills, which may hinder sales among small-scale companies.
  • DIY ball mills can often stain products because of grinding them among loss of friction.
Nandini Roy Choudhury

Principal Consultant

Talk to Analyst

Find your sweet spots for generating winning opportunities in this market.

Country-wise Insights

Why is Demand for DIY Ball Mills Increasing Astonishingly in the USA?

Adoption of Grinding Mills to Surge among Hobbyists in the USA for Developing Metalworking Projects

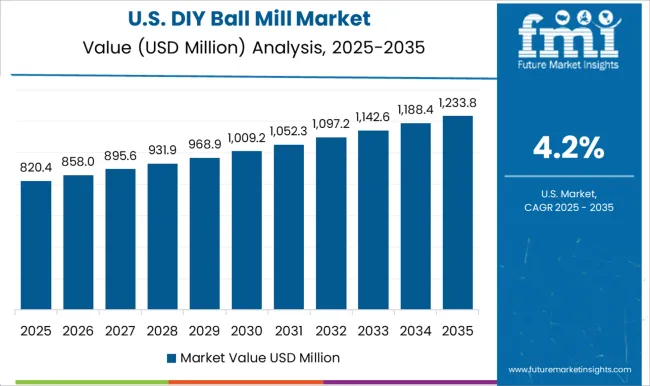
The USA DIY ball mill market is estimated to hold 69.8% of the share across North America, says Future Market Insights. The DIY ball mill market is developing rapidly across the USA. Hobbyists and amateur machinists in the country are increasingly turning to ball mills as a way to create their own unique metalworking projects.

There are numerous reasons for the high popularity of DIY ball mills in the USA. The first is that they are relatively simple to build from scratch. Secondly, ball mills can be used to create a wide variety of metalworking projects, right from small parts to large sculptures. Lastly, ball mills are relatively inexpensive, making them a great option for hobbyists and amateurs alike.
How are DIY Ball Mill Companies Progressing in the United Kingdom and Germany?

Demand for Grinding Equipment to Catapult in Germany and the United Kingdom as Popularity of DIY Tutorials Surges

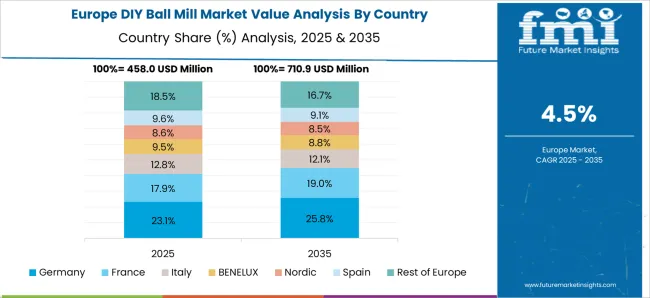
The DIY ball mill market in Europe is set to escalate rapidly as consumers look for new ways to cut costs and take on home improvement projects themselves. The popularity of DIY TV shows and online tutorials has made DIY projects more accessible than ever before across Germany and the United Kingdom. Owing to the aforementioned factors, Germany is estimated to hold 26.6% of the Europe market share in 2023, while the United Kingdom is projected to expand at a CAGR of 6.4% over the estimated period (2023 ­to 2033).

Why are Sales of DIY Ball Mills Skyrocketing in China and India?

The trend for Home Brewing of Beer to Boost Sales of Planetary Ball Mills across India and China

The market for DIY ball mills is likely to surge at a fast pace in the Asia Pacific. This growth is attributed to the rising popularity of home brewing and the need for cost-effective ways to make high-quality beer.

Ball mills are an essential piece of equipment for several home brewers, and they can be used to create a wide variety of beers. The market for DIY ball mills is expected to be bolstered in the next ten years as millennials begin to appreciate the benefits of home brewing across India and China.

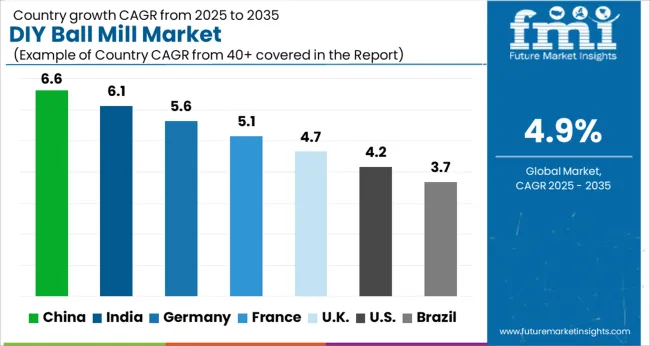
India and China are the market leaders in Asia Pacific, and their most recent CAGRs in the DIY ball mill market are 6.7% and 6.6%, respectively. Japan contributes to around 4.1% of the overall market share.

Category-wise Insights

Why are DIY Ball Mills Exhibiting Immense Popularity among Food Processing Companies?

The ability of Benchtop Ball Mills to Reduce the size of Difficult-to-grind Food Ingredients Will Aid the Demand

A ball mill is a type of grinder that is extensively used to grind and reduce the size of extracted materials such as rocks and glass. The ability of DIY ball mills to lower the size of difficult-to-grind materials such as food products, ceramics, and ores makes them a crucial piece of machinery for the food processing sector.

A typical DIY ball mill can be used to process a wide range of food products in both domestic and professional settings. For processing orders with a high volume, such as those from the food processing industry, commercial ball mills are frequently employed.

Which is the Leading Application of DIY Ball Mills Worldwide?

Demand for Mini Ball Mills to Surge Exponentially among Cosmetics Manufacturers

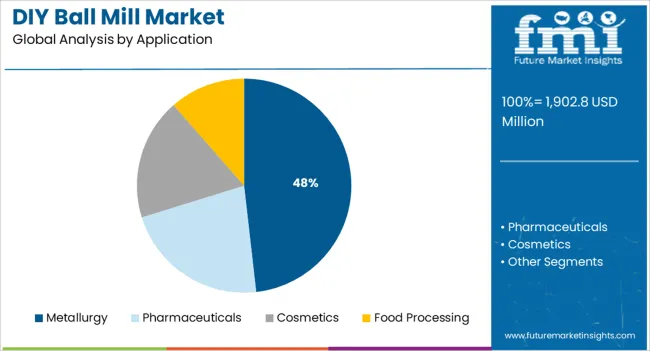
Based on application, the cosmetics segment is anticipated to remain at the forefront during the forecast period, finds Future Market Insights. DIY ball mills are considered to be cylindrical device that is used to grind and reduce the size of materials such as ores, as well as raw materials for ceramics, chemicals, and paints.

These devices include both raw materials and media such as ceramic balls. They rotate along a horizontal axis, and the material inside these mills is crushed into incredibly little bits when it is turned. The cosmetics industry frequently employs this method to produce pigments and powdered makeup. Getting an ultra-fine powder is crucial for producing a smooth high-end product, as consumers might expect. Ball mills are perfect for this task because they may be used to pulverize almost anything.
Get the data you need at a Fraction of the cost

Personalize your report by choosing insights you need
and save 40%!

Competitive Landscape

The global market for DIY ball mills is highly competitive in nature. Leading players in the market are constantly innovating and introducing new products to stay ahead of the competition. Products launched in the global market are also subject to strict quality control measures. Key companies are hence planning to launch new products that are highly reliable and of excellent quality.

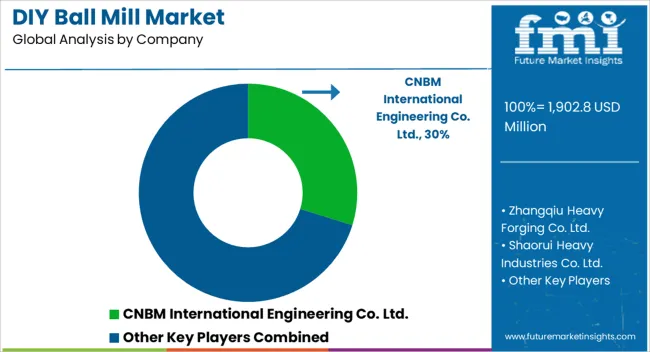
CNBM International Engineering Co. Ltd., Zhangqiu Heavy Forging Co. Ltd., Shaorui Heavy Industries Co. Ltd., Changsha Tencan Powder Technology Co. Ltd., and Shanghai Minggong Heavy Equipment Co. Ltd. are a few of the key suppliers of DIY ball mills.

Scope of the Report

Attribute Details
Estimated Market Size (2023) US$ 1,729.2 million
Projected Market Valuation (2033) US$ 2,790.0 million
Value-based CAGR (2023 to 2033) 4.9%
Forecast Period 2023 to 2033
Historical Data Available for 2018 to 2022
Market Analysis Value (US$ million)
Key Regions Covered
  • North America
  • Latin America
  • Europe
  • East Asia
  • South Asia
  • Oceania
  • Middle East & Africa
Key Countries Covered
  • United States of America
  • Canada
  • Mexico
  • Germany
  • United Kingdom
  • France
  • Russia
  • Brazil
  • Argentina
  • Japan
  • Australia
  • China
  • India
  • Indonesia
  • South Korea
Key Segments Covered
  • Type of Mill
  • Application
  • Sales Channel
  • Region
Key Companies Profiled
  • CNBM International Engineering Co. Ltd.
  • Zhangqiu Heavy Forging Co. Ltd.
  • Shaorui Heavy Industries Co. Ltd.
  • Changsha Tencan Powder Technology Co. Ltd.
  • Shanghai Minggong Heavy Equipment Co. Ltd.
Report Coverage Strategic Growth Initiatives, Drivers, Restraints, Opportunities and Threats Analysis, Market Forecast, Company Share Analysis, Market Dynamics and Challenges, and Competitive Landscape.

DIY Ball Mill Market Outlook by Category

By Type of Mill:

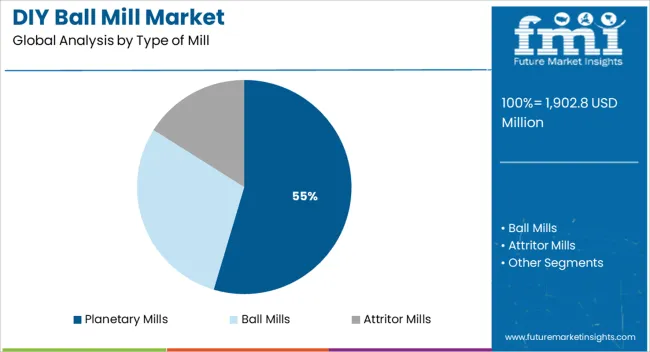
  • Planetary Mills
  • Ball Mills
  • Attritor Mills

By Application:

  • Metallurgy
  • Pharmaceuticals
  • Cosmetics
  • Food Processing

By Sales Channel:

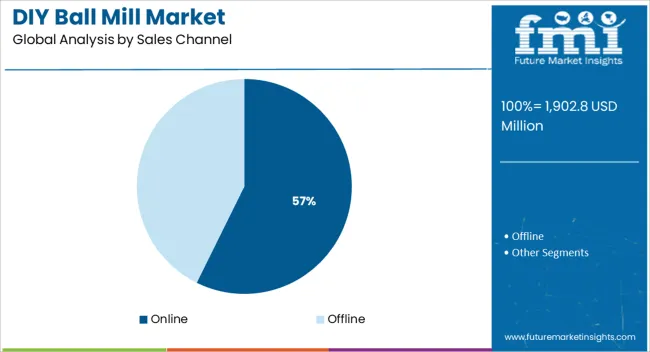
  • Online
  • Offline

By Region:

  • North America
  • Latin America
  • Europe
  • East Asia
  • South Asia
  • Oceania
  • Middle East & Africa

Frequently Asked Questions

What will be size of the global market for DIY ball mills in 2023?

The global DIY ball mill industry is anticipated to reach a valuation of US$ 1,729.2 million by 2023.

What is the USA DIY ball mill industry outlook?

The USA DIY ball mill industry is set to generate around 35.0% of the total market share and is set to be valued at US$ 605.2 million in 2023.

Which are the leading countries driving demand for DIY ball mills?

The USA, Canada, Mexico, Argentina, Brazil, Germany, the United Kingdom, France, Italy, Russia, Spain, China, Japan, India, Indonesia, South Korea, and Australia are the leading countries driving demand for DIY ball mills.

What will be the Germany DIY ball mill industry outlook in 2023?

The Germany DIY ball mill industry is expected to capture around 26.6% of total market share and is likely to be valued at US$ 460.0 million during the forecast period.

Who are the top 5 players operating in the market for DIY ball mills?

CNBM International Engineering Co. Ltd., Zhangqiu Heavy Forging Co. Ltd., Shaorui Heavy Industries Co. Ltd., Changsha Tencan Powder Technology Co. Ltd., and Shanghai Minggong Heavy Equipment Co. Ltd. are top 5 players operating in the market for DIY ball mills.

What is the contribution of Japan in the market for DIY ball mills?

The Japan DIY ball mill industry is projected to generate about 4.1% of the global market share.

At what rate will the DIY ball mill industry grow in India?

The India DIY ball mill industry is estimated to grow at 6.7% CAGR between 2023 and 2033.

What is the demand outlook forecast for the DIY ball mill industry?

The global DIY ball mill industry is projected to surpass US$ 2,790.0 million by 2033.

Table of Content

1. Executive Summary | DIY Ball Mill Market

    1.1. Global Market Outlook

    1.2. Demand-side Trends

    1.3. Supply-side Trends

    1.4. Technology Roadmap Analysis

    1.5. Analysis and Recommendations

2. Market Overview

    2.1. Market Coverage / Taxonomy

    2.2. Market Definition / Scope / Limitations

3. Market Background

    3.1. Market Dynamics

        3.1.1. Drivers

        3.1.2. Restraints

        3.1.3. Opportunity

        3.1.4. Trends

    3.2. Scenario Forecast

        3.2.1. Demand in Optimistic Scenario

        3.2.2. Demand in Likely Scenario

        3.2.3. Demand in Conservative Scenario

    3.3. Product launches & Recent Developments

    3.4. Product Life Cycle Analysis

    3.5. Value Chain Analysis

        3.5.1. Supply Side Participants and their Roles

            3.5.1.1. Producers

            3.5.1.2. Mid-Level Participants (Traders/ Agents/ Brokers)

            3.5.1.3. Wholesalers and Distributors

        3.5.2. % of Operating Margin Analysis

        3.5.3. List of Raw Material Suppliers

        3.5.4. List of Existing and Potential Buyers

    3.6. Global Market - Pricing Analysis

        3.6.1. Price Point Assessment by Region

        3.6.2. Price Point Assessment by Product Type

        3.6.3. Price Forecast till 2033

        3.6.4. Factors affecting pricing

    3.7. Forecast Factors - Relevance & Impact

    3.8. PESTLE and Porter’s Analysis

    3.9. Regulatory Landscape

        3.9.1. Packaging & Labelling Regulations

        3.9.2. Certifications and Certifying Agency Overview

        3.9.3. Import/Export Policies

    3.10. Regional Parent Market Outlook

    3.11. Production and Consumption Statistics

    3.12. Import and Export Statistics

    3.13. Consumers Survey Analysis

    3.14. Macro-Economic Factors

    3.15. Product Claims & Nutritional Information scanned by Buyers

4. Global Market Analysis 2018 to 2022 and Forecast, 2023 to 2033

    4.1. Historical Market Size Value (US$ million) & Volume (Unit) Analysis, 2018 to 2022

    4.2. Current and Future Market Size Value (US$ million) & Volume (Unit) Projections, 2023 to 2033

        4.2.1. Y-o-Y Growth Trend Analysis

        4.2.2. Absolute $ Opportunity Analysis

5. Global Market Analysis 2018 to 2022 and Forecast 2023 to 2033, By Type of Mill

    5.1. Introduction / Key Findings

    5.2. Historical Market Size Value (US$ million) & Volume (Unit) Analysis By Type of Mill, 2018 to 2022

    5.3. Current and Future Market Size Value (US$ million) & Volume (Unit) Analysis and Forecast By Type of Mill, 2023 to 2033

        5.3.1. Planetary Mills

        5.3.2. Ball Mills

        5.3.3. Attritor Mills

    5.4. Y-o-Y Growth Trend Analysis By Type of Mill, 2018 to 2022

    5.5. Absolute $ Opportunity Analysis By Type of Mill, 2023 to 2033

6. Global Market Analysis 2018 to 2022 and Forecast 2023 to 2033, By Application

    6.1. Introduction / Key Findings

    6.2. Historical Market Size Value (US$ million) & Volume (Unit) Analysis By Application, 2018 to 2022

    6.3. Current and Future Market Size Value (US$ million) & Volume (Unit) Analysis and Forecast By Application, 2023 to 2033

        6.3.1. Metallurgy

        6.3.2. Pharmaceuticals

        6.3.3. Cosmetics

        6.3.4. Food Processing

    6.4. Y-o-Y Growth Trend Analysis By Application, 2018 to 2022

    6.5. Absolute $ Opportunity Analysis By Application, 2023 to 2033

7. Global Market Analysis 2018 to 2022 and Forecast 2023 to 2033, By Region

    7.1. Introduction

    7.2. Historical Market Size Value (US$ million) & Volume (Unit) Analysis By Region, 2018 to 2022

    7.3. Current Market Size Value (US$ million) & Volume (Unit) Analysis and Forecast By Region, 2023 to 2033

        7.3.1. North America

        7.3.2. Latin America

        7.3.3. Europe

        7.3.4. East Asia

        7.3.5. South Asia

        7.3.6. Oceania

        7.3.7. Middle East and Africa

    7.4. Market Attractiveness Analysis By Region

8. North America Market Analysis 2018 to 2022 and Forecast 2023 to 2033, By Country

    8.1. Historical Market Size Value (US$ million) & Volume (Unit) Trend Analysis By Market Taxonomy, 2018 to 2022

    8.2. Market Size Value (US$ million) & Volume (Unit) Forecast By Market Taxonomy, 2023 to 2033

        8.2.1. By Country

            8.2.1.1. United States of America

            8.2.1.2. Canada

        8.2.2. By Type of Mill

        8.2.3. By Application

    8.3. Market Attractiveness Analysis

        8.3.1. By Country

        8.3.2. By Type of Mill

        8.3.3. By Application

    8.4. Key Takeaways

9. Latin America Market Analysis 2018 to 2022 and Forecast 2023 to 2033, By Country

    9.1. Historical Market Size Value (US$ million) & Volume (Unit) Trend Analysis By Market Taxonomy, 2018 to 2022

    9.2. Market Size Value (US$ million) & Volume (Unit) Forecast By Market Taxonomy, 2023 to 2033

        9.2.1. By Country

            9.2.1.1. Brazil

            9.2.1.2. Mexico

            9.2.1.3. Argentina

            9.2.1.4. Chile

            9.2.1.5. Peru

            9.2.1.6. Rest of Latin America

        9.2.2. By Type of Mill

        9.2.3. By Application

    9.3. Market Attractiveness Analysis

        9.3.1. By Country

        9.3.2. By Type of Mill

        9.3.3. By Application

    9.4. Key Takeaways

10. Europe Market Analysis 2018 to 2022 and Forecast 2023 to 2033, By Country

    10.1. Historical Market Size Value (US$ million) & Volume (Unit) Trend Analysis By Market Taxonomy, 2018 to 2022

    10.2. Market Size Value (US$ million) & Volume (Unit) Forecast By Market Taxonomy, 2023 to 2033

        10.2.1. By Country

            10.2.1.1. Germany

            10.2.1.2. Italy

            10.2.1.3. France

            10.2.1.4. United Kingdom

            10.2.1.5. Spain

            10.2.1.6. Russia

            10.2.1.7. BENELUX

            10.2.1.8. Poland

            10.2.1.9. Nordic Countries

            10.2.1.10. Rest of Europe

        10.2.2. By Type of Mill

        10.2.3. By Application

    10.3. Market Attractiveness Analysis

        10.3.1. By Country

        10.3.2. By Type of Mill

        10.3.3. By Application

    10.4. Key Takeaways

11. East Asia Market Analysis 2018 to 2022 and Forecast 2023 to 2033, By Country

    11.1. Historical Market Size Value (US$ million) & Volume (Unit) Trend Analysis By Market Taxonomy, 2018 to 2022

    11.2. Market Size Value (US$ million) & Volume (Unit) Forecast By Market Taxonomy, 2023 to 2033

        11.2.1. By Country

            11.2.1.1. China

            11.2.1.2. Japan

            11.2.1.3. South Korea

        11.2.2. By Type of Mill

        11.2.3. By Application

    11.3. Market Attractiveness Analysis

        11.3.1. By Country

        11.3.2. By Type of Mill

        11.3.3. By Application

    11.4. Key Takeaways

12. South Asia Market Analysis 2018 to 2022 and Forecast 2023 to 2033, By Country

    12.1. Historical Market Size Value (US$ million) & Volume (Unit) Trend Analysis By Market Taxonomy, 2018 to 2022

    12.2. Market Size Value (US$ million) & Volume (Unit) Forecast By Market Taxonomy, 2023 to 2033

        12.2.1. By Country

            12.2.1.1. India

            12.2.1.2. Thailand

            12.2.1.3. Malaysia

            12.2.1.4. Indonesia

            12.2.1.5. Singapore

            12.2.1.6. Rest of South Asia

        12.2.2. By Type of Mill

        12.2.3. By Application

    12.3. Market Attractiveness Analysis

        12.3.1. By Country

        12.3.2. By Type of Mill

        12.3.3. By Application

    12.4. Key Takeaways

13. Oceania Market Analysis 2018 to 2022 and Forecast 2023 to 2033, By Country

    13.1. Historical Market Size Value (US$ million) & Volume (Unit) Trend Analysis By Market Taxonomy, 2018 to 2022

    13.2. Market Size Value (US$ million) & Volume (Unit) Forecast By Market Taxonomy, 2023 to 2033

        13.2.1. By Country

            13.2.1.1. Australia

            13.2.1.2. New Zealand

        13.2.2. By Type of Mill

        13.2.3. By Application

    13.3. Market Attractiveness Analysis

        13.3.1. By Country

        13.3.2. By Type of Mill

        13.3.3. By Application

    13.4. Key Takeaways

14. Middle East and Africa Market Analysis 2018 to 2022 and Forecast 2023 to 2033, By Country

    14.1. Historical Market Size Value (US$ million) & Volume (Unit) Trend Analysis By Market Taxonomy, 2018 to 2022

    14.2. Market Size Value (US$ million) & Volume (Unit) Forecast By Market Taxonomy, 2023 to 2033

        14.2.1. By Country

            14.2.1.1. Gulf Cooperation Council Countries

            14.2.1.2. South Africa

            14.2.1.3. Central Africa

            14.2.1.4. North Africa

        14.2.2. By Type of Mill

        14.2.3. By Application

    14.3. Market Attractiveness Analysis

        14.3.1. By Country

        14.3.2. By Type of Mill

        14.3.3. By Application

    14.4. Key Takeaways

15. Key Countries Market Analysis

    15.1. USA

        15.1.1. Pricing Analysis

        15.1.2. Market Share Analysis, 2023

            15.1.2.1. By Type of Mill

            15.1.2.2. By Application

    15.2. Canada

        15.2.1. Pricing Analysis

        15.2.2. Market Share Analysis, 2023

            15.2.2.1. By Type of Mill

            15.2.2.2. By Application

    15.3. Brazil

        15.3.1. Pricing Analysis

        15.3.2. Market Share Analysis, 2023

            15.3.2.1. By Type of Mill

            15.3.2.2. By Application

    15.4. Mexico

        15.4.1. Pricing Analysis

        15.4.2. Market Share Analysis, 2023

            15.4.2.1. By Type of Mill

            15.4.2.2. By Application

    15.5. Argentina

        15.5.1. Pricing Analysis

        15.5.2. Market Share Analysis, 2023

            15.5.2.1. By Type of Mill

            15.5.2.2. By Application

    15.6. Chile

        15.6.1. Pricing Analysis

        15.6.2. Market Share Analysis, 2023

            15.6.2.1. By Type of Mill

            15.6.2.2. By Application

    15.7. Peru

        15.7.1. Pricing Analysis

        15.7.2. Market Share Analysis, 2023

            15.7.2.1. By Type of Mill

            15.7.2.2. By Application

    15.8. Germany

        15.8.1. Pricing Analysis

        15.8.2. Market Share Analysis, 2023

            15.8.2.1. By Type of Mill

            15.8.2.2. By Application

    15.9. Italy

        15.9.1. Pricing Analysis

        15.9.2. Market Share Analysis, 2023

            15.9.2.1. By Type of Mill

            15.9.2.2. By Application

    15.10. France

        15.10.1. Pricing Analysis

        15.10.2. Market Share Analysis, 2023

            15.10.2.1. By Type of Mill

            15.10.2.2. By Application

    15.11. Spain

        15.11.1. Pricing Analysis

        15.11.2. Market Share Analysis, 2023

            15.11.2.1. By Type of Mill

            15.11.2.2. By Application

    15.12. United Kingdom

        15.12.1. Pricing Analysis

        15.12.2. Market Share Analysis, 2023

            15.12.2.1. By Type of Mill

            15.12.2.2. By Application

    15.13. Russia

        15.13.1. Pricing Analysis

        15.13.2. Market Share Analysis, 2023

            15.13.2.1. By Type of Mill

            15.13.2.2. By Application

    15.14. Poland

        15.14.1. Pricing Analysis

        15.14.2. Market Share Analysis, 2023

            15.14.2.1. By Type of Mill

            15.14.2.2. By Application

    15.15. BENELUX

        15.15.1. Pricing Analysis

        15.15.2. Market Share Analysis, 2023

            15.15.2.1. By Type of Mill

            15.15.2.2. By Application

    15.16. Nordic Countries

        15.16.1. Pricing Analysis

        15.16.2. Market Share Analysis, 2023

            15.16.2.1. By Type of Mill

            15.16.2.2. By Application

    15.17. China

        15.17.1. Pricing Analysis

        15.17.2. Market Share Analysis, 2023

            15.17.2.1. By Type of Mill

            15.17.2.2. By Application

    15.18. Japan

        15.18.1. Pricing Analysis

        15.18.2. Market Share Analysis, 2023

            15.18.2.1. By Type of Mill

            15.18.2.2. By Application

    15.19. South Korea

        15.19.1. Pricing Analysis

        15.19.2. Market Share Analysis, 2023

            15.19.2.1. By Type of Mill

            15.19.2.2. By Application

    15.20. India

        15.20.1. Pricing Analysis

        15.20.2. Market Share Analysis, 2023

            15.20.2.1. By Type of Mill

            15.20.2.2. By Application

    15.21. Thailand

        15.21.1. Pricing Analysis

        15.21.2. Market Share Analysis, 2023

            15.21.2.1. By Type of Mill

            15.21.2.2. By Application

    15.22. Indonesia

        15.22.1. Pricing Analysis

        15.22.2. Market Share Analysis, 2023

            15.22.2.1. By Type of Mill

            15.22.2.2. By Application

    15.23. Malaysia

        15.23.1. Pricing Analysis

        15.23.2. Market Share Analysis, 2023

            15.23.2.1. By Type of Mill

            15.23.2.2. By Application

    15.24. Singapore

        15.24.1. Pricing Analysis

        15.24.2. Market Share Analysis, 2023

            15.24.2.1. By Type of Mill

            15.24.2.2. By Application

    15.25. Australia

        15.25.1. Pricing Analysis

        15.25.2. Market Share Analysis, 2023

            15.25.2.1. By Type of Mill

            15.25.2.2. By Application

    15.26. New Zealand

        15.26.1. Pricing Analysis

        15.26.2. Market Share Analysis, 2023

            15.26.2.1. By Type of Mill

            15.26.2.2. By Application

    15.27. Gulf Cooperation Council Countries

        15.27.1. Pricing Analysis

        15.27.2. Market Share Analysis, 2023

            15.27.2.1. By Type of Mill

            15.27.2.2. By Application

    15.28. South Africa

        15.28.1. Pricing Analysis

        15.28.2. Market Share Analysis, 2023

            15.28.2.1. By Type of Mill

            15.28.2.2. By Application

    15.29. North Africa

        15.29.1. Pricing Analysis

        15.29.2. Market Share Analysis, 2023

            15.29.2.1. By Type of Mill

            15.29.2.2. By Application

    15.30. Central Africa

        15.30.1. Pricing Analysis

        15.30.2. Market Share Analysis, 2023

            15.30.2.1. By Type of Mill

            15.30.2.2. By Application

16. Market Structure Analysis

    16.1. Competition Dashboard

    16.2. Competition Benchmarking

    16.3. Market Share Analysis of Top Players

        16.3.1. By Regional

        16.3.2. By Type of Mill

        16.3.3. By Application

17. Competition Analysis

    17.1. Competition Deep Dive

        17.1.1. CNBM International Engineering Co. Ltd.

            17.1.1.1. Overview

            17.1.1.2. Product Portfolio

            17.1.1.3. Profitability by Market Segments (Type of Mill /Application/Region)

            17.1.1.4. Sales Footprint

            17.1.1.5. Strategy Overview

                17.1.1.5.1. Marketing Strategy

                17.1.1.5.2. Product Strategy

                17.1.1.5.3. Channel Strategy

        17.1.2. Zhangqiu Heavy Forging Co. Ltd.

            17.1.2.1. Overview

            17.1.2.2. Product Portfolio

            17.1.2.3. Profitability by Market Segments (Type of Mill /Application/Region)

            17.1.2.4. Sales Footprint

            17.1.2.5. Strategy Overview

                17.1.2.5.1. Marketing Strategy

                17.1.2.5.2. Product Strategy

                17.1.2.5.3. Channel Strategy

        17.1.3. Shaorui Heavy Industries Co. Ltd.

            17.1.3.1. Overview

            17.1.3.2. Product Portfolio

            17.1.3.3. Profitability by Market Segments (Type of Mill /Application/Region)

            17.1.3.4. Sales Footprint

            17.1.3.5. Strategy Overview

                17.1.3.5.1. Marketing Strategy

                17.1.3.5.2. Product Strategy

                17.1.3.5.3. Channel Strategy

        17.1.4. Changsha Tencan Powder Technology Co. Ltd.

            17.1.4.1. Overview

            17.1.4.2. Product Portfolio

            17.1.4.3. Profitability by Market Segments (Type of Mill /Application/Region)

            17.1.4.4. Sales Footprint

            17.1.4.5. Strategy Overview

                17.1.4.5.1. Marketing Strategy

                17.1.4.5.2. Product Strategy

                17.1.4.5.3. Channel Strategy

        17.1.5. Shanghai Minggong Heavy Equipment Co. Ltd.

            17.1.5.1. Overview

            17.1.5.2. Product Portfolio

            17.1.5.3. Profitability by Market Segments (Type of Mill /Application/Region)

            17.1.5.4. Sales Footprint

            17.1.5.5. Strategy Overview

                17.1.5.5.1. Marketing Strategy

                17.1.5.5.2. Product Strategy

                17.1.5.5.3. Channel Strategy

18. Assumptions & Acronyms Used

19. Research Methodology

List of Tables

Table 1: Global Market Value (US$ million) Forecast by Region, 2018 to 2033

Table 2: Global Market Volume (MT) Forecast by Region, 2018 to 2033

Table 3: Global Market Value (US$ million) Forecast by Type of Mill, 2018 to 2033

Table 4: Global Market Volume (MT) Forecast by Type of Mill, 2018 to 2033

Table 5: Global Market Value (US$ million) Forecast by Application, 2018 to 2033

Table 6: Global Market Volume (MT) Forecast by Application, 2018 to 2033

Table 7: North America Market Value (US$ million) Forecast by Country, 2018 to 2033

Table 8: North America Market Volume (MT) Forecast by Country, 2018 to 2033

Table 9: North America Market Value (US$ million) Forecast by Type of Mill, 2018 to 2033

Table 10: North America Market Volume (MT) Forecast by Type of Mill, 2018 to 2033

Table 11: North America Market Value (US$ million) Forecast by Application, 2018 to 2033

Table 12: North America Market Volume (MT) Forecast by Application, 2018 to 2033

Table 13: Latin America Market Value (US$ million) Forecast by Country, 2018 to 2033

Table 14: Latin America Market Volume (MT) Forecast by Country, 2018 to 2033

Table 15: Latin America Market Value (US$ million) Forecast by Type of Mill, 2018 to 2033

Table 16: Latin America Market Volume (MT) Forecast by Type of Mill, 2018 to 2033

Table 17: Latin America Market Value (US$ million) Forecast by Application, 2018 to 2033

Table 18: Latin America Market Volume (MT) Forecast by Application, 2018 to 2033

Table 19: Europe Market Value (US$ million) Forecast by Country, 2018 to 2033

Table 20: Europe Market Volume (MT) Forecast by Country, 2018 to 2033

Table 21: Europe Market Value (US$ million) Forecast by Type of Mill, 2018 to 2033

Table 22: Europe Market Volume (MT) Forecast by Type of Mill, 2018 to 2033

Table 23: Europe Market Value (US$ million) Forecast by Application, 2018 to 2033

Table 24: Europe Market Volume (MT) Forecast by Application, 2018 to 2033

Table 25: East Asia Market Value (US$ million) Forecast by Country, 2018 to 2033

Table 26: East Asia Market Volume (MT) Forecast by Country, 2018 to 2033

Table 27: East Asia Market Value (US$ million) Forecast by Type of Mill, 2018 to 2033

Table 28: East Asia Market Volume (MT) Forecast by Type of Mill, 2018 to 2033

Table 29: East Asia Market Value (US$ million) Forecast by Application, 2018 to 2033

Table 30: East Asia Market Volume (MT) Forecast by Application, 2018 to 2033

Table 31: South Asia Market Value (US$ million) Forecast by Country, 2018 to 2033

Table 32: South Asia Market Volume (MT) Forecast by Country, 2018 to 2033

Table 33: South Asia Market Value (US$ million) Forecast by Type of Mill, 2018 to 2033

Table 34: South Asia Market Volume (MT) Forecast by Type of Mill, 2018 to 2033

Table 35: South Asia Market Value (US$ million) Forecast by Application, 2018 to 2033

Table 36: South Asia Market Volume (MT) Forecast by Application, 2018 to 2033

Table 37: Oceania Market Value (US$ million) Forecast by Country, 2018 to 2033

Table 38: Oceania Market Volume (MT) Forecast by Country, 2018 to 2033

Table 39: Oceania Market Value (US$ million) Forecast by Type of Mill, 2018 to 2033

Table 40: Oceania Market Volume (MT) Forecast by Type of Mill, 2018 to 2033

Table 41: Oceania Market Value (US$ million) Forecast by Application, 2018 to 2033

Table 42: Oceania Market Volume (MT) Forecast by Application, 2018 to 2033

Table 43: Middle East and Africa Market Value (US$ million) Forecast by Country, 2018 to 2033

Table 44: Middle East and Africa Market Volume (MT) Forecast by Country, 2018 to 2033

Table 45: Middle East and Africa Market Value (US$ million) Forecast by Type of Mill, 2018 to 2033

Table 46: Middle East and Africa Market Volume (MT) Forecast by Type of Mill, 2018 to 2033

Table 47: Middle East and Africa Market Value (US$ million) Forecast by Application, 2018 to 2033

Table 48: Middle East and Africa Market Volume (MT) Forecast by Application, 2018 to 2033

List of Charts

Figure 1: Global Market Value (US$ million) by Type of Mill, 2023 to 2033

Figure 2: Global Market Value (US$ Million) by Application, 2023 to 2033

Figure 3: Global Market Value (US$ million) by Region, 2023 to 2033

Figure 4: Global Market Value (US$ Million) Analysis by Region, 2018 to 2033

Figure 5: Global Market Volume (MT) Analysis by Region, 2018 to 2033

Figure 6: Global Market Value Share (%) and BPS Analysis by Region, 2023 to 2033

Figure 7: Global Market Y-o-Y Growth (%) Projections by Region, 2023 to 2033

Figure 8: Global Market Value (US$ million) Analysis by Type of Mill, 2018 to 2033

Figure 9: Global Market Volume (MT) Analysis by Type of Mill, 2018 to 2033

Figure 10: Global Market Value Share (%) and BPS Analysis by Type of Mill, 2023 to 2033

Figure 11: Global Market Y-o-Y Growth (%) Projections by Type of Mill, 2023 to 2033

Figure 12: Global Market Value (US$ million) Analysis by Application, 2018 to 2033

Figure 13: Global Market Volume (MT) Analysis by Application, 2018 to 2033

Figure 14: Global Market Value Share (%) and BPS Analysis by Application, 2023 to 2033

Figure 15: Global Market Y-o-Y Growth (%) Projections by Application, 2023 to 2033

Figure 16: Global Market Attractiveness by Type of Mill, 2023 to 2033

Figure 17: Global Market Attractiveness by Application, 2023 to 2033

Figure 18: Global Market Attractiveness by Region, 2023 to 2033

Figure 19: North America Market Value (US$ million) by Type of Mill, 2023 to 2033

Figure 20: North America Market Value (US$ million) by Application, 2023 to 2033

Figure 21: North America Market Value (US$ million) by Country, 2023 to 2033

Figure 22: North America Market Value (US$ million) Analysis by Country, 2018 to 2033

Figure 23: North America Market Volume (MT) Analysis by Country, 2018 to 2033

Figure 24: North America Market Value Share (%) and BPS Analysis by Country, 2023 to 2033

Figure 25: North America Market Y-o-Y Growth (%) Projections by Country, 2023 to 2033

Figure 26: North America Market Value (US$ million) Analysis by Type of Mill, 2018 to 2033

Figure 27: North America Market Volume (MT) Analysis by Type of Mill, 2018 to 2033

Figure 28: North America Market Value Share (%) and BPS Analysis by Type of Mill, 2023 to 2033

Figure 29: North America Market Y-o-Y Growth (%) Projections by Type of Mill, 2023 to 2033

Figure 30: North America Market Value (US$ million) Analysis by Application, 2018 to 2033

Figure 31: North America Market Volume (MT) Analysis by Application, 2018 to 2033

Figure 32: North America Market Value Share (%) and BPS Analysis by Application, 2023 to 2033

Figure 33: North America Market Y-o-Y Growth (%) Projections by Application, 2023 to 2033

Figure 34: North America Market Attractiveness by Type of Mill, 2023 to 2033

Figure 35: North America Market Attractiveness by Application, 2023 to 2033

Figure 36: North America Market Attractiveness by Country, 2023 to 2033

Figure 37: Latin America Market Value (US$ million) by Type of Mill, 2023 to 2033

Figure 38: Latin America Market Value (US$ million) by Application, 2023 to 2033

Figure 39: Latin America Market Value (US$ million) by Country, 2023 to 2033

Figure 40: Latin America Market Value (US$ million) Analysis by Country, 2018 to 2033

Figure 41: Latin America Market Volume (MT) Analysis by Country, 2018 to 2033

Figure 42: Latin America Market Value Share (%) and BPS Analysis by Country, 2023 to 2033

Figure 43: Latin America Market Y-o-Y Growth (%) Projections by Country, 2023 to 2033

Figure 44: Latin America Market Value (US$ million) Analysis by Type of Mill, 2018 to 2033

Figure 45: Latin America Market Volume (MT) Analysis by Type of Mill, 2018 to 2033

Figure 46: Latin America Market Value Share (%) and BPS Analysis by Type of Mill, 2023 to 2033

Figure 47: Latin America Market Y-o-Y Growth (%) Projections by Type of Mill, 2023 to 2033

Figure 48: Latin America Market Value (US$ million) Analysis by Application, 2018 to 2033

Figure 49: Latin America Market Volume (MT) Analysis by Application, 2018 to 2033

Figure 50: Latin America Market Value Share (%) and BPS Analysis by Application, 2023 to 2033

Figure 51: Latin America Market Y-o-Y Growth (%) Projections by Application, 2023 to 2033

Figure 52: Latin America Market Attractiveness by Type of Mill, 2023 to 2033

Figure 53: Latin America Market Attractiveness by Application, 2023 to 2033

Figure 54: Latin America Market Attractiveness by Country, 2023 to 2033

Figure 55: Europe Market Value (US$ million) by Type of Mill, 2023 to 2033

Figure 56: Europe Market Value (US$ million) by Application, 2023 to 2033

Figure 57: Europe Market Value (US$ million) by Country, 2023 to 2033

Figure 58: Europe Market Value (US$ million) Analysis by Country, 2018 to 2033

Figure 59: Europe Market Volume (MT) Analysis by Country, 2018 to 2033

Figure 60: Europe Market Value Share (%) and BPS Analysis by Country, 2023 to 2033

Figure 61: Europe Market Y-o-Y Growth (%) Projections by Country, 2023 to 2033

Figure 62: Europe Market Value (US$ million) Analysis by Type of Mill, 2018 to 2033

Figure 63: Europe Market Volume (MT) Analysis by Type of Mill, 2018 to 2033

Figure 64: Europe Market Value Share (%) and BPS Analysis by Type of Mill, 2023 to 2033

Figure 65: Europe Market Y-o-Y Growth (%) Projections by Type of Mill, 2023 to 2033

Figure 66: Europe Market Value (US$ million) Analysis by Application, 2018 to 2033

Figure 67: Europe Market Volume (MT) Analysis by Application, 2018 to 2033

Figure 68: Europe Market Value Share (%) and BPS Analysis by Application, 2023 to 2033

Figure 69: Europe Market Y-o-Y Growth (%) Projections by Application, 2023 to 2033

Figure 70: Europe Market Attractiveness by Type of Mill, 2023 to 2033

Figure 71: Europe Market Attractiveness by Application, 2023 to 2033

Figure 72: Europe Market Attractiveness by Country, 2023 to 2033

Figure 73: East Asia Market Value (US$ million) by Type of Mill, 2023 to 2033

Figure 74: East Asia Market Value (US$ million) by Application, 2023 to 2033

Figure 75: East Asia Market Value (US$ million) by Country, 2023 to 2033

Figure 76: East Asia Market Value (US$ million) Analysis by Country, 2018 to 2033

Figure 77: East Asia Market Volume (MT) Analysis by Country, 2018 to 2033

Figure 78: East Asia Market Value Share (%) and BPS Analysis by Country, 2023 to 2033

Figure 79: East Asia Market Y-o-Y Growth (%) Projections by Country, 2023 to 2033

Figure 80: East Asia Market Value (US$ million) Analysis by Type of Mill, 2018 to 2033

Figure 81: East Asia Market Volume (MT) Analysis by Type of Mill, 2018 to 2033

Figure 82: East Asia Market Value Share (%) and BPS Analysis by Type of Mill, 2023 to 2033

Figure 83: East Asia Market Y-o-Y Growth (%) Projections by Type of Mill, 2023 to 2033

Figure 84: East Asia Market Value (US$ million) Analysis by Application, 2018 to 2033

Figure 85: East Asia Market Volume (MT) Analysis by Application, 2018 to 2033

Figure 86: East Asia Market Value Share (%) and BPS Analysis by Application, 2023 to 2033

Figure 87: East Asia Market Y-o-Y Growth (%) Projections by Application, 2023 to 2033

Figure 88: East Asia Market Attractiveness by Type of Mill, 2023 to 2033

Figure 89: East Asia Market Attractiveness by Application, 2023 to 2033

Figure 90: East Asia Market Attractiveness by Country, 2023 to 2033

Figure 91: South Asia Market Value (US$ million) by Type of Mill, 2023 to 2033

Figure 92: South Asia Market Value (US$ million) by Application, 2023 to 2033

Figure 93: South Asia Market Value (US$ million) by Country, 2023 to 2033

Figure 94: South Asia Market Value (US$ million) Analysis by Country, 2018 to 2033

Figure 95: South Asia Market Volume (MT) Analysis by Country, 2018 to 2033

Figure 96: South Asia Market Value Share (%) and BPS Analysis by Country, 2023 to 2033

Figure 97: South Asia Market Y-o-Y Growth (%) Projections by Country, 2023 to 2033

Figure 98: South Asia Market Value (US$ million) Analysis by Type of Mill, 2018 to 2033

Figure 99: South Asia Market Volume (MT) Analysis by Type of Mill, 2018 to 2033

Figure 100: South Asia Market Value Share (%) and BPS Analysis by Type of Mill, 2023 to 2033

Figure 101: South Asia Market Y-o-Y Growth (%) Projections by Type of Mill, 2023 to 2033

Figure 102: South Asia Market Value (US$ million) Analysis by Application, 2018 to 2033

Figure 103: South Asia Market Volume (MT) Analysis by Application, 2018 to 2033

Figure 104: South Asia Market Value Share (%) and BPS Analysis by Application, 2023 to 2033

Figure 105: South Asia Market Y-o-Y Growth (%) Projections by Application, 2023 to 2033

Figure 106: South Asia Market Attractiveness by Type of Mill, 2023 to 2033

Figure 107: South Asia Market Attractiveness by Application, 2023 to 2033

Figure 108: South Asia Market Attractiveness by Country, 2023 to 2033

Figure 109: Oceania Market Value (US$ million) by Type of Mill, 2023 to 2033

Figure 110: Oceania Market Value (US$ million) by Application, 2023 to 2033

Figure 111: Oceania Market Value (US$ million) by Country, 2023 to 2033

Figure 112: Oceania Market Value (US$ million) Analysis by Country, 2018 to 2033

Figure 113: Oceania Market Volume (MT) Analysis by Country, 2018 to 2033

Figure 114: Oceania Market Value Share (%) and BPS Analysis by Country, 2023 to 2033

Figure 115: Oceania Market Y-o-Y Growth (%) Projections by Country, 2023 to 2033

Figure 116: Oceania Market Value (US$ million) Analysis by Type of Mill, 2018 to 2033

Figure 117: Oceania Market Volume (MT) Analysis by Type of Mill, 2018 to 2033

Figure 118: Oceania Market Value Share (%) and BPS Analysis by Type of Mill, 2023 to 2033

Figure 119: Oceania Market Y-o-Y Growth (%) Projections by Type of Mill, 2023 to 2033

Figure 120: Oceania Market Value (US$ million) Analysis by Application, 2018 to 2033

Figure 121: Oceania Market Volume (MT) Analysis by Application, 2018 to 2033

Figure 122: Oceania Market Value Share (%) and BPS Analysis by Application, 2023 to 2033

Figure 123: Oceania Market Y-o-Y Growth (%) Projections by Application, 2023 to 2033

Figure 124: Oceania Market Attractiveness by Type of Mill, 2023 to 2033

Figure 125: Oceania Market Attractiveness by Application, 2023 to 2033

Figure 126: Oceania Market Attractiveness by Country, 2023 to 2033

Figure 127: Middle East and Africa Market Value (US$ million) by Type of Mill, 2023 to 2033

Figure 128: Middle East and Africa Market Value (US$ million) by Application, 2023 to 2033

Figure 129: Middle East and Africa Market Value (US$ million) by Country, 2023 to 2033

Figure 130: Middle East and Africa Market Value (US$ million) Analysis by Country, 2018 to 2033

Figure 131: Middle East and Africa Market Volume (MT) Analysis by Country, 2018 to 2033

Figure 132: Middle East and Africa Market Value Share (%) and BPS Analysis by Country, 2023 to 2033

Figure 133: Middle East and Africa Market Y-o-Y Growth (%) Projections by Country, 2023 to 2033

Figure 134: Middle East and Africa Market Value (US$ million) Analysis by Type of Mill, 2018 to 2033

Figure 135: Middle East and Africa Market Volume (MT) Analysis by Type of Mill, 2018 to 2033

Figure 136: Middle East and Africa Market Value Share (%) and BPS Analysis by Type of Mill, 2023 to 2033

Figure 137: Middle East and Africa Market Y-o-Y Growth (%) Projections by Type of Mill, 2023 to 2033

Figure 138: Middle East and Africa Market Value (US$ million) Analysis by Application, 2018 to 2033

Figure 139: Middle East and Africa Market Volume (MT) Analysis by Application, 2018 to 2033

Figure 140: Middle East and Africa Market Value Share (%) and BPS Analysis by Application, 2023 to 2033

Figure 141: Middle East and Africa Market Y-o-Y Growth (%) Projections by Application, 2023 to 2033

Figure 142: Middle East and Africa Market Attractiveness by Type of Mill, 2023 to 2033

Figure 143: Middle East and Africa Market Attractiveness by Application, 2023 to 2033

Figure 144: Middle East and Africa Market Attractiveness by Country, 2023 to 2033

Recommendations

Process Automation

Oil Mill Machine Market

Published : December 2022

Process Automation

Mill Mixer Market

Published : December 2022

Process Automation

Mill Pulverizer Market

Published : December 2022

Process Automation

Air Classifying Mill Market

Published : December 2022

Explore Process Automation Insights

View Reports