The ballistic protection material market is valued at USD 16.9 billion in 2025 and is projected to reach USD 30.6 billion by 2035, rising at a 6.1% CAGR, with growth driven by intensifying global security threats, expanding military modernization programs, and the increasing need for lightweight protection systems that do not compromise mobility. As armed forces, law enforcement agencies, and private security organizations face more sophisticated ballistic and fragmentation threats, the demand for advanced fibers, composite ceramics, and hybrid armor systems continues to accelerate.
Modern ballistic materials, particularly aramid fibers, UHMWPE, and ceramic-reinforced composites, are favored because they deliver high energy absorption, multi-hit protection capability, and reduced system weight, allowing personnel to maintain operational endurance in rapidly evolving combat and tactical environments. Aramid fibers remain the largest material type, contributing around 20% of total demand due to their proven tensile strength, heat resistance, and broad applicability in body armor, vehicle armor, and helmets. Body armor dominates end-use applications at 46%, supported by military infantry programs, police tactical units, and security organizations seeking reliable torso and plate protection rated against rifle-caliber threats.
Asia Pacific, led by China (7.1% CAGR) and India (7.0% CAGR)—anchors global expansion as defense budgets rise and domestic manufacturing of aramid fibers, UHMWPE, and ceramics scales under military self-reliance initiatives. Saudi Arabia, Russia, and the United States follow with strong procurement cycles tied to vehicle upgrades, soldier survivability programs, and ongoing equipment replacement needs. Europe shows steady growth under rearmament policies, NATO readiness mandates, and police modernization efforts, with the United Kingdom and Germany advancing adoption of advanced composite armor systems.
Competitive dynamics are shaped by companies combining fiber engineering, ceramic innovation, and integrated armor system capabilities, DuPont (Kevlar®), Teijin (Twaron®), Avient Protective Materials (Dyneema®), Honeywell (Spectra®), BAE Systems, and Rheinmetall lead through material science expertise, multi-threat system design, and global supply chain strength. The emerging competitive focus is not simply on protection level, but on weight reduction, hybrid material architectures, and enhanced multi-hit durability, ensuring that armor solutions keep pace with modern warfare and tactical threat evolution.
A major part of this momentum stems from modernization programs across large and mid-sized defense economies. Countries are retiring heavy steel-based armor and replacing it with advanced aramid fabrics, UHMWPE plates, and hybrid laminates that combine multi-layer protection. These materials offer significantly better weight-to-performance ratios, allowing soldiers to move faster and operate longer in high-risk zones. At the same time, law enforcement units are shifting to concealable vests and lightweight plate carriers to address rising urban conflict and active-shooter situations, expanding demand beyond traditional military procurement cycles.
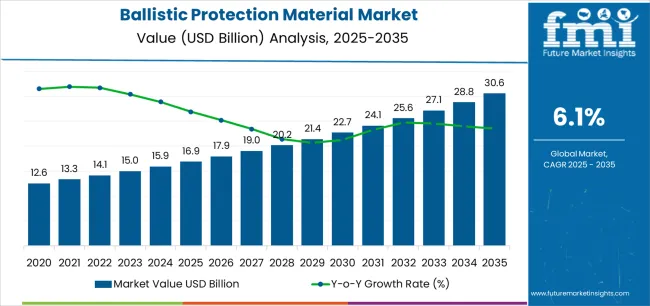
| Metric | Value |
|---|---|
| Estimated Value in (2025E) | USD 16.9 billion |
| Forecast Value in (2035F) | USD 30.6 billion |
| Forecast CAGR (2025 to 2035) | 6.1% |
Market expansion is being supported by the increasing global emphasis on force protection and personnel survivability and the corresponding need for advanced material systems that can defeat evolving ballistic threats, ensure multi-hit protection capability, and maintain operational effectiveness across various military combat, law enforcement, and high-risk security applications. Modern defense procurement agencies and security organizations are increasingly focused on implementing armor solutions that can withstand rifle-caliber threats, provide fragmentation protection, and deliver consistent performance in extreme environmental conditions. Ballistic protection materials' proven ability to deliver lifesaving protection, operate with acceptable weight penalties, and support extended mission durations makes them essential equipment for contemporary military forces and security professionals.
The growing emphasis on soldier modernization programs and next-generation infantry systems is driving demand for ballistic protection materials that can support integrated combat systems, ensure compatibility with communications equipment, and enable comprehensive threat mitigation. Military forces' preference for armor solutions that combine protection with mobility and operational endurance is creating opportunities for innovative ballistic material implementations. The rising influence of asymmetric warfare threats and urban combat operations is also contributing to increased adoption of ballistic protection materials that can provide effective defense without compromising tactical agility or mission flexibility.
The market is segmented by material type, application, end-use, and region. By material type, the market is divided into aramid fibers, UHMWPE, composite ceramics, GFRP, steel & titanium alloys, and others. Based on application, the market is categorized into body armor, vehicle armor, helmets & face protection, aircraft & marine armor, and other protective structures. By end-use, the market includes military & defense, law enforcement, and civilians. Regionally, the market is divided into Asia Pacific, North America, Europe, Latin America, and the Middle East & Africa.
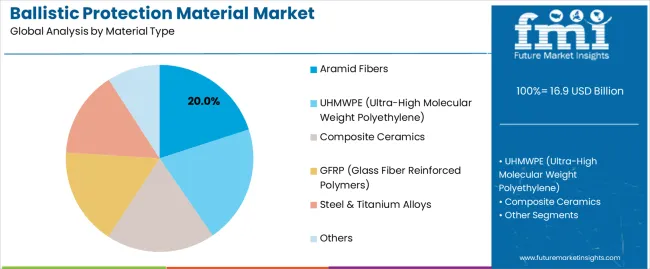
The aramid fibers segment is projected to lead the ballistic protection material market in 2025, capturing 20% of the market share. Aramid fibers are essential for high-performance applications due to their outstanding tensile strength, heat resistance, and lightweight properties. Widely used in personal body armor, military vehicles, and protective clothing, they offer proven threat resistance while allowing mobility and flexibility. Conventional aramid fibers, which make up 12% of the market, are predominantly used in soft body armor like bulletproof vests. Advanced aramid fibers, accounting for 8%, are employed in specialized applications such as aerospace components and armored vehicles.
The UD laminates segment is expected to hold 15% of the market share in 2025. These materials are crucial for ballistic plates and rigid armor systems, offering superior impact resistance and durability. UD laminates are integral to military and law enforcement armor, providing high-strength, lightweight protection for personnel and vehicles. The UHMWPE (ultra-high molecular weight polyethylene) segment is forecasted to capture 18% of the market share. Known for its excellent strength-to-weight ratio, UHMWPE is ideal for lightweight body armor and vehicle protection. Its resistance to abrasion, impact, and chemicals boosts its appeal across both personal and vehicular armor applications.
The hybrid aramid-PE stacks segment is gaining ground, representing 12% of the market. This combination of aramid fibers and polyethylene offers enhanced ballistic performance with improved lightweight properties, making it ideal for military armor and vehicle protection. Similarly, the GFRP (glass fiber reinforced polymers) segment is expected to capture 9% of the market, valued for its strength, corrosion resistance, and cost-effectiveness in armored vehicle structures. The composite ceramics and steel & titanium alloys account for 8% and 5% of the market share, respectively, playing crucial roles in hard armor applications for military vehicles and infrastructure protection.
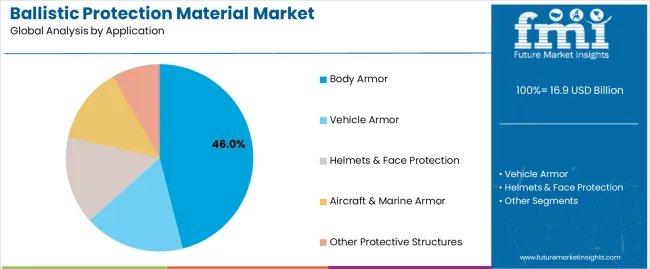
The body armor application segment is projected to represent the largest share of ballistic protection material demand in 2025 with 46% market share, underscoring its critical role as the primary driver for advanced material adoption across military infantry systems, law enforcement tactical units, and security personnel protection programs. Defense forces and security agencies prefer ballistic materials for personal armor due to their lightweight protection capabilities, proven threat defeat performance, and ability to ensure soldier survivability while supporting operational mobility and mission effectiveness. Positioned as essential equipment for modern military operations, body armor systems offer both lifesaving advantages and tactical flexibility benefits.
Within the body armor segment, concealable soft vests represent 18.0% of total market share, serving law enforcement officers, dignitary protection details, and plainclothes security personnel requiring discreet ballistic protection for handgun threats. Tactical plate carriers account for 17.0% through military combat systems integrating soft armor foundations with hard ceramic or polyethylene plate inserts for rifle threat protection. Bomb disposal blankets and ballistic shields capture 11.0% market share with specialized explosive ordnance disposal and tactical entry applications requiring fragmentation and blast protection.
The vehicle armor segment represents the second-largest application category, capturing 26.0% market share through armored fighting vehicles, patrol trucks, and VIP transport requiring protection against small arms fire, improvised explosive devices, and rocket-propelled grenades. This segment benefits from ongoing military vehicle modernization programs and growing demand for mine-resistant ambush-protected (MRAP) systems with composite armor integration.
Helmets and face protection account for 15.0% market share, serving combat helmet shells, face shields, and mandible guards requiring ballistic and fragmentation protection for head and facial regions. Aircraft and marine armor captures 8.0% through rotorcraft crew seats, cockpit panels, and naval vessel critical space hardening. Other protective structures represent 5.0% of the market with specialized applications including infrastructure hardening and critical asset protection.
Key market dynamics supporting application growth include:
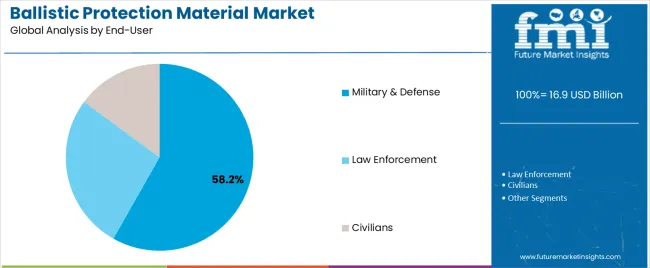
The military and defense end-use segment is projected to maintain its commanding position in the ballistic protection material market with 58.2% market share in 2025, reflecting the critical role of armed forces as the primary consumers of advanced armor materials for personnel protection, vehicle survivability, and asset hardening applications. The military segment's market leadership is reinforced by substantial defense budgets, ongoing force modernization initiatives, and rising emphasis on soldier protection as a strategic priority across global military establishments.
Within the military and defense segment, land forces account for 33.0% of total market share, representing the largest sub-category through infantry body armor systems, armored vehicle protection, and ground equipment hardening requirements. Air forces capture 13.0% market share through aircrew protection systems, rotorcraft armor, and airbase facility hardening applications. Naval forces represent 12.2% with maritime body armor, ship-board protective equipment, and naval vessel critical space hardening.
The law enforcement segment represents 29.0% market share, serving police departments, federal agencies, border patrol units, and special operations teams requiring ballistic protection for patrol operations, tactical interventions, and critical incident response. This segment benefits from ongoing equipment modernization programs and increasing emphasis on officer safety across metropolitan and regional law enforcement agencies.
The civilian end-use segment accounts for 12.8% market share, encompassing VIP protection services, cash-in-transit operations, private security contractors, and journalists operating in conflict zones. This segment reflects growing demand for personal protection solutions among non-military users facing elevated security risks.
Key market dynamics supporting end-use segment growth include:
The ballistic protection material market is advancing steadily due to increasing global security threats and growing adoption of advanced armor technologies that provide enhanced personal protection and vehicle survivability across diverse military, law enforcement, and civilian security applications. The market faces challenges, including high material and manufacturing costs limiting procurement volumes, thermal stress and wear comfort issues affecting extended operational use, and evolving threat environments requiring continuous material performance upgrades. Innovation in hybrid material systems and multi-functional protective solutions continues to influence product development and market expansion patterns.
The growing adoption of advanced composite technologies and hybrid material combinations is enabling defense manufacturers to achieve superior protection-to-weight ratios, enhanced multi-threat performance, and comprehensive system optimization for improved soldier mobility. Hybrid armor systems combining aramid soft armor with ceramic composite plates provide optimized threat defeat while allowing reduced system weight compared to conventional all-aramid or steel armor configurations across various body armor and vehicle protection applications. Manufacturers are increasingly recognizing the competitive advantages of composite integration for performance differentiation and weight reduction imperatives.
Modern ballistic protection material manufacturers are incorporating ultra-high molecular weight polyethylene advancements and engineered ceramic composites to enhance ballistic efficiency, reduce areal density, and support comprehensive performance optimization through optimized fiber architecture and precision ceramic tile geometries. These technologies improve threat defeat capability while enabling new applications, including buoyant maritime armor and transparent protection systems. Advanced material integration also allows manufacturers to support comprehensive multi-threat protection objectives and operational requirements beyond traditional aramid-only approaches.
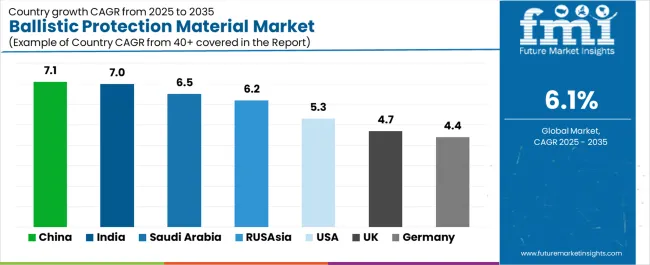
| Country | CAGR (2025-2035) |
|---|---|
| China | 7.1% |
| India | 7.0% |
| Saudi Arabia | 6.5% |
| Russia | 6.2% |
| United States | 5.3% |
| United Kingdom | 4.7% |
| Germany | 4.4% |
The ballistic protection material market is experiencing solid growth globally, with China leading at a 7.1% CAGR through 2035, driven by expanding defense budget allocations, accelerating localization of aramid and UHMWPE production capabilities, and comprehensive vehicle armor retrofit programs across military and paramilitary forces. India follows at 7.0%, supported by ambitious soldier-system modernization initiatives, Make-in-India armor manufacturing programs, and substantial border and internal security equipment requirements. Saudi Arabia shows growth at 6.5%, emphasizing homeland security infrastructure development and armored vehicle fleet expansion with industrial localization through offset agreements. Russia records 6.2%, focusing on high operational demand from ongoing military activities and vehicle helmet refit programs with domestic ceramics supply scaling. The United States demonstrates 5.3% growth, supported by next-generation body armor development including Integrated Head Protection System programs and multi-year Department of Defense procurement contracts with law enforcement agency refresh cycles. The United Kingdom exhibits 4.7% growth, emphasizing NATO readiness requirements and police protective gear modernization. Germany shows 4.4% growth, supported by Zeitenwende rearmament initiatives and export-oriented armor ceramics manufacturing.
The report covers an in-depth analysis of 40+ countries, with top-performing countries highlighted below.
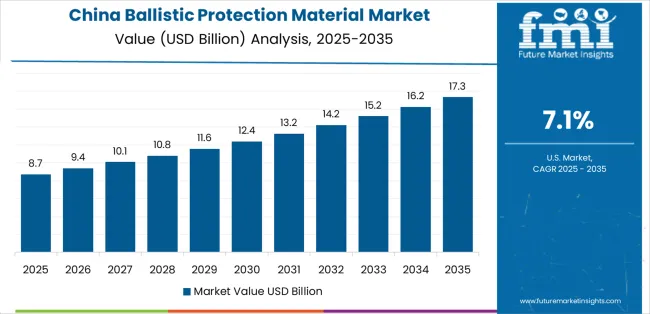
Revenue from ballistic protection materials in China is projected to exhibit exceptional growth with a CAGR of 7.1% through 2035, driven by expanding defense budget allocations supporting comprehensive military modernization and rapidly growing domestic production capacity for aramid fibers and UHMWPE materials through strategic industrial development initiatives. The country's massive People's Liberation Army force structure and increasing investment in advanced personal protection technologies are creating substantial demand for ballistic material systems. Major defense contractors and specialty materials manufacturers are establishing comprehensive ballistic protection material capabilities to serve both domestic military requirements and emerging export opportunities.
Demand for ballistic protection materials in India is expanding at a CAGR of 7.0%, supported by the country's ambitious soldier modernization initiatives including Future Infantry Combat Vehicle systems, increasing domestic manufacturing under Make-in-India defense programs, and substantial border and internal security equipment requirements for paramilitary forces. The country's large armed forces and expanding defense industrial base are driving demand for advanced ballistic protection capabilities. International armor manufacturers and domestic defense companies are establishing extensive production and technology transfer capabilities to address the growing demand for indigenous ballistic materials.
Revenue from ballistic protection materials in Saudi Arabia is growing at a CAGR of 6.5%, driven by expanding homeland security infrastructure programs, comprehensive armored vehicle fleet procurement supporting internal security and border protection missions, and strategic industrial localization initiatives through defense offset agreements requiring domestic production participation. The country's substantial security equipment budgets and emphasis on force protection capabilities are supporting demand for advanced ballistic technologies across military and internal security applications. International defense contractors and domestic industrial partners are establishing manufacturing capabilities to serve both immediate procurement requirements and long-term industrial development objectives.
Government initiatives promoting defense industrial base development and offset program requirements are driving the establishment of domestic ballistic material manufacturing capacity, including aramid processing facilities, ceramic tile production lines, and armor system integration workshops.
Rising security challenges and growing armored vehicle procurement are supporting market expansion, while substantial defense budgets provide opportunities for premium ballistic material adoption throughout military and paramilitary force structures.
Revenue from ballistic protection materials in Russia is expected to expand at a CAGR of 6.2%, supported by sustained operational demand from ongoing military activities requiring continuous equipment replacement and modernization, comprehensive vehicle and helmet refit programs upgrading legacy systems with improved protection levels, and domestic ceramics production capacity scaling supporting indigenous armor plate manufacturing. The nation's large military establishment and emphasis on force protection enhancement are driving demand for upgraded ballistic protection solutions. Domestic defense industrial enterprises are investing in expanded production capabilities to serve immediate operational requirements and long-term force modernization objectives.
Demand for ballistic protection materials in the United States is forecasted to grow at a CAGR of 5.3%, supported by the country's next-generation body armor development including Integrated Head Protection System (IHPS) and Soldier Protection System programs, substantial multi-year Department of Defense procurement contracts ensuring sustained demand visibility, and ongoing law enforcement agency refresh cycles replacing aging protective equipment across federal, state, and local agencies. The nation's advanced defense technology base and established procurement frameworks are driving demand for cutting-edge ballistic protection solutions. Leading materials manufacturers are investing in advanced fiber development and ceramic engineering to serve rigorous military performance requirements and competitive procurement processes.
Revenue from ballistic protection materials in the United Kingdom is growing at a CAGR of 4.7%, driven by the country's emphasis on NATO readiness requirements and collective defense capability contributions, vehicle armor sustainment programs maintaining operational fleet protection levels, and police protective gear upgrade initiatives enhancing officer safety for armed response and counter-terrorism units. The UK's established defense procurement framework and focus on interoperability standards are supporting investment in qualified ballistic protection materials throughout military and law enforcement agencies. Industry leaders are establishing comprehensive material supply and armor system integration capabilities to serve both Ministry of Defence requirements and Home Office police equipment programs.
Demand for ballistic protection materials in Germany is anticipated to expand at a CAGR of 4.4%, supported by the country's Zeitenwende strategic rearmament initiative dramatically increasing defense spending and equipment procurement, comprehensive infantry kit modernization programs upgrading personal protective equipment for Bundeswehr forces, and strong export-oriented armor ceramics manufacturing serving international defense markets. Germany's advanced materials science capabilities and precision manufacturing expertise are driving demand for high-performance ballistic protection products and specialized ceramic armor systems. Leading defense contractors are investing in expanded production capacity to serve accelerated domestic procurement schedules and sustained international demand.
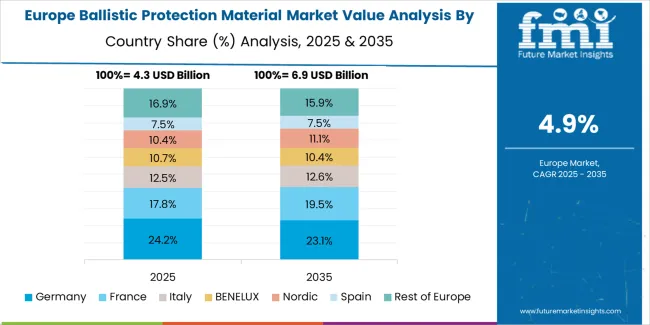
The ballistic protection material market in Europe is projected to grow from USD 5.1 billion in 2025 to USD 8.7 billion by 2035, registering a CAGR of 5.5% over the forecast period. Germany is expected to maintain its leadership position with a 27.5% market share in 2025, supported by its Zeitenwende rearmament programs, advanced ceramic manufacturing capabilities, and comprehensive vehicle armor production serving NATO markets and export customers.
The United Kingdom follows with 20.5% in 2025, driven by established body armor integration expertise, Ministry of Defence sustainment procurement, and specialized police protective equipment programs. France holds 18.0% in 2025, supported by balanced soldier systems development and vehicle survivability programs for army and marine forces. Italy commands 14.0% in 2025 through naval platform protection and homeland security applications, while Spain accounts for 9.0% with military modernization and law enforcement equipment programs. The Nordic region maintains 4.0% share with specialized ultra-light UHMWPE solutions for dismounted troops and maritime applications in extreme cold environments.
Central and Eastern Europe, including Poland, Czech Republic, and Romania, is anticipated to gain significant momentum, expanding its collective share from 7.0% in 2025 to 8.5% by 2035, attributed to accelerating regional rearmament initiatives, plate and helmet assembly capacity expansion, and comprehensive equipment refurbishment programs supplying NATO eastern flank defense requirements and national force modernization.
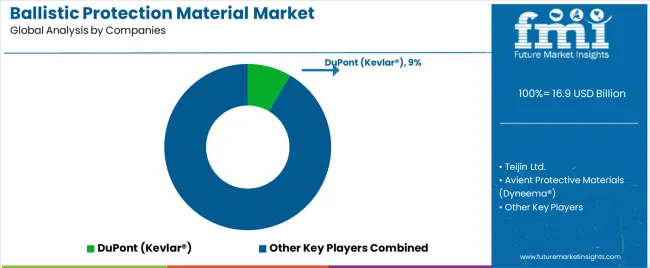
The ballistic protection material market features 12–18 players with moderate concentration, where the top three companies collectively hold around 42–48% of global market share. Growth is driven by rising defense modernization programs, expanding law-enforcement needs, and increasing adoption of lightweight, high-strength protective materials. The leading company, DuPont, commands 9% of the market share, supported by its industry-defining aramid fiber technologies (Kevlar®), strong innovation pipeline, and long-standing supply relationships with defense agencies and armor manufacturers worldwide. Competition centers on material strength-to-weight ratios, multi-hit resistance, mobility enhancement, and compliance with stringent military standards rather than price alone.
Market leaders such as DuPont, Teijin Ltd., and Avient Protective Materials (Dyneema®) maintain dominant positions by offering advanced aramid and UHMWPE fibers used in body armor, helmets, vehicle armor, and structural protection. Their competitive strengths lie in superior ballistic performance, energy absorption capabilities, and ongoing improvements in lightweight protection.
Challenger companies including Honeywell International Inc. (Spectra®), BAE Systems, and Rheinmetall AG focus on integrated armor systems, composite materials, and next-generation protective solutions for military vehicles and personal armor platforms.
Additional competition arises from Morgan Advanced Materials, Kolon Industries, Hyosung Corp., TenCate Advanced Armor, Avon Protection, Saint-Gobain, CoorsTek, and ArmorSource LLC, which enhance global presence through ceramic armor expertise, engineered composites, and specialized high-threat protective systems for defense and law-enforcement users.
Ballistic protection materials represent a specialized defense and security segment within advanced materials and protective systems, projected to grow from USD 16.9 billion in 2025 to USD 30.6 billion by 2035 at a 6.1% CAGR. These critical safety materials, primarily aramid fiber and UHMWPE configurations for personal and vehicle armor, provide lifesaving threat defeat capability against ballistic projectiles and fragmentation in military combat, law enforcement, and high-risk civilian security applications. Market expansion is driven by increasing global security threats, growing military modernization initiatives, expanding law enforcement protective equipment requirements, and rising emphasis on soldier survivability and force protection in diverse operational environments.
Ballistic Performance Standards: Establish comprehensive threat-based protection requirements for ballistic materials, including multi-hit capability, edge protection, environmental durability, and trauma reduction specifications that ensure consistent soldier survivability across diverse threat scenarios and operational environments.
Weight-Performance Optimization: Develop procurement frameworks that balance protection levels with mobility requirements, establishing maximum areal density targets and encouraging advanced material adoption that reduces soldier combat load while maintaining threat defeat capability.
Multi-Threat Protection Integration: Implement requirements for integrated protection systems addressing ballistic, fragmentation, and blast threats through optimized material combinations and system architectures that provide comprehensive survivability enhancement.
Lifecycle Cost Analysis: Create standardized methodologies for evaluating total ownership costs including initial procurement, maintenance, replacement cycles, and training requirements that enable informed material selection and budget optimization.
Industrial Base Development: Provide procurement visibility and long-term contracts that enable domestic materials manufacturing investment, technology development, and supply chain security for critical ballistic protection capabilities.
Harmonized Testing Protocols: Develop internationally recognized ballistic testing standards and material qualification procedures that enable performance comparison, reduce redundant testing, and facilitate allied equipment interoperability across NATO and coalition partners.
Material Property Databases: Establish comprehensive databases of ballistic material characteristics, environmental performance, and aging behavior that enable informed design decisions and lifecycle management across diverse protection applications.
System Integration Guidelines: Create technical standards for integrating ballistic materials with load-bearing equipment, communications systems, and other soldier equipment ensuring compatibility and optimal operational effectiveness.
Quality Assurance Standards: Develop manufacturing process controls and inspection criteria specifically designed for ballistic materials ensuring consistent production quality and reliable field performance across high-volume procurement programs.
Emerging Threat Assessment: Facilitate information sharing on evolving ballistic threats including armor-piercing ammunition and emerging weapon systems that inform material development priorities and protection requirement updates.
Advanced Fiber Engineering: Invest in research and development of next-generation aramid formulations, ultra-high molecular weight polyethylene advances, and novel fiber architectures that enable superior ballistic efficiency and reduced areal density while maintaining multi-hit protection capability.
Ceramic Composite Innovation: Develop engineered ceramic materials with optimized microstructures, enhanced multi-hit tolerance, and reduced weight that provide superior hard armor performance against armor-piercing threats while enabling thinner profile solutions.
Hybrid Material Systems: Engineer integrated material architectures combining complementary fiber and ceramic technologies that optimize protection-to-weight ratios through synergistic threat defeat mechanisms and structural load distribution.
Manufacturing Process Excellence: Create advanced production technologies with improved quality control, reduced material waste, and enhanced cost efficiency that enable competitive pricing while maintaining performance consistency across large procurement volumes.
Technical Support Services: Establish comprehensive customer support providing material selection guidance, armor design optimization, ballistic testing support, and field performance monitoring that ensure optimal protection system effectiveness.
Threat-Based Design: Conduct comprehensive threat assessments and vulnerability analyses to optimize armor placement, material selection, and system architecture that maximize survivability while minimizing weight and cost penalties.
Ergonomic Integration: Develop armor systems with anthropometric fit optimization, thermal management features, and mobility enhancement that enable extended operational wear and maintain combat effectiveness in demanding environments.
Modular Architecture: Implement scalable protection systems with interchangeable threat plates, removable components, and mission-configurable designs that enable threat-appropriate protection and operational flexibility.
Life Cycle Support: Provide comprehensive maintenance programs, component replacement services, and performance monitoring that ensure sustained protection capability and optimal equipment availability throughout service life.
Technology Insertion: Develop upgrade pathways and retrofit solutions that enable fielded equipment modernization with advanced materials and improved protection capabilities without complete system replacement.
Materials Science Research: Conduct fundamental research on fiber chemistry, ceramic engineering, and composite mechanics that advance understanding of ballistic defeat mechanisms and enable next-generation material development.
Computational Modeling: Develop validated simulation tools for ballistic impact, material response, and system optimization that reduce physical testing requirements and accelerate design iteration cycles.
Multi-Functional Materials: Explore materials with integrated capabilities including ballistic protection, electromagnetic shielding, chemical protection, and structural load bearing that enable simplified system designs and weight reduction.
Bio-Inspired Designs: Investigate natural armor architectures and energy absorption mechanisms that inform novel material structures and protective strategies for enhanced performance and efficiency.
Technology Transition: Facilitate collaboration between academic research, defense laboratories, and commercial manufacturers to accelerate promising technologies from laboratory demonstration to production readiness and fielded applications.
Manufacturing Capacity Investment: Provide capital for fiber production facilities, ceramic processing plants, and armor assembly operations that meet growing global demand while improving economies of scale and cost competitiveness.
Technology Development Financing: Fund research and development of breakthrough materials, advanced manufacturing processes, and novel protection concepts that address current performance limitations and emerging threat challenges.
Supply Chain Development: Support raw material suppliers, specialized equipment manufacturers, and testing facilities that enable complete vertical integration and supply chain resilience for critical ballistic protection capabilities.
International Expansion: Finance establishment of regional manufacturing facilities and partnerships in high-growth markets that serve local procurement requirements while navigating offset agreements and industrial participation mandates.
Dual-Use Applications: Enable technology development serving both defense and civilian security markets including law enforcement, cash-in-transit, and critical infrastructure protection that diversify revenue and accelerate innovation adoption.
| Items | Values |
|---|---|
| Quantitative Units (2025) | USD 16.9 billion |
| Material Type | Aramid Fibers (UD laminates, Woven/stitched fabrics, Hybrid aramid-PE stacks), UHMWPE, Composite Ceramics, GFRP, Steel & Titanium Alloys, Others |
| Application | Body Armor (Concealable soft vests, Tactical plate carriers, Bomb blankets & shields), Vehicle Armor, Helmets & Face Protection, Aircraft & Marine Armor, Other Protective Structures |
| End-use | Military & Defense (Land forces, Air forces, Naval), Law Enforcement, Civilians (VIP/cash-in-transit, private security) |
| Regions Covered | Asia Pacific, North America, Europe, Latin America, Middle East & Africa |
| Countries Covered | China, India, Saudi Arabia, Russia, United States, United Kingdom, Germany, and 40+ countries |
| Key Companies Profiled | DuPont, Teijin Ltd., Avient Protective Materials (Dyneema®), Honeywell International Inc., BAE Systems, Rheinmetall AG, Morgan Advanced Materials plc, Kolon Industries Inc., Hyosung Corp., TenCate Advanced Armor, Avon Protection (Ceradyne), Saint-Gobain, CoorsTek Inc., and ArmorSource LLC |
| Additional Attributes | Dollar sales by material type, application, and end-use categories, regional demand trends, competitive landscape, technological advancements in fiber and ceramic systems, hybrid material development, weight optimization innovation, and multi-threat protection capabilities |
The global ballistic protection material market is estimated to be valued at USD 16.9 billion in 2025.
The market size for the ballistic protection material market is projected to reach USD 30.6 billion by 2035.
The ballistic protection material market is expected to grow at a 6.1% CAGR between 2025 and 2035.
The key product types in ballistic protection material market are aramid fibers, uhmwpe (ultra-high molecular weight polyethylene), composite ceramics, gfrp (glass fiber reinforced polymers), steel & titanium alloys and others.
In terms of application, body armor segment to command 46.0% share in the ballistic protection material market in 2025.


Our Research Products

The "Full Research Suite" delivers actionable market intel, deep dives on markets or technologies, so clients act faster, cut risk, and unlock growth.

The Leaderboard benchmarks and ranks top vendors, classifying them as Established Leaders, Leading Challengers, or Disruptors & Challengers.

Locates where complements amplify value and substitutes erode it, forecasting net impact by horizon

We deliver granular, decision-grade intel: market sizing, 5-year forecasts, pricing, adoption, usage, revenue, and operational KPIs—plus competitor tracking, regulation, and value chains—across 60 countries broadly.

Spot the shifts before they hit your P&L. We track inflection points, adoption curves, pricing moves, and ecosystem plays to show where demand is heading, why it is changing, and what to do next across high-growth markets and disruptive tech

Real-time reads of user behavior. We track shifting priorities, perceptions of today’s and next-gen services, and provider experience, then pace how fast tech moves from trial to adoption, blending buyer, consumer, and channel inputs with social signals (#WhySwitch, #UX).

Partner with our analyst team to build a custom report designed around your business priorities. From analysing market trends to assessing competitors or crafting bespoke datasets, we tailor insights to your needs.
Supplier Intelligence
Discovery & Profiling
Capacity & Footprint
Performance & Risk
Compliance & Governance
Commercial Readiness
Who Supplies Whom
Scorecards & Shortlists
Playbooks & Docs
Category Intelligence
Definition & Scope
Demand & Use Cases
Cost Drivers
Market Structure
Supply Chain Map
Trade & Policy
Operating Norms
Deliverables
Buyer Intelligence
Account Basics
Spend & Scope
Procurement Model
Vendor Requirements
Terms & Policies
Entry Strategy
Pain Points & Triggers
Outputs
Pricing Analysis
Benchmarks
Trends
Should-Cost
Indexation
Landed Cost
Commercial Terms
Deliverables
Brand Analysis
Positioning & Value Prop
Share & Presence
Customer Evidence
Go-to-Market
Digital & Reputation
Compliance & Trust
KPIs & Gaps
Outputs
Full Research Suite comprises of:
Market outlook & trends analysis
Interviews & case studies
Strategic recommendations
Vendor profiles & capabilities analysis
5-year forecasts
8 regions and 60+ country-level data splits
Market segment data splits
12 months of continuous data updates
DELIVERED AS:
PDF EXCEL ONLINE
Ballistic Protection Market Size and Share Forecast Outlook 2025 to 2035
Ballistic Protection Scanners Market
Fire Protection Materials Market Size and Share Forecast Outlook 2025 to 2035
Passive Fire Protection Materials Market Size and Share Forecast Outlook 2025 to 2035
Ballistic Floatation Vest Market Size and Share Forecast Outlook 2025 to 2035
Material Rack Correction Machine Market Size and Share Forecast Outlook 2025 to 2035
Ballistic Protective Equipment Market Size and Share Forecast Outlook 2025 to 2035
Material Shrinkage-reducing Agents Market Size and Share Forecast Outlook 2025 to 2035
Material Handling Integration Market Size and Share Forecast Outlook 2025 to 2035
Material-Based Hydrogen Energy Storage Market Size and Share Forecast Outlook 2025 to 2035
Ballistic Composites Market Size and Share Forecast Outlook 2025 to 2035
Material Tester Market Growth – Trends & Forecast 2025 to 2035
Material Handling Equipment Market Growth - Trends & Forecast 2025 to 2035
Material Handling Monorails Market
Biomaterial Tester Market Size and Share Forecast Outlook 2025 to 2035
Biomaterial In Surgical Mesh Market Size and Share Forecast Outlook 2025 to 2035
Biomaterial Market Analysis – Size, Share & Forecast 2025 to 2035
Metamaterial Market Size and Share Forecast Outlook 2025 to 2035
PET Material Packaging Market Size and Share Forecast Outlook 2025 to 2035
Flu Protection Kits Market Size and Share Forecast Outlook 2025 to 2035

Thank you!
You will receive an email from our Business Development Manager. Please be sure to check your SPAM/JUNK folder too.
Chat With
MaRIA