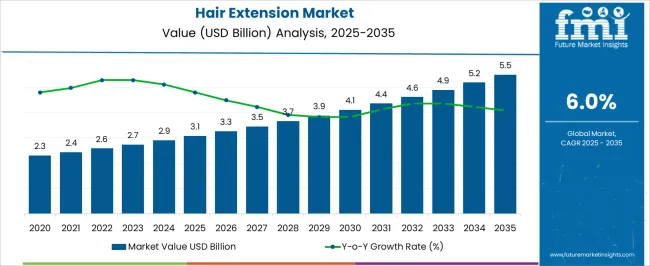
The hair extension market is valued at USD 2,721.8 million in 2023. In 2022, the valuation was USD 2,573.9 million. The market is projected to increase at a CAGR of 6.3% from 2023 to 2033. By the end of the forecast period, the value of the hair extension market is expected to reach USD 5,000.2 million.
Consumption Analysis in the Hair Extension Market
Attributes | Details |
---|---|
Hair Extension Market Value, 2023 | USD 2,721.8 million |
Projected Hair Extension Market Value, 2033 | USD 5,000.2 million |
Value-based CAGR, 2023 to 2033 | 6.3% |
The value of the hair extension market in 2018 was USD 2,154.1 million. The market progressed at a reasonable CAGR of 4.6% during the historical period from 2018 to 2022.
The value of appearance, including hair appearance, continued to grow during the historical period. However, the pandemic halted the growth of the market. Consumers were forced to sit at home, and haircare hubs like salons and barbershops were shut down.
Problems were also faced with the supply of raw materials. With the reopening of haircare places and shops, the haircare market started its recovery phase. The hair extension market was valued at USD 2,573.9 million in 2022
Hair Extension Market Valuation, 2018 | USD 2,154.1 million |
---|---|
Historical CAGR, 2018 to 2022 | 4.6% |
Historical Market Valuation, 2022 | USD 2,573.9 million |
In 2023, the value of the hair extension market is USD 2,721.8 million. The market is expected to grow at a CAGR of 6.3% during the forecast period from 2023 to 2033.
The growth in the forecast period is set to outpace the growth in the historical period. The need to keep up appearances is still keenly felt among the population. Increasing incidences of hair loss and balding are leading people to take the aid of hair extensions.
The improvement in the spending power of consumers is beneficial to the hair extension industry. Consumers are willing to pay the price for improving hair appearance. The scope of hair extensions is not limited to consumers with hair loss problems.
Consumers are buying different styles of hair extensions, such as wavy hair, thick hair, etc., to enhance appearances. By the end of the forecast period, the hair extension market is predicted to reach USD 5,000.2 million.
Top Product Type | Natural |
---|---|
Market Share in 2023 | 59.5% |
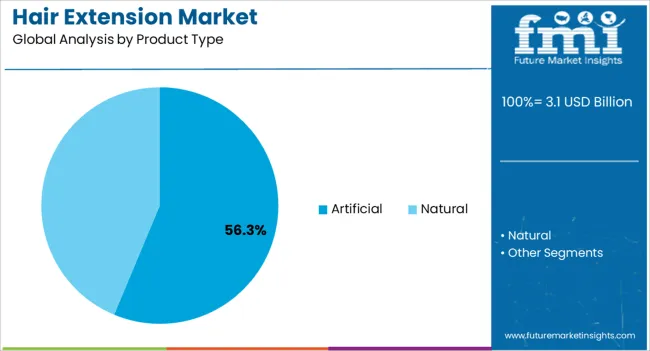
Natural hair is the dominant product type in the hair extension market. In 2023, natural hair accounts for a share of 59.5% of the market by product type.
Consumers are seeking authenticity when it comes to hair extensions. Thus, natural hair is the leading material type in the market over artificial hair.
Top Material Type | Clip-in |
---|---|
Market Share in 2023 | 45.8% |
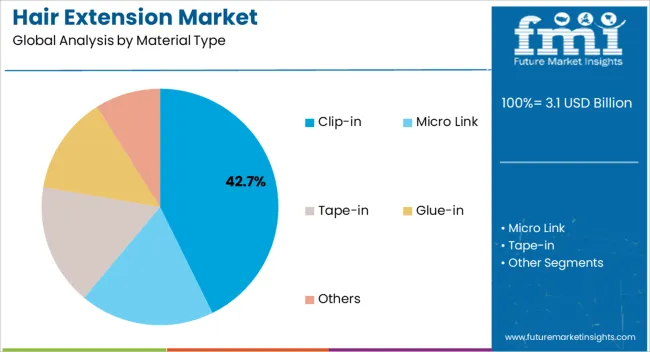
Clip-in hair extensions are popular among consumers. In 2023, clip-in hair extensions hold 45.8% of the hair extension market share by material type.
Clip-in hair extensions are easy to fit as a simple metal clip is attached to the head. Compared to other product types like glue-in and tape-in hair extensions, clip-in hair extensions can be easily used by consumers. Clip-in hair extensions are generally made of natural hair. Thus, clip-in hair extensions have a stronghold on the market.
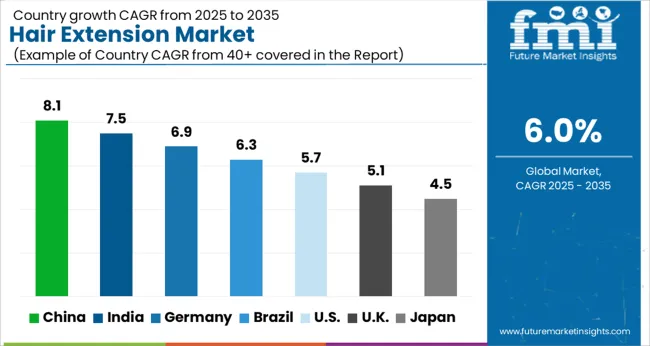
The Asia Pacific and Latin America regions are predicted to show strong growth in the market. However, North America and Europe continue to dominate the market.
The increasing purchasing power in North American and European countries is making consumers responsive to the appeal of hair extensions. The prevalence of fashion trends and influencers is also aiding the growth of the market in the Western world. North American and European consumers are increasingly conscious of appearances to keep up with fashion trends. Remy hair is also a strong point of consumer attention in the two regions.
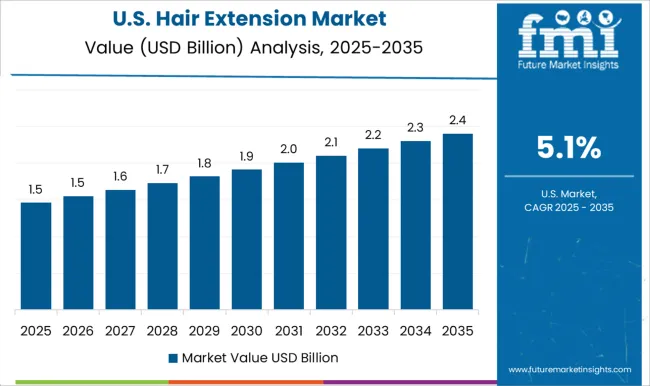
The United States continues to be a major country in the hair extension market. In 2023, the country accounts for 27.7% of the market share.
The rising number of beauty salons, barbershops, and other places is driving the sale of hair extensions in the United States. Big brands such as Great Lengths, Radswan, and Indique Hair also aid the growth of the market in the United States.
Canada is another North American country where the market flourishes. The Canadian market holds 7.5% of the market share.
Hair import from Asian countries, especially India and Vietnam, is increasing in North America. Hair acquired in Vietnam and India is used as raw material in Canada for producing hair extensions. Thus, the hair extension market is predicted to grow rapidly over the forecast period.
Europeans seek improvement in appearance. The United Kingdom is the leader in the European hair extension market. In 2023, the United Kingdom accounts for a 6.8% market share.
Rising fashion trends, as exemplified by celebrities and models, are leading to people paying more attention to appearances. Hair appearance is also being focused upon; thus, hair extensions are increasing in popularity throughout the United Kingdom.
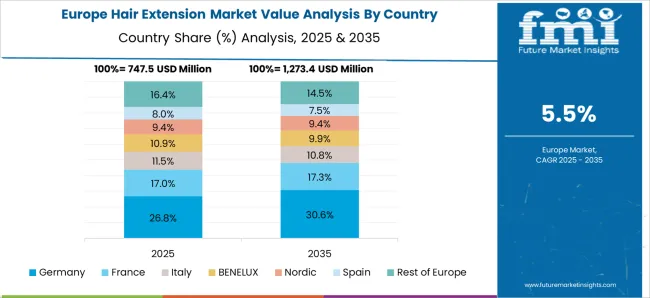
The hair extension market in Germany holds a market share of 5%. With a fashion-conscious population, there is a rise in demand for various hair extension products, including clip-in extensions, tape-in extensions, and fusion extensions.
In Germany, consumers often look for high-quality, natural-looking hair extensions. They are willing to invest in premium products that offer durability and a seamless blend with their natural hair.
China has a robust hair extension market, driven by its large population and changing beauty standards. Chinese consumers often look for a wide range of hair extension options, including synthetic and human hair extensions. Trends may vary from natural-looking extensions to more colorful and creative styles.
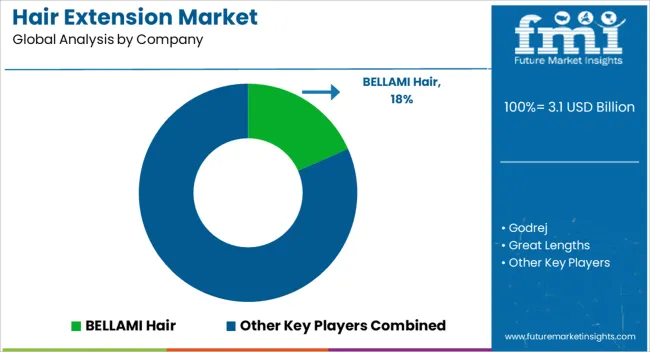
Players in the hair extension market are indulging in collaborations. Companies are increasing their market reach by partnering with beauty salons and fashion experts.
The market for hair extensions is highly competitive. Established brands tussle with small-scale enterprises for the consumers’ attention. Start-up culture is evident in the hair extension industry. Several start-ups have started selling hair extensions and have earned a reputable name in the market.
Recent Developments in the Hair Extension Market
Table 1: Global Market Value (US$ Million) Forecast by Region, 2018 to 2033
Table 2: Global Market Volume (Units) Forecast by Region, 2018 to 2033
Table 3: Global Market Value (US$ Million) Forecast by Fitting Type, 2018 to 2033
Table 4: Global Market Volume (Units) Forecast by Fitting Type, 2018 to 2033
Table 5: Global Market Value (US$ Million) Forecast by Category, 2018 to 2033
Table 6: Global Market Volume (Units) Forecast by Category, 2018 to 2033
Table 7: Global Market Value (US$ Million) Forecast by Type, 2018 to 2033
Table 8: Global Market Volume (Units) Forecast by Type, 2018 to 2033
Table 9: Global Market Value (US$ Million) Forecast by Sales Channel, 2018 to 2033
Table 10: Global Market Volume (Units) Forecast by Sales Channel, 2018 to 2033
Table 11: North America Market Value (US$ Million) Forecast by Country, 2018 to 2033
Table 12: North America Market Volume (Units) Forecast by Country, 2018 to 2033
Table 13: North America Market Value (US$ Million) Forecast by Fitting Type, 2018 to 2033
Table 14: North America Market Volume (Units) Forecast by Fitting Type, 2018 to 2033
Table 15: North America Market Value (US$ Million) Forecast by Category, 2018 to 2033
Table 16: North America Market Volume (Units) Forecast by Category, 2018 to 2033
Table 17: North America Market Value (US$ Million) Forecast by Type, 2018 to 2033
Table 18: North America Market Volume (Units) Forecast by Type, 2018 to 2033
Table 19: North America Market Value (US$ Million) Forecast by Sales Channel, 2018 to 2033
Table 20: North America Market Volume (Units) Forecast by Sales Channel, 2018 to 2033
Table 21: Latin America Market Value (US$ Million) Forecast by Country, 2018 to 2033
Table 22: Latin America Market Volume (Units) Forecast by Country, 2018 to 2033
Table 23: Latin America Market Value (US$ Million) Forecast by Fitting Type, 2018 to 2033
Table 24: Latin America Market Volume (Units) Forecast by Fitting Type, 2018 to 2033
Table 25: Latin America Market Value (US$ Million) Forecast by Category, 2018 to 2033
Table 26: Latin America Market Volume (Units) Forecast by Category, 2018 to 2033
Table 27: Latin America Market Value (US$ Million) Forecast by Type, 2018 to 2033
Table 28: Latin America Market Volume (Units) Forecast by Type, 2018 to 2033
Table 29: Latin America Market Value (US$ Million) Forecast by Sales Channel, 2018 to 2033
Table 30: Latin America Market Volume (Units) Forecast by Sales Channel, 2018 to 2033
Table 31: Western Europe Market Value (US$ Million) Forecast by Country, 2018 to 2033
Table 32: Western Europe Market Volume (Units) Forecast by Country, 2018 to 2033
Table 33: Western Europe Market Value (US$ Million) Forecast by Fitting Type, 2018 to 2033
Table 34: Western Europe Market Volume (Units) Forecast by Fitting Type, 2018 to 2033
Table 35: Western Europe Market Value (US$ Million) Forecast by Category, 2018 to 2033
Table 36: Western Europe Market Volume (Units) Forecast by Category, 2018 to 2033
Table 37: Western Europe Market Value (US$ Million) Forecast by Type, 2018 to 2033
Table 38: Western Europe Market Volume (Units) Forecast by Type, 2018 to 2033
Table 39: Western Europe Market Value (US$ Million) Forecast by Sales Channel, 2018 to 2033
Table 40: Western Europe Market Volume (Units) Forecast by Sales Channel, 2018 to 2033
Table 41: Eastern Europe Market Value (US$ Million) Forecast by Country, 2018 to 2033
Table 42: Eastern Europe Market Volume (Units) Forecast by Country, 2018 to 2033
Table 43: Eastern Europe Market Value (US$ Million) Forecast by Fitting Type, 2018 to 2033
Table 44: Eastern Europe Market Volume (Units) Forecast by Fitting Type, 2018 to 2033
Table 45: Eastern Europe Market Value (US$ Million) Forecast by Category, 2018 to 2033
Table 46: Eastern Europe Market Volume (Units) Forecast by Category, 2018 to 2033
Table 47: Eastern Europe Market Value (US$ Million) Forecast by Type, 2018 to 2033
Table 48: Eastern Europe Market Volume (Units) Forecast by Type, 2018 to 2033
Table 49: Eastern Europe Market Value (US$ Million) Forecast by Sales Channel, 2018 to 2033
Table 50: Eastern Europe Market Volume (Units) Forecast by Sales Channel, 2018 to 2033
Table 51: South Asia and Pacific Market Value (US$ Million) Forecast by Country, 2018 to 2033
Table 52: South Asia and Pacific Market Volume (Units) Forecast by Country, 2018 to 2033
Table 53: South Asia and Pacific Market Value (US$ Million) Forecast by Fitting Type, 2018 to 2033
Table 54: South Asia and Pacific Market Volume (Units) Forecast by Fitting Type, 2018 to 2033
Table 55: South Asia and Pacific Market Value (US$ Million) Forecast by Category, 2018 to 2033
Table 56: South Asia and Pacific Market Volume (Units) Forecast by Category, 2018 to 2033
Table 57: South Asia and Pacific Market Value (US$ Million) Forecast by Type, 2018 to 2033
Table 58: South Asia and Pacific Market Volume (Units) Forecast by Type, 2018 to 2033
Table 59: South Asia and Pacific Market Value (US$ Million) Forecast by Sales Channel, 2018 to 2033
Table 60: South Asia and Pacific Market Volume (Units) Forecast by Sales Channel, 2018 to 2033
Table 61: East Asia Market Value (US$ Million) Forecast by Country, 2018 to 2033
Table 62: East Asia Market Volume (Units) Forecast by Country, 2018 to 2033
Table 63: East Asia Market Value (US$ Million) Forecast by Fitting Type, 2018 to 2033
Table 64: East Asia Market Volume (Units) Forecast by Fitting Type, 2018 to 2033
Table 65: East Asia Market Value (US$ Million) Forecast by Category, 2018 to 2033
Table 66: East Asia Market Volume (Units) Forecast by Category, 2018 to 2033
Table 67: East Asia Market Value (US$ Million) Forecast by Type, 2018 to 2033
Table 68: East Asia Market Volume (Units) Forecast by Type, 2018 to 2033
Table 69: East Asia Market Value (US$ Million) Forecast by Sales Channel, 2018 to 2033
Table 70: East Asia Market Volume (Units) Forecast by Sales Channel, 2018 to 2033
Table 71: Middle East and Africa Market Value (US$ Million) Forecast by Country, 2018 to 2033
Table 72: Middle East and Africa Market Volume (Units) Forecast by Country, 2018 to 2033
Table 73: Middle East and Africa Market Value (US$ Million) Forecast by Fitting Type, 2018 to 2033
Table 74: Middle East and Africa Market Volume (Units) Forecast by Fitting Type, 2018 to 2033
Table 75: Middle East and Africa Market Value (US$ Million) Forecast by Category, 2018 to 2033
Table 76: Middle East and Africa Market Volume (Units) Forecast by Category, 2018 to 2033
Table 77: Middle East and Africa Market Value (US$ Million) Forecast by Type, 2018 to 2033
Table 78: Middle East and Africa Market Volume (Units) Forecast by Type, 2018 to 2033
Table 79: Middle East and Africa Market Value (US$ Million) Forecast by Sales Channel, 2018 to 2033
Table 80: Middle East and Africa Market Volume (Units) Forecast by Sales Channel, 2018 to 2033
Figure 1: Global Market Value (US$ Million) by Fitting Type, 2023 to 2033
Figure 2: Global Market Value (US$ Million) by Category, 2023 to 2033
Figure 3: Global Market Value (US$ Million) by Type, 2023 to 2033
Figure 4: Global Market Value (US$ Million) by Sales Channel, 2023 to 2033
Figure 5: Global Market Value (US$ Million) by Region, 2023 to 2033
Figure 6: Global Market Value (US$ Million) Analysis by Region, 2018 to 2033
Figure 7: Global Market Volume (Units) Analysis by Region, 2018 to 2033
Figure 8: Global Market Value Share (%) and BPS Analysis by Region, 2023 to 2033
Figure 9: Global Market Y-o-Y Growth (%) Projections by Region, 2023 to 2033
Figure 10: Global Market Value (US$ Million) Analysis by Fitting Type, 2018 to 2033
Figure 11: Global Market Volume (Units) Analysis by Fitting Type, 2018 to 2033
Figure 12: Global Market Value Share (%) and BPS Analysis by Fitting Type, 2023 to 2033
Figure 13: Global Market Y-o-Y Growth (%) Projections by Fitting Type, 2023 to 2033
Figure 14: Global Market Value (US$ Million) Analysis by Category, 2018 to 2033
Figure 15: Global Market Volume (Units) Analysis by Category, 2018 to 2033
Figure 16: Global Market Value Share (%) and BPS Analysis by Category, 2023 to 2033
Figure 17: Global Market Y-o-Y Growth (%) Projections by Category, 2023 to 2033
Figure 18: Global Market Value (US$ Million) Analysis by Type, 2018 to 2033
Figure 19: Global Market Volume (Units) Analysis by Type, 2018 to 2033
Figure 20: Global Market Value Share (%) and BPS Analysis by Type, 2023 to 2033
Figure 21: Global Market Y-o-Y Growth (%) Projections by Type, 2023 to 2033
Figure 22: Global Market Value (US$ Million) Analysis by Sales Channel, 2018 to 2033
Figure 23: Global Market Volume (Units) Analysis by Sales Channel, 2018 to 2033
Figure 24: Global Market Value Share (%) and BPS Analysis by Sales Channel, 2023 to 2033
Figure 25: Global Market Y-o-Y Growth (%) Projections by Sales Channel, 2023 to 2033
Figure 26: Global Market Attractiveness by Fitting Type, 2023 to 2033
Figure 27: Global Market Attractiveness by Category, 2023 to 2033
Figure 28: Global Market Attractiveness by Type, 2023 to 2033
Figure 29: Global Market Attractiveness by Sales Channel, 2023 to 2033
Figure 30: Global Market Attractiveness by Region, 2023 to 2033
Figure 31: North America Market Value (US$ Million) by Fitting Type, 2023 to 2033
Figure 32: North America Market Value (US$ Million) by Category, 2023 to 2033
Figure 33: North America Market Value (US$ Million) by Type, 2023 to 2033
Figure 34: North America Market Value (US$ Million) by Sales Channel, 2023 to 2033
Figure 35: North America Market Value (US$ Million) by Country, 2023 to 2033
Figure 36: North America Market Value (US$ Million) Analysis by Country, 2018 to 2033
Figure 37: North America Market Volume (Units) Analysis by Country, 2018 to 2033
Figure 38: North America Market Value Share (%) and BPS Analysis by Country, 2023 to 2033
Figure 39: North America Market Y-o-Y Growth (%) Projections by Country, 2023 to 2033
Figure 40: North America Market Value (US$ Million) Analysis by Fitting Type, 2018 to 2033
Figure 41: North America Market Volume (Units) Analysis by Fitting Type, 2018 to 2033
Figure 42: North America Market Value Share (%) and BPS Analysis by Fitting Type, 2023 to 2033
Figure 43: North America Market Y-o-Y Growth (%) Projections by Fitting Type, 2023 to 2033
Figure 44: North America Market Value (US$ Million) Analysis by Category, 2018 to 2033
Figure 45: North America Market Volume (Units) Analysis by Category, 2018 to 2033
Figure 46: North America Market Value Share (%) and BPS Analysis by Category, 2023 to 2033
Figure 47: North America Market Y-o-Y Growth (%) Projections by Category, 2023 to 2033
Figure 48: North America Market Value (US$ Million) Analysis by Type, 2018 to 2033
Figure 49: North America Market Volume (Units) Analysis by Type, 2018 to 2033
Figure 50: North America Market Value Share (%) and BPS Analysis by Type, 2023 to 2033
Figure 51: North America Market Y-o-Y Growth (%) Projections by Type, 2023 to 2033
Figure 52: North America Market Value (US$ Million) Analysis by Sales Channel, 2018 to 2033
Figure 53: North America Market Volume (Units) Analysis by Sales Channel, 2018 to 2033
Figure 54: North America Market Value Share (%) and BPS Analysis by Sales Channel, 2023 to 2033
Figure 55: North America Market Y-o-Y Growth (%) Projections by Sales Channel, 2023 to 2033
Figure 56: North America Market Attractiveness by Fitting Type, 2023 to 2033
Figure 57: North America Market Attractiveness by Category, 2023 to 2033
Figure 58: North America Market Attractiveness by Type, 2023 to 2033
Figure 59: North America Market Attractiveness by Sales Channel, 2023 to 2033
Figure 60: North America Market Attractiveness by Country, 2023 to 2033
Figure 61: Latin America Market Value (US$ Million) by Fitting Type, 2023 to 2033
Figure 62: Latin America Market Value (US$ Million) by Category, 2023 to 2033
Figure 63: Latin America Market Value (US$ Million) by Type, 2023 to 2033
Figure 64: Latin America Market Value (US$ Million) by Sales Channel, 2023 to 2033
Figure 65: Latin America Market Value (US$ Million) by Country, 2023 to 2033
Figure 66: Latin America Market Value (US$ Million) Analysis by Country, 2018 to 2033
Figure 67: Latin America Market Volume (Units) Analysis by Country, 2018 to 2033
Figure 68: Latin America Market Value Share (%) and BPS Analysis by Country, 2023 to 2033
Figure 69: Latin America Market Y-o-Y Growth (%) Projections by Country, 2023 to 2033
Figure 70: Latin America Market Value (US$ Million) Analysis by Fitting Type, 2018 to 2033
Figure 71: Latin America Market Volume (Units) Analysis by Fitting Type, 2018 to 2033
Figure 72: Latin America Market Value Share (%) and BPS Analysis by Fitting Type, 2023 to 2033
Figure 73: Latin America Market Y-o-Y Growth (%) Projections by Fitting Type, 2023 to 2033
Figure 74: Latin America Market Value (US$ Million) Analysis by Category, 2018 to 2033
Figure 75: Latin America Market Volume (Units) Analysis by Category, 2018 to 2033
Figure 76: Latin America Market Value Share (%) and BPS Analysis by Category, 2023 to 2033
Figure 77: Latin America Market Y-o-Y Growth (%) Projections by Category, 2023 to 2033
Figure 78: Latin America Market Value (US$ Million) Analysis by Type, 2018 to 2033
Figure 79: Latin America Market Volume (Units) Analysis by Type, 2018 to 2033
Figure 80: Latin America Market Value Share (%) and BPS Analysis by Type, 2023 to 2033
Figure 81: Latin America Market Y-o-Y Growth (%) Projections by Type, 2023 to 2033
Figure 82: Latin America Market Value (US$ Million) Analysis by Sales Channel, 2018 to 2033
Figure 83: Latin America Market Volume (Units) Analysis by Sales Channel, 2018 to 2033
Figure 84: Latin America Market Value Share (%) and BPS Analysis by Sales Channel, 2023 to 2033
Figure 85: Latin America Market Y-o-Y Growth (%) Projections by Sales Channel, 2023 to 2033
Figure 86: Latin America Market Attractiveness by Fitting Type, 2023 to 2033
Figure 87: Latin America Market Attractiveness by Category, 2023 to 2033
Figure 88: Latin America Market Attractiveness by Type, 2023 to 2033
Figure 89: Latin America Market Attractiveness by Sales Channel, 2023 to 2033
Figure 90: Latin America Market Attractiveness by Country, 2023 to 2033
Figure 91: Western Europe Market Value (US$ Million) by Fitting Type, 2023 to 2033
Figure 92: Western Europe Market Value (US$ Million) by Category, 2023 to 2033
Figure 93: Western Europe Market Value (US$ Million) by Type, 2023 to 2033
Figure 94: Western Europe Market Value (US$ Million) by Sales Channel, 2023 to 2033
Figure 95: Western Europe Market Value (US$ Million) by Country, 2023 to 2033
Figure 96: Western Europe Market Value (US$ Million) Analysis by Country, 2018 to 2033
Figure 97: Western Europe Market Volume (Units) Analysis by Country, 2018 to 2033
Figure 98: Western Europe Market Value Share (%) and BPS Analysis by Country, 2023 to 2033
Figure 99: Western Europe Market Y-o-Y Growth (%) Projections by Country, 2023 to 2033
Figure 100: Western Europe Market Value (US$ Million) Analysis by Fitting Type, 2018 to 2033
Figure 101: Western Europe Market Volume (Units) Analysis by Fitting Type, 2018 to 2033
Figure 102: Western Europe Market Value Share (%) and BPS Analysis by Fitting Type, 2023 to 2033
Figure 103: Western Europe Market Y-o-Y Growth (%) Projections by Fitting Type, 2023 to 2033
Figure 104: Western Europe Market Value (US$ Million) Analysis by Category, 2018 to 2033
Figure 105: Western Europe Market Volume (Units) Analysis by Category, 2018 to 2033
Figure 106: Western Europe Market Value Share (%) and BPS Analysis by Category, 2023 to 2033
Figure 107: Western Europe Market Y-o-Y Growth (%) Projections by Category, 2023 to 2033
Figure 108: Western Europe Market Value (US$ Million) Analysis by Type, 2018 to 2033
Figure 109: Western Europe Market Volume (Units) Analysis by Type, 2018 to 2033
Figure 110: Western Europe Market Value Share (%) and BPS Analysis by Type, 2023 to 2033
Figure 111: Western Europe Market Y-o-Y Growth (%) Projections by Type, 2023 to 2033
Figure 112: Western Europe Market Value (US$ Million) Analysis by Sales Channel, 2018 to 2033
Figure 113: Western Europe Market Volume (Units) Analysis by Sales Channel, 2018 to 2033
Figure 114: Western Europe Market Value Share (%) and BPS Analysis by Sales Channel, 2023 to 2033
Figure 115: Western Europe Market Y-o-Y Growth (%) Projections by Sales Channel, 2023 to 2033
Figure 116: Western Europe Market Attractiveness by Fitting Type, 2023 to 2033
Figure 117: Western Europe Market Attractiveness by Category, 2023 to 2033
Figure 118: Western Europe Market Attractiveness by Type, 2023 to 2033
Figure 119: Western Europe Market Attractiveness by Sales Channel, 2023 to 2033
Figure 120: Western Europe Market Attractiveness by Country, 2023 to 2033
Figure 121: Eastern Europe Market Value (US$ Million) by Fitting Type, 2023 to 2033
Figure 122: Eastern Europe Market Value (US$ Million) by Category, 2023 to 2033
Figure 123: Eastern Europe Market Value (US$ Million) by Type, 2023 to 2033
Figure 124: Eastern Europe Market Value (US$ Million) by Sales Channel, 2023 to 2033
Figure 125: Eastern Europe Market Value (US$ Million) by Country, 2023 to 2033
Figure 126: Eastern Europe Market Value (US$ Million) Analysis by Country, 2018 to 2033
Figure 127: Eastern Europe Market Volume (Units) Analysis by Country, 2018 to 2033
Figure 128: Eastern Europe Market Value Share (%) and BPS Analysis by Country, 2023 to 2033
Figure 129: Eastern Europe Market Y-o-Y Growth (%) Projections by Country, 2023 to 2033
Figure 130: Eastern Europe Market Value (US$ Million) Analysis by Fitting Type, 2018 to 2033
Figure 131: Eastern Europe Market Volume (Units) Analysis by Fitting Type, 2018 to 2033
Figure 132: Eastern Europe Market Value Share (%) and BPS Analysis by Fitting Type, 2023 to 2033
Figure 133: Eastern Europe Market Y-o-Y Growth (%) Projections by Fitting Type, 2023 to 2033
Figure 134: Eastern Europe Market Value (US$ Million) Analysis by Category, 2018 to 2033
Figure 135: Eastern Europe Market Volume (Units) Analysis by Category, 2018 to 2033
Figure 136: Eastern Europe Market Value Share (%) and BPS Analysis by Category, 2023 to 2033
Figure 137: Eastern Europe Market Y-o-Y Growth (%) Projections by Category, 2023 to 2033
Figure 138: Eastern Europe Market Value (US$ Million) Analysis by Type, 2018 to 2033
Figure 139: Eastern Europe Market Volume (Units) Analysis by Type, 2018 to 2033
Figure 140: Eastern Europe Market Value Share (%) and BPS Analysis by Type, 2023 to 2033
Figure 141: Eastern Europe Market Y-o-Y Growth (%) Projections by Type, 2023 to 2033
Figure 142: Eastern Europe Market Value (US$ Million) Analysis by Sales Channel, 2018 to 2033
Figure 143: Eastern Europe Market Volume (Units) Analysis by Sales Channel, 2018 to 2033
Figure 144: Eastern Europe Market Value Share (%) and BPS Analysis by Sales Channel, 2023 to 2033
Figure 145: Eastern Europe Market Y-o-Y Growth (%) Projections by Sales Channel, 2023 to 2033
Figure 146: Eastern Europe Market Attractiveness by Fitting Type, 2023 to 2033
Figure 147: Eastern Europe Market Attractiveness by Category, 2023 to 2033
Figure 148: Eastern Europe Market Attractiveness by Type, 2023 to 2033
Figure 149: Eastern Europe Market Attractiveness by Sales Channel, 2023 to 2033
Figure 150: Eastern Europe Market Attractiveness by Country, 2023 to 2033
Figure 151: South Asia and Pacific Market Value (US$ Million) by Fitting Type, 2023 to 2033
Figure 152: South Asia and Pacific Market Value (US$ Million) by Category, 2023 to 2033
Figure 153: South Asia and Pacific Market Value (US$ Million) by Type, 2023 to 2033
Figure 154: South Asia and Pacific Market Value (US$ Million) by Sales Channel, 2023 to 2033
Figure 155: South Asia and Pacific Market Value (US$ Million) by Country, 2023 to 2033
Figure 156: South Asia and Pacific Market Value (US$ Million) Analysis by Country, 2018 to 2033
Figure 157: South Asia and Pacific Market Volume (Units) Analysis by Country, 2018 to 2033
Figure 158: South Asia and Pacific Market Value Share (%) and BPS Analysis by Country, 2023 to 2033
Figure 159: South Asia and Pacific Market Y-o-Y Growth (%) Projections by Country, 2023 to 2033
Figure 160: South Asia and Pacific Market Value (US$ Million) Analysis by Fitting Type, 2018 to 2033
Figure 161: South Asia and Pacific Market Volume (Units) Analysis by Fitting Type, 2018 to 2033
Figure 162: South Asia and Pacific Market Value Share (%) and BPS Analysis by Fitting Type, 2023 to 2033
Figure 163: South Asia and Pacific Market Y-o-Y Growth (%) Projections by Fitting Type, 2023 to 2033
Figure 164: South Asia and Pacific Market Value (US$ Million) Analysis by Category, 2018 to 2033
Figure 165: South Asia and Pacific Market Volume (Units) Analysis by Category, 2018 to 2033
Figure 166: South Asia and Pacific Market Value Share (%) and BPS Analysis by Category, 2023 to 2033
Figure 167: South Asia and Pacific Market Y-o-Y Growth (%) Projections by Category, 2023 to 2033
Figure 168: South Asia and Pacific Market Value (US$ Million) Analysis by Type, 2018 to 2033
Figure 169: South Asia and Pacific Market Volume (Units) Analysis by Type, 2018 to 2033
Figure 170: South Asia and Pacific Market Value Share (%) and BPS Analysis by Type, 2023 to 2033
Figure 171: South Asia and Pacific Market Y-o-Y Growth (%) Projections by Type, 2023 to 2033
Figure 172: South Asia and Pacific Market Value (US$ Million) Analysis by Sales Channel, 2018 to 2033
Figure 173: South Asia and Pacific Market Volume (Units) Analysis by Sales Channel, 2018 to 2033
Figure 174: South Asia and Pacific Market Value Share (%) and BPS Analysis by Sales Channel, 2023 to 2033
Figure 175: South Asia and Pacific Market Y-o-Y Growth (%) Projections by Sales Channel, 2023 to 2033
Figure 176: South Asia and Pacific Market Attractiveness by Fitting Type, 2023 to 2033
Figure 177: South Asia and Pacific Market Attractiveness by Category, 2023 to 2033
Figure 178: South Asia and Pacific Market Attractiveness by Type, 2023 to 2033
Figure 179: South Asia and Pacific Market Attractiveness by Sales Channel, 2023 to 2033
Figure 180: South Asia and Pacific Market Attractiveness by Country, 2023 to 2033
Figure 181: East Asia Market Value (US$ Million) by Fitting Type, 2023 to 2033
Figure 182: East Asia Market Value (US$ Million) by Category, 2023 to 2033
Figure 183: East Asia Market Value (US$ Million) by Type, 2023 to 2033
Figure 184: East Asia Market Value (US$ Million) by Sales Channel, 2023 to 2033
Figure 185: East Asia Market Value (US$ Million) by Country, 2023 to 2033
Figure 186: East Asia Market Value (US$ Million) Analysis by Country, 2018 to 2033
Figure 187: East Asia Market Volume (Units) Analysis by Country, 2018 to 2033
Figure 188: East Asia Market Value Share (%) and BPS Analysis by Country, 2023 to 2033
Figure 189: East Asia Market Y-o-Y Growth (%) Projections by Country, 2023 to 2033
Figure 190: East Asia Market Value (US$ Million) Analysis by Fitting Type, 2018 to 2033
Figure 191: East Asia Market Volume (Units) Analysis by Fitting Type, 2018 to 2033
Figure 192: East Asia Market Value Share (%) and BPS Analysis by Fitting Type, 2023 to 2033
Figure 193: East Asia Market Y-o-Y Growth (%) Projections by Fitting Type, 2023 to 2033
Figure 194: East Asia Market Value (US$ Million) Analysis by Category, 2018 to 2033
Figure 195: East Asia Market Volume (Units) Analysis by Category, 2018 to 2033
Figure 196: East Asia Market Value Share (%) and BPS Analysis by Category, 2023 to 2033
Figure 197: East Asia Market Y-o-Y Growth (%) Projections by Category, 2023 to 2033
Figure 198: East Asia Market Value (US$ Million) Analysis by Type, 2018 to 2033
Figure 199: East Asia Market Volume (Units) Analysis by Type, 2018 to 2033
Figure 200: East Asia Market Value Share (%) and BPS Analysis by Type, 2023 to 2033
Figure 201: East Asia Market Y-o-Y Growth (%) Projections by Type, 2023 to 2033
Figure 202: East Asia Market Value (US$ Million) Analysis by Sales Channel, 2018 to 2033
Figure 203: East Asia Market Volume (Units) Analysis by Sales Channel, 2018 to 2033
Figure 204: East Asia Market Value Share (%) and BPS Analysis by Sales Channel, 2023 to 2033
Figure 205: East Asia Market Y-o-Y Growth (%) Projections by Sales Channel, 2023 to 2033
Figure 206: East Asia Market Attractiveness by Fitting Type, 2023 to 2033
Figure 207: East Asia Market Attractiveness by Category, 2023 to 2033
Figure 208: East Asia Market Attractiveness by Type, 2023 to 2033
Figure 209: East Asia Market Attractiveness by Sales Channel, 2023 to 2033
Figure 210: East Asia Market Attractiveness by Country, 2023 to 2033
Figure 211: Middle East and Africa Market Value (US$ Million) by Fitting Type, 2023 to 2033
Figure 212: Middle East and Africa Market Value (US$ Million) by Category, 2023 to 2033
Figure 213: Middle East and Africa Market Value (US$ Million) by Type, 2023 to 2033
Figure 214: Middle East and Africa Market Value (US$ Million) by Sales Channel, 2023 to 2033
Figure 215: Middle East and Africa Market Value (US$ Million) by Country, 2023 to 2033
Figure 216: Middle East and Africa Market Value (US$ Million) Analysis by Country, 2018 to 2033
Figure 217: Middle East and Africa Market Volume (Units) Analysis by Country, 2018 to 2033
Figure 218: Middle East and Africa Market Value Share (%) and BPS Analysis by Country, 2023 to 2033
Figure 219: Middle East and Africa Market Y-o-Y Growth (%) Projections by Country, 2023 to 2033
Figure 220: Middle East and Africa Market Value (US$ Million) Analysis by Fitting Type, 2018 to 2033
Figure 221: Middle East and Africa Market Volume (Units) Analysis by Fitting Type, 2018 to 2033
Figure 222: Middle East and Africa Market Value Share (%) and BPS Analysis by Fitting Type, 2023 to 2033
Figure 223: Middle East and Africa Market Y-o-Y Growth (%) Projections by Fitting Type, 2023 to 2033
Figure 224: Middle East and Africa Market Value (US$ Million) Analysis by Category, 2018 to 2033
Figure 225: Middle East and Africa Market Volume (Units) Analysis by Category, 2018 to 2033
Figure 226: Middle East and Africa Market Value Share (%) and BPS Analysis by Category, 2023 to 2033
Figure 227: Middle East and Africa Market Y-o-Y Growth (%) Projections by Category, 2023 to 2033
Figure 228: Middle East and Africa Market Value (US$ Million) Analysis by Type, 2018 to 2033
Figure 229: Middle East and Africa Market Volume (Units) Analysis by Type, 2018 to 2033
Figure 230: Middle East and Africa Market Value Share (%) and BPS Analysis by Type, 2023 to 2033
Figure 231: Middle East and Africa Market Y-o-Y Growth (%) Projections by Type, 2023 to 2033
Figure 232: Middle East and Africa Market Value (US$ Million) Analysis by Sales Channel, 2018 to 2033
Figure 233: Middle East and Africa Market Volume (Units) Analysis by Sales Channel, 2018 to 2033
Figure 234: Middle East and Africa Market Value Share (%) and BPS Analysis by Sales Channel, 2023 to 2033
Figure 235: Middle East and Africa Market Y-o-Y Growth (%) Projections by Sales Channel, 2023 to 2033
Figure 236: Middle East and Africa Market Attractiveness by Fitting Type, 2023 to 2033
Figure 237: Middle East and Africa Market Attractiveness by Category, 2023 to 2033
Figure 238: Middle East and Africa Market Attractiveness by Type, 2023 to 2033
Figure 239: Middle East and Africa Market Attractiveness by Sales Channel, 2023 to 2033
Figure 240: Middle East and Africa Market Attractiveness by Country, 2023 to 2033
The size of the hair extension market is USD 2,721.8 million in 2023.
Biological problems like alopecia and the rising consumer focus on hair appearance are propelling the demand.
The United States is the leader in the hair extension market, with a market share of 27.7%.
The hair extension market is predicted to reach USD 5,000.2 million by 2033.
The hair extension market is predicted to progress at a CAGR of 6.3% through 2033.
Explore Similar Insights
Thank you!
You will receive an email from our Business Development Manager. Please be sure to check your SPAM/JUNK folder too.