Reports

- Global Locations -

Headquarters

Future Market Insights, Inc.

Christiana Corporate, 200
Continental Drive, Suite 401,
Newark, Delaware - 19713,
United States

T: +1-845-579-5705

Americas

Future Market Insights, Inc.

616 Corporate Way, Suite 2-9018,
Valley Cottage, NY 10989, United States

T: +1-347-918-3531

MEA

Future Market Insights

1602-6 Jumeirah Bay X2 Tower, Plot No: JLT-PH2-X2A,
Jumeirah Lakes Towers, Dubai,
United Arab Emirates

Europe

Future Market Insights

3rd Floor, 207 Regent Street,
W1B 3HH London
United Kingdom

T: + 44 (0) 20 8123 9659
D: +44 (0) 20 3287 4268

Asia Pacific

Future Market Insights

IndiaLand Global Tech Park, Unit UG-1, Behind Grand HighStreet, Phase 1, Hinjawadi, MH, Pune – 411057, India

Hair Serums Ingredient Market Overview (2022-2032)

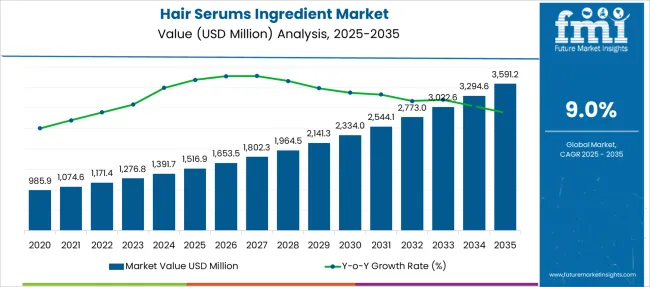
[250 Pages Report] The global hair serums ingredient market is expected to garner a market value of US$ 1,171.36 Million in 2022, while recording a CAGR of 9% during the 2022-2032 forecast period. By 2032, sales of hair serums ingredients are expected to reach US$ 2,772.96 Million.

Report Attribute Details
Estimated Base Year Value (2021) US$ 1,081.34 Million
Expected Market Value (2022) US$ 1,171.36 Million
Anticipated Forecast Value (2032) US$ 2,772.96 Million
Projected Growth Rate (2022-2032) 9% CAGR

Hair serums are the hair nourishing liquid that is popular amongst women, mostly. However, with the increasing penetration of the internet and the growing influence of social media among the expanding population, it has garnered significant traction amongst men as well. It is used as a treatment that is usually formulated using silicones providing protection over the hair fiber.

The smooth layer of protection provided by the serum gives a shiner texture to the hair. With the increasing advertisements in media and beauty salons, hair serums have gained significant popularity in the global market. Moreover, the growing endorsements by celebrities and social media influencers are projected to further augment the demand for hair serums, thereby growing the demand for their ingredients.

The players of the market focus on the production of organic hair serum ingredients since it is likely to offer numerous opportunities in the forecast period. With the expansion of the cosmetic industry across the globe, new product launches are expected during the forecast period, growing the industry. Moreover, with the advent of advanced technologies, the product is likely to be more affordable and is expected to penetrate various untapped regions, thereby, benefitting the market in the coming time.

Don't pay for what you don't need

Customize your report by selecting specific countries or regions and save 30%!

What are the Factors Boosting the Global Hair Serum Market?

The increasing disposable income, changing hairstyle trends, population growth, and the increasing roughness of hair due to growing air pollution have contributed significantly to the market expansion during the forecast period. Further, the growing usage of professional haircare products in developed regions and the increasing demand for organic hair serum are predicted to augment the industry in the forecast period.

The growing concern regarding hair fall and the desire to have healthy hair is likely to further enhance the demand for hair serum ingredients during the forecast period. Furthermore, the production of paraben-free hair serums and the increasing R&D on the innovation of the product are likely to offer a significant boost to the market in the coming time. Moreover, the increasing number of male consumers is also projected to bolster the industry.

What Factors are Impeding Market Growth?

Lack of awareness among poor regions is expected to be a significant cause hampering the marker during the forecast period. Further, the presence of harmful ingredients in some hair serums can damage hair, thereby, reducing the market size.

Despite the robust popularity of the product, affordability remains another challenge for the market, which hampers the market size. Moreover, difficulty in approval of the product can further limit the market expansion in the coming time.
Sneha Verghese
Sneha Verghese

Principal Consultant

Talk to Analyst

Find your sweet spots for generating winning opportunities in this market.

Which Region is projected to lead the Market during the Forecast Period?

As per the analysis, Europe is anticipated to lead the market during the forecast period. The growth of the regional market can be attributed to the high disposable income and a large consumer base. Further, the high disposable income is expected to further grow the market in the coming time. Moreover, the region has an established fashion industry, which is a significant consumer of such personal care products, thereby, supporting the market growth in the forecast period.

Countries such as the UK is likely to make a notable contribution in developing the market during the forecast period. The contribution of the country can be attributed to the rising awareness, increased investment of players and the growing R&D to innovate products. In addition, rising demand for styling products, the manufacturers are making significant investments to offer products that are up to the expectations of the consumers, thereby, benefitting the industry.

What is the Role of APAC in Augmenting the Market Size?

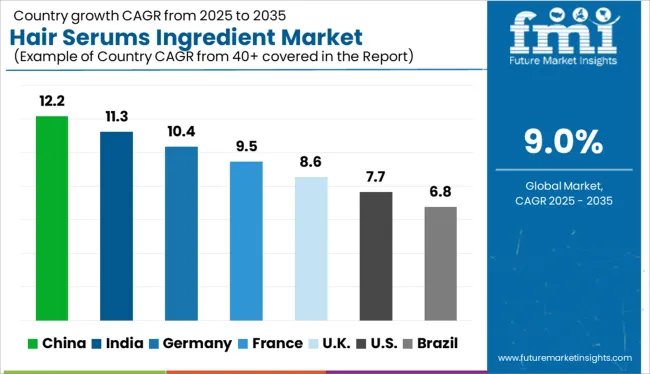
The APAC market has been identified as the most lucrative region for the market. The region has considerable potential to expand the market owing to the presence of developing nations such as India, China, Japan, and Korea. South Korea is the hub for cosmetics and is a provider of various innovative products that could boost the market in the forecast period. Moreover, the increasing disposable income and the growing awareness among the population are other salient causes expanding the regional market.

Countries like India, China, and South Korea are the epicenter of the fertility of the market. The increasing population, penetration of e-commerce, growing awareness about organic products are projected to boost the industry. Moreover, the advent of numerous beauty startups in India is likely to offer significant opportunities to the manufacturers.
Get the data you need at a Fraction of the cost

Personalize your report by choosing insights you need
and save 40%!

Market Competition

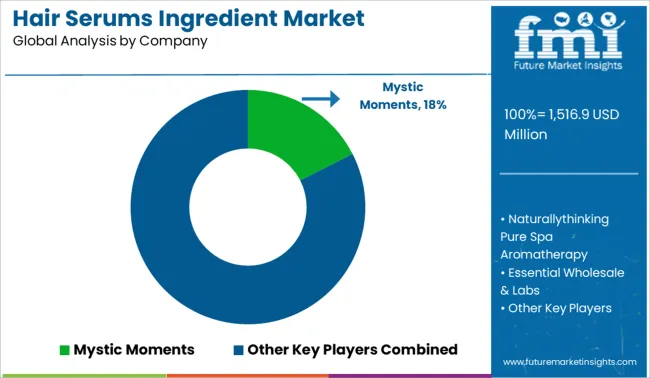
Some eminent players of the market include Mystic Moments, Naturallythinking Pure Spa Aromatherapy, Essential Wholesale & Labs, Parchem fine & Specialty Chemicals, Ingredients To Die For a Aroma Alternatives Ltd. Co., Pharmacos, Composition Materials Co., Inc., N-ESSENTIALS, Fa. Rosarome, Glamour Cosmetics, alexmo cosmetics, Gracefruit Limited, VOYAGEUR SOAP & CO., and Les Âmes Fleurs Inc. among others.

 Scope of Report

Report Attribute Details
Growth Rate CAGR of 9% from 2022 to 2032
Base Year for Estimation 2021
Historical Data 2015 to 2020
Forecast Period 2022 to 2032
Quantitative Units Revenue in USD Million, Volume in Kilotons and CAGR from 2022 to 2032
Report Coverage Revenue Forecast, Volume Forecast, Company Ranking, Competitive Landscape, Growth Factors, Trends and Pricing Analysis
Segments Covered
  • Ingredient Type
  • Sales Channel
  • Nature
  • Region
Regions Covered
  • North America
  • Latin America
  • Europe
  • South Asia
  • East Asia
  • Oceania
  • Middle East and Africa
Key Countries Profiled
  • USA
  • Canada
  • Brazil
  • Argentina
  • Chile
  • Peru
  • Germany
  • UK
  • France
  • Spain
  • Italy
  • Nordics
  • BENELUX
  • India
  • Thailand
  • Indonesia
  • Malaysia
  • China
  • Japan
  • South Korea
  • Australia & New Zealand
  • GCC
  • South Africa
  • Turkey
  • Iran
  • Israel
Key Companies Profiled
  • Mystic Moments
  • Naturallythinking Pure Spa Aromatherapy
  • Essential Wholesale & Labs
  • Parchem fine & Specialty Chemicals
  • Ingredients To Die For
  • Aroma Alternatives Co. Ltd.
  • Pharmacos
  • Composition Materials Co., Inc.
  • N-ESSENTIALS
  • Fa. Rosarome
  • Glamour Cosmetics
  • Alexmo Cosmetics
  • Gracefruit Limited
  • VOYAGEUR SOAP & CO.
  • Les Âmes Fleurs Inc.
Customization Available Upon Request

Key Segments Profiled in the Global Hair Serum Ingredient Market

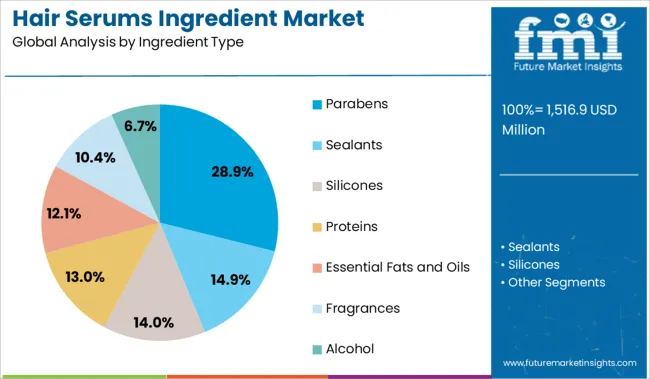
Ingredient Type:

  • Hair Serum Parabens
  • Hair Serum Sealants
  • Hair Serum Silicones
  • Hair Serum Proteins
  • Hair Serum Essential Fats and Oils
  • Hair Serum Fragrances
  • Hair Serum Alcohol

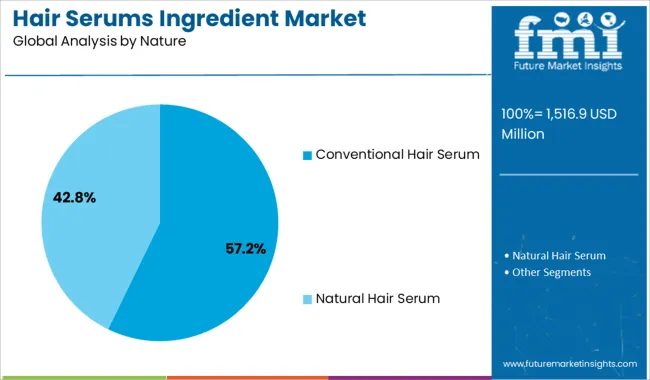
Nature:

  • Conventional Hair Serum
  • Natural Hair Serum

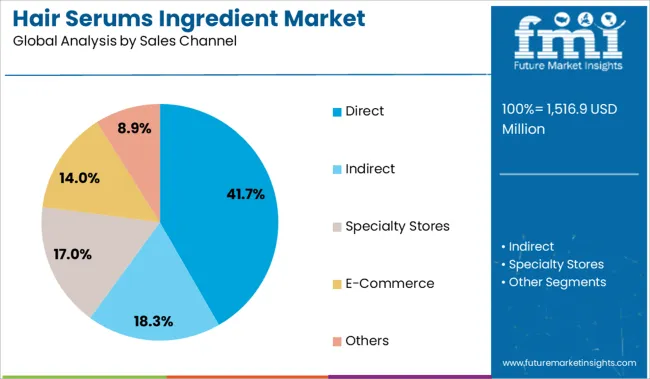
Sales Channel:

  • Direct Hair Serums Ingredient Sales
  • Indirect Hair Serums Ingredient Sales
  • Specialty Stores
  • E-Commerce
  • Others

Region:

  • North America
  • Latin America
  • Europe
  • South Asia
  • East Asia
  • Oceania
  • Middle East & Africa

Frequently Asked Questions

What is the expected market outlook for hair serums ingredients until 2032?

FMI projects the hair serums ingredients market to expand at a 9% CAGR through 2032

Which region is forecast to be the most lucrative for Hair Serum Ingredients Market growth?

APAC is projected to be the most lucrative market during the forecast period

Which are some prominent Hair Serum Ingredients Market?

Mystic Moments and Naturallythinking Pure Spa Aromatherapy, among others are some of the eminent players in the market.

Table of Content

1. Executive Summary

    1.1. Global Market Outlook

    1.2. Demand-side Trends

    1.3. Supply-side Trends

    1.4. Technology Roadmap Analysis

    1.5. Analysis and Recommendations

2. Market Overview

    2.1. Market Coverage / Taxonomy

    2.2. Market Definition / Scope / Limitations

3. Market Background

    3.1. Market Dynamics

        3.1.1. Drivers

        3.1.2. Restraints

        3.1.3. Opportunity

        3.1.4. Trends

    3.2. Scenario Forecast

        3.2.1. Demand in Optimistic Scenario

        3.2.2. Demand in Likely Scenario

        3.2.3. Demand in Conservative Scenario

    3.3. Opportunity Map Analysis

    3.4. Investment Feasibility Matrix

    3.5. PESTLE and Porter’s Analysis

    3.6. Regulatory Landscape

        3.6.1. By Key Regions

        3.6.2. By Key Countries

4. Global Market Analysis 2017-2021 and Forecast, 2022-2032

    4.1. Historical Market Size Value (US$ Mn) & Volume (Units) Analysis, 2017-2021

    4.2. Current and Future Market Size Value (US$ Mn) & Volume (Units) Projections, 2022-2032

        4.2.1. Y-o-Y Growth Trend Analysis

        4.2.2. Absolute $ Opportunity Analysis

5. Global Market Analysis 2017-2021 and Forecast 2022-2032, By Ingredient Type

    5.1. Introduction / Key Findings

    5.2. Historical Market Size Value (US$ Mn) & Volume (Units) Analysis By Ingredient Type, 2017-2021

    5.3. Current and Future Market Size Value (US$ Mn) & Volume (Units) Analysis and Forecast By Ingredient Type, 2022-2032

        5.3.1. Parabens

        5.3.2. Sealants

        5.3.3. Silicones

        5.3.4. Proteins

        5.3.5. Essential Fats and Oils

        5.3.6. Fragrances

        5.3.7. Alcohol

    5.4. Y-o-Y Growth Trend Analysis By Ingredient Type, 2017-2021

    5.5. Absolute $ Opportunity Analysis By Ingredient Type, 2022-2032

6. Global Market Analysis 2017-2021 and Forecast 2022-2032, By Sales Channel

    6.1. Introduction / Key Findings

    6.2. Historical Market Size Value (US$ Mn) & Volume (Units) Analysis By Sales Channel, 2017-2021

    6.3. Current and Future Market Size Value (US$ Mn) & Volume (Units) Analysis and Forecast By Sales Channel, 2022-2032

        6.3.1. Direct

        6.3.2. Indirect

        6.3.3. Specialty Stores

        6.3.4. E-Commerce

        6.3.5. Others

    6.4. Y-o-Y Growth Trend Analysis By Sales Channel, 2017-2021

    6.5. Absolute $ Opportunity Analysis By Sales Channel, 2022-2032

7. Global Market Analysis 2017-2021 and Forecast 2022-2032, By Nature

    7.1. Introduction / Key Findings

    7.2. Historical Market Size Value (US$ Mn) & Volume (Units) Analysis By Nature, 2017-2021

    7.3. Current and Future Market Size Value (US$ Mn) & Volume (Units) Analysis and Forecast By Nature, 2022-2032

        7.3.1. Conventional Hair Serum

        7.3.2. Natural Hair Serum

    7.4. Y-o-Y Growth Trend Analysis By Nature, 2017-2021

    7.5. Absolute $ Opportunity Analysis By Nature, 2022-2032

8. Global Market Analysis 2017-2021 and Forecast 2022-2032, By Region

    8.1. Introduction

    8.2. Historical Market Size Value (US$ Mn) & Volume (Units) Analysis By Region, 2017-2021

    8.3. Current Market Size Value (US$ Mn) & Volume (Units) Analysis and Forecast By Region, 2022-2032

        8.3.1. North America

        8.3.2. Latin America

        8.3.3. Europe

        8.3.4. Asia Pacific

        8.3.5. MEA

    8.4. Market Attractiveness Analysis By Region

9. North America Market Analysis 2017-2021 and Forecast 2022-2032, By Country

    9.1. Historical Market Size Value (US$ Mn) & Volume (Units) Trend Analysis By Market Taxonomy, 2017-2021

    9.2. Market Size Value (US$ Mn) & Volume (Units) Forecast By Market Taxonomy, 2022-2032

        9.2.1. By Country

            9.2.1.1. U.S.

            9.2.1.2. Canada

        9.2.2. By Ingredient Type

        9.2.3. By Sales Channel

        9.2.4. By Nature

    9.3. Market Attractiveness Analysis

        9.3.1. By Country

        9.3.2. By Ingredient Type

        9.3.3. By Sales Channel

        9.3.4. By Nature

    9.4. Key Takeaways

10. Latin America Market Analysis 2017-2021 and Forecast 2022-2032, By Country

    10.1. Historical Market Size Value (US$ Mn) & Volume (Units) Trend Analysis By Market Taxonomy, 2017-2021

    10.2. Market Size Value (US$ Mn) & Volume (Units) Forecast By Market Taxonomy, 2022-2032

        10.2.1. By Country

            10.2.1.1. Brazil

            10.2.1.2. Mexico

            10.2.1.3. Rest of Latin America

        10.2.2. By Ingredient Type

        10.2.3. By Sales Channel

        10.2.4. By Nature

    10.3. Market Attractiveness Analysis

        10.3.1. By Country

        10.3.2. By Ingredient Type

        10.3.3. By Sales Channel

        10.3.4. By Nature

    10.4. Key Takeaways

11. Europe Market Analysis 2017-2021 and Forecast 2022-2032, By Country

    11.1. Historical Market Size Value (US$ Mn) & Volume (Units) Trend Analysis By Market Taxonomy, 2017-2021

    11.2. Market Size Value (US$ Mn) & Volume (Units) Forecast By Market Taxonomy, 2022-2032

        11.2.1. By Country

            11.2.1.1. Germany

            11.2.1.2. Italy

            11.2.1.3. France

            11.2.1.4. U.K.

            11.2.1.5. Spain

            11.2.1.6. Russia

            11.2.1.7. BENELUX

            11.2.1.8. Rest of Europe

        11.2.2. By Ingredient Type

        11.2.3. By Sales Channel

        11.2.4. By Nature

    11.3. Market Attractiveness Analysis

        11.3.1. By Country

        11.3.2. By Ingredient Type

        11.3.3. By Sales Channel

        11.3.4. By Nature

    11.4. Key Takeaways

12. Asia Pacific Market Analysis 2017-2021 and Forecast 2022-2032, By Country

    12.1. Historical Market Size Value (US$ Mn) & Volume (Units) Trend Analysis By Market Taxonomy, 2017-2021

    12.2. Market Size Value (US$ Mn) & Volume (Units) Forecast By Market Taxonomy, 2022-2032

        12.2.1. By Country

            12.2.1.1. China

            12.2.1.2. Japan

            12.2.1.3. South Korea

            12.2.1.4. India

            12.2.1.5. Rest of Asia Pacific

        12.2.2. By Ingredient Type

        12.2.3. By Sales Channel

        12.2.4. By Nature

    12.3. Market Attractiveness Analysis

        12.3.1. By Country

        12.3.2. By Ingredient Type

        12.3.3. By Sales Channel

        12.3.4. By Nature

    12.4. Key Takeaways

13. MEA Market Analysis 2017-2021 and Forecast 2022-2032, By Country

    13.1. Historical Market Size Value (US$ Mn) & Volume (Units) Trend Analysis By Market Taxonomy, 2017-2021

    13.2. Market Size Value (US$ Mn) & Volume (Units) Forecast By Market Taxonomy, 2022-2032

        13.2.1. By Country

            13.2.1.1. GCC

            13.2.1.2. Rest of MEA

        13.2.2. By Ingredient Type

        13.2.3. By Sales Channel

        13.2.4. By Nature

    13.3. Market Attractiveness Analysis

        13.3.1. By Country

        13.3.2. By Ingredient Type

        13.3.3. By Sales Channel

        13.3.4. By Nature

    13.4. Key Takeaways

14. Key Countries Market Analysis

    14.1. U.S.

        14.1.1. Pricing Analysis

        14.1.2. Market Share Analysis, 2021

            14.1.2.1. By Ingredient Type

            14.1.2.2. By Sales Channel

            14.1.2.3. By Nature

    14.2. Canada

        14.2.1. Pricing Analysis

        14.2.2. Market Share Analysis, 2021

            14.2.2.1. By Ingredient Type

            14.2.2.2. By Sales Channel

            14.2.2.3. By Nature

    14.3. Brazil

        14.3.1. Pricing Analysis

        14.3.2. Market Share Analysis, 2021

            14.3.2.1. By Ingredient Type

            14.3.2.2. By Sales Channel

            14.3.2.3. By Nature

    14.4. Mexico

        14.4.1. Pricing Analysis

        14.4.2. Market Share Analysis, 2021

            14.4.2.1. By Ingredient Type

            14.4.2.2. By Sales Channel

            14.4.2.3. By Nature

    14.5. Argentina

        14.5.1. Pricing Analysis

        14.5.2. Market Share Analysis, 2021

            14.5.2.1. By Ingredient Type

            14.5.2.2. By Sales Channel

            14.5.2.3. By Nature

    14.6. Germany

        14.6.1. Pricing Analysis

        14.6.2. Market Share Analysis, 2021

            14.6.2.1. By Ingredient Type

            14.6.2.2. By Sales Channel

            14.6.2.3. By Nature

    14.7. Italy

        14.7.1. Pricing Analysis

        14.7.2. Market Share Analysis, 2021

            14.7.2.1. By Ingredient Type

            14.7.2.2. By Sales Channel

            14.7.2.3. By Nature

    14.8. France

        14.8.1. Pricing Analysis

        14.8.2. Market Share Analysis, 2021

            14.8.2.1. By Ingredient Type

            14.8.2.2. By Sales Channel

            14.8.2.3. By Nature

    14.9. U.K.

        14.9.1. Pricing Analysis

        14.9.2. Market Share Analysis, 2021

            14.9.2.1. By Ingredient Type

            14.9.2.2. By Sales Channel

            14.9.2.3. By Nature

    14.10. Spain

        14.10.1. Pricing Analysis

        14.10.2. Market Share Analysis, 2021

            14.10.2.1. By Ingredient Type

            14.10.2.2. By Sales Channel

            14.10.2.3. By Nature

    14.11. Russia

        14.11.1. Pricing Analysis

        14.11.2. Market Share Analysis, 2021

            14.11.2.1. By Ingredient Type

            14.11.2.2. By Sales Channel

            14.11.2.3. By Nature

    14.12. BENELUX

        14.12.1. Pricing Analysis

        14.12.2. Market Share Analysis, 2021

            14.12.2.1. By Ingredient Type

            14.12.2.2. By Sales Channel

            14.12.2.3. By Nature

    14.13. China

        14.13.1. Pricing Analysis

        14.13.2. Market Share Analysis, 2021

            14.13.2.1. By Ingredient Type

            14.13.2.2. By Sales Channel

            14.13.2.3. By Nature

    14.14. Japan

        14.14.1. Pricing Analysis

        14.14.2. Market Share Analysis, 2021

            14.14.2.1. By Ingredient Type

            14.14.2.2. By Sales Channel

            14.14.2.3. By Nature

    14.15. South Korea

        14.15.1. Pricing Analysis

        14.15.2. Market Share Analysis, 2021

            14.15.2.1. By Ingredient Type

            14.15.2.2. By Sales Channel

            14.15.2.3. By Nature

    14.16. India

        14.16.1. Pricing Analysis

        14.16.2. Market Share Analysis, 2021

            14.16.2.1. By Ingredient Type

            14.16.2.2. By Sales Channel

            14.16.2.3. By Nature

    14.17. GCC Countries

        14.17.1. Pricing Analysis

        14.17.2. Market Share Analysis, 2021

            14.17.2.1. By Ingredient Type

            14.17.2.2. By Sales Channel

            14.17.2.3. By Nature

15. Market Structure Analysis

    15.1. Competition Dashboard

    15.2. Competition Benchmarking

    15.3. Market Share Analysis of Top Players

        15.3.1. By Regional

        15.3.2. By Ingredient Type

        15.3.3. By Sales Channel

        15.3.4. By Nature

16. Competition Analysis

    16.1. Competition Deep Dive

        16.1.1. Mystic Moments

            16.1.1.1. Overview

            16.1.1.2. Product Portfolio

            16.1.1.3. Profitability by Market Segment

            16.1.1.4. Sales Footprint

            16.1.1.5. Strategy Overview

                16.1.1.5.1. Marketing Strategy

                16.1.1.5.2. Product Strategy

        16.1.2. Naturallythinking Pure Spa Aromatherapy

            16.1.2.1. Overview

            16.1.2.2. Product Portfolio

            16.1.2.3. Profitability by Market Segment

            16.1.2.4. Sales Footprint

            16.1.2.5. Strategy Overview

                16.1.2.5.1. Marketing Strategy

                16.1.2.5.2. Product Strategy

        16.1.3. Essential Wholesale & Labs

            16.1.3.1. Overview

            16.1.3.2. Product Portfolio

            16.1.3.3. Profitability by Market Segment

            16.1.3.4. Sales Footprint

            16.1.3.5. Strategy Overview

                16.1.3.5.1. Marketing Strategy

                16.1.3.5.2. Product Strategy

        16.1.4. Parchem fine & Specialty Chemicals

            16.1.4.1. Overview

            16.1.4.2. Product Portfolio

            16.1.4.3. Profitability by Market Segment

            16.1.4.4. Sales Footprint

            16.1.4.5. Strategy Overview

                16.1.4.5.1. Marketing Strategy

                16.1.4.5.2. Product Strategy

        16.1.5. Ingredients To Die For

            16.1.5.1. Overview

            16.1.5.2. Product Portfolio

            16.1.5.3. Profitability by Market Segment

            16.1.5.4. Sales Footprint

            16.1.5.5. Strategy Overview

                16.1.5.5.1. Marketing Strategy

                16.1.5.5.2. Product Strategy

        16.1.6. Aroma Alternatives Co. Ltd.

            16.1.6.1. Overview

            16.1.6.2. Product Portfolio

            16.1.6.3. Profitability by Market Segment

            16.1.6.4. Sales Footprint

            16.1.6.5. Strategy Overview

                16.1.6.5.1. Marketing Strategy

                16.1.6.5.2. Product Strategy

        16.1.7. Pharmacos

            16.1.7.1. Overview

            16.1.7.2. Product Portfolio

            16.1.7.3. Profitability by Market Segment

            16.1.7.4. Sales Footprint

            16.1.7.5. Strategy Overview

                16.1.7.5.1. Marketing Strategy

                16.1.7.5.2. Product Strategy

        16.1.8. Composition Materials Co., Inc.

            16.1.8.1. Overview

            16.1.8.2. Product Portfolio

            16.1.8.3. Profitability by Market Segment

            16.1.8.4. Sales Footprint

            16.1.8.5. Strategy Overview

                16.1.8.5.1. Marketing Strategy

                16.1.8.5.2. Product Strategy

        16.1.9. N-ESSENTIALS

            16.1.9.1. Overview

            16.1.9.2. Product Portfolio

            16.1.9.3. Profitability by Market Segment

            16.1.9.4. Sales Footprint

            16.1.9.5. Strategy Overview

                16.1.9.5.1. Marketing Strategy

                16.1.9.5.2. Product Strategy

        16.1.10. Fa. Rosarome

            16.1.10.1. Overview

            16.1.10.2. Product Portfolio

            16.1.10.3. Profitability by Market Segment

            16.1.10.4. Sales Footprint

            16.1.10.5. Strategy Overview

                16.1.10.5.1. Marketing Strategy

                16.1.10.5.2. Product Strategy

        16.1.11. Glamour Cosmetics

            16.1.11.1. Overview

            16.1.11.2. Product Portfolio

            16.1.11.3. Profitability by Market Segment

            16.1.11.4. Sales Footprint

            16.1.11.5. Strategy Overview

                16.1.11.5.1. Marketing Strategy

                16.1.11.5.2. Product Strategy

        16.1.12. Alexmo Cosmetics

            16.1.12.1. Overview

            16.1.12.2. Product Portfolio

            16.1.12.3. Profitability by Market Segment

            16.1.12.4. Sales Footprint

            16.1.12.5. Strategy Overview

                16.1.12.5.1. Marketing Strategy

                16.1.12.5.2. Product Strategy

        16.1.13. Gracefruit Limited

            16.1.13.1. Overview

            16.1.13.2. Product Portfolio

            16.1.13.3. Profitability by Market Segment

            16.1.13.4. Sales Footprint

            16.1.13.5. Strategy Overview

                16.1.13.5.1. Marketing Strategy

                16.1.13.5.2. Product Strategy

        16.1.14. VOYAGEUR SOAP & CO.

            16.1.14.1. Overview

            16.1.14.2. Product Portfolio

            16.1.14.3. Profitability by Market Segment

            16.1.14.4. Sales Footprint

            16.1.14.5. Strategy Overview

                16.1.14.5.1. Marketing Strategy

                16.1.14.5.2. Product Strategy

        16.1.15. Les Âmes Fleurs Inc.

            16.1.15.1. Overview

            16.1.15.2. Product Portfolio

            16.1.15.3. Profitability by Market Segment

            16.1.15.4. Sales Footprint

            16.1.15.5. Strategy Overview

                16.1.15.5.1. Marketing Strategy

                16.1.15.5.2. Product Strategy

17. Assumptions & Acronyms Used

18. Research Methodology

Don't pay for what you don't need

Customize your report by selecting specific countries or regions and save 30%!

List of Tables

Table 1: Global Market Value (US$ Mn) Forecast by Region, 2017-2032

Table 2: Global Market Volume (Units) Forecast by Region, 2017-2032

Table 3: Global Market Value (US$ Mn) Forecast by Ingredient Type, 2017-2032

Table 4: Global Market Volume (Units) Forecast by Ingredient Type, 2017-2032

Table 5: Global Market Value (US$ Mn) Forecast by Sales Channel, 2017-2032

Table 6: Global Market Volume (Units) Forecast by Sales Channel, 2017-2032

Table 7: Global Market Value (US$ Mn) Forecast by Nature, 2017-2032

Table 8: Global Market Volume (Units) Forecast by Nature, 2017-2032

Table 9: North America Market Value (US$ Mn) Forecast by Country, 2017-2032

Table 10: North America Market Volume (Units) Forecast by Country, 2017-2032

Table 11: North America Market Value (US$ Mn) Forecast by Ingredient Type, 2017-2032

Table 12: North America Market Volume (Units) Forecast by Ingredient Type, 2017-2032

Table 13: North America Market Value (US$ Mn) Forecast by Sales Channel, 2017-2032

Table 14: North America Market Volume (Units) Forecast by Sales Channel, 2017-2032

Table 15: North America Market Value (US$ Mn) Forecast by Nature, 2017-2032

Table 16: North America Market Volume (Units) Forecast by Nature, 2017-2032

Table 17: Latin America Market Value (US$ Mn) Forecast by Country, 2017-2032

Table 18: Latin America Market Volume (Units) Forecast by Country, 2017-2032

Table 19: Latin America Market Value (US$ Mn) Forecast by Ingredient Type, 2017-2032

Table 20: Latin America Market Volume (Units) Forecast by Ingredient Type, 2017-2032

Table 21: Latin America Market Value (US$ Mn) Forecast by Sales Channel, 2017-2032

Table 22: Latin America Market Volume (Units) Forecast by Sales Channel, 2017-2032

Table 23: Latin America Market Value (US$ Mn) Forecast by Nature, 2017-2032

Table 24: Latin America Market Volume (Units) Forecast by Nature, 2017-2032

Table 25: Europe Market Value (US$ Mn) Forecast by Country, 2017-2032

Table 26: Europe Market Volume (Units) Forecast by Country, 2017-2032

Table 27: Europe Market Value (US$ Mn) Forecast by Ingredient Type, 2017-2032

Table 28: Europe Market Volume (Units) Forecast by Ingredient Type, 2017-2032

Table 29: Europe Market Value (US$ Mn) Forecast by Sales Channel, 2017-2032

Table 30: Europe Market Volume (Units) Forecast by Sales Channel, 2017-2032

Table 31: Europe Market Value (US$ Mn) Forecast by Nature, 2017-2032

Table 32: Europe Market Volume (Units) Forecast by Nature, 2017-2032

Table 33: Asia Pacific Market Value (US$ Mn) Forecast by Country, 2017-2032

Table 34: Asia Pacific Market Volume (Units) Forecast by Country, 2017-2032

Table 35: Asia Pacific Market Value (US$ Mn) Forecast by Ingredient Type, 2017-2032

Table 36: Asia Pacific Market Volume (Units) Forecast by Ingredient Type, 2017-2032

Table 37: Asia Pacific Market Value (US$ Mn) Forecast by Sales Channel, 2017-2032

Table 38: Asia Pacific Market Volume (Units) Forecast by Sales Channel, 2017-2032

Table 39: Asia Pacific Market Value (US$ Mn) Forecast by Nature, 2017-2032

Table 40: Asia Pacific Market Volume (Units) Forecast by Nature, 2017-2032

Table 41: MEA Market Value (US$ Mn) Forecast by Country, 2017-2032

Table 42: MEA Market Volume (Units) Forecast by Country, 2017-2032

Table 43: MEA Market Value (US$ Mn) Forecast by Ingredient Type, 2017-2032

Table 44: MEA Market Volume (Units) Forecast by Ingredient Type, 2017-2032

Table 45: MEA Market Value (US$ Mn) Forecast by Sales Channel, 2017-2032

Table 46: MEA Market Volume (Units) Forecast by Sales Channel, 2017-2032

Table 47: MEA Market Value (US$ Mn) Forecast by Nature, 2017-2032

Table 48: MEA Market Volume (Units) Forecast by Nature, 2017-2032
Sneha Verghese
Sneha Verghese

Principal Consultant

Talk to Analyst

Find your sweet spots for generating winning opportunities in this market.

List of Charts

Figure 1: Global Market Value (US$ Mn) by Ingredient Type, 2022-2032

Figure 2: Global Market Value (US$ Mn) by Sales Channel, 2022-2032

Figure 3: Global Market Value (US$ Mn) by Nature, 2022-2032

Figure 4: Global Market Value (US$ Mn) by Region, 2022-2032

Figure 5: Global Market Value (US$ Mn) Analysis by Region, 2017-2032

Figure 6: Global Market Volume (Units) Analysis by Region, 2017-2032

Figure 7: Global Market Value Share (%) and BPS Analysis by Region, 2022-2032

Figure 8: Global Market Y-o-Y Growth (%) Projections by Region, 2022-2032

Figure 9: Global Market Value (US$ Mn) Analysis by Ingredient Type, 2017-2032

Figure 10: Global Market Volume (Units) Analysis by Ingredient Type, 2017-2032

Figure 11: Global Market Value Share (%) and BPS Analysis by Ingredient Type, 2022-2032

Figure 12: Global Market Y-o-Y Growth (%) Projections by Ingredient Type, 2022-2032

Figure 13: Global Market Value (US$ Mn) Analysis by Sales Channel, 2017-2032

Figure 14: Global Market Volume (Units) Analysis by Sales Channel, 2017-2032

Figure 15: Global Market Value Share (%) and BPS Analysis by Sales Channel, 2022-2032

Figure 16: Global Market Y-o-Y Growth (%) Projections by Sales Channel, 2022-2032

Figure 17: Global Market Value (US$ Mn) Analysis by Nature, 2017-2032

Figure 18: Global Market Volume (Units) Analysis by Nature, 2017-2032

Figure 19: Global Market Value Share (%) and BPS Analysis by Nature, 2022-2032

Figure 20: Global Market Y-o-Y Growth (%) Projections by Nature, 2022-2032

Figure 21: Global Market Attractiveness by Ingredient Type, 2022-2032

Figure 22: Global Market Attractiveness by Sales Channel, 2022-2032

Figure 23: Global Market Attractiveness by Nature, 2022-2032

Figure 24: Global Market Attractiveness by Region, 2022-2032

Figure 25: North America Market Value (US$ Mn) by Ingredient Type, 2022-2032

Figure 26: North America Market Value (US$ Mn) by Sales Channel, 2022-2032

Figure 27: North America Market Value (US$ Mn) by Nature, 2022-2032

Figure 28: North America Market Value (US$ Mn) by Country, 2022-2032

Figure 29: North America Market Value (US$ Mn) Analysis by Country, 2017-2032

Figure 30: North America Market Volume (Units) Analysis by Country, 2017-2032

Figure 31: North America Market Value Share (%) and BPS Analysis by Country, 2022-2032

Figure 32: North America Market Y-o-Y Growth (%) Projections by Country, 2022-2032

Figure 33: North America Market Value (US$ Mn) Analysis by Ingredient Type, 2017-2032

Figure 34: North America Market Volume (Units) Analysis by Ingredient Type, 2017-2032

Figure 35: North America Market Value Share (%) and BPS Analysis by Ingredient Type, 2022-2032

Figure 36: North America Market Y-o-Y Growth (%) Projections by Ingredient Type, 2022-2032

Figure 37: North America Market Value (US$ Mn) Analysis by Sales Channel, 2017-2032

Figure 38: North America Market Volume (Units) Analysis by Sales Channel, 2017-2032

Figure 39: North America Market Value Share (%) and BPS Analysis by Sales Channel, 2022-2032

Figure 40: North America Market Y-o-Y Growth (%) Projections by Sales Channel, 2022-2032

Figure 41: North America Market Value (US$ Mn) Analysis by Nature, 2017-2032

Figure 42: North America Market Volume (Units) Analysis by Nature, 2017-2032

Figure 43: North America Market Value Share (%) and BPS Analysis by Nature, 2022-2032

Figure 44: North America Market Y-o-Y Growth (%) Projections by Nature, 2022-2032

Figure 45: North America Market Attractiveness by Ingredient Type, 2022-2032

Figure 46: North America Market Attractiveness by Sales Channel, 2022-2032

Figure 47: North America Market Attractiveness by Nature, 2022-2032

Figure 48: North America Market Attractiveness by Country, 2022-2032

Figure 49: Latin America Market Value (US$ Mn) by Ingredient Type, 2022-2032

Figure 50: Latin America Market Value (US$ Mn) by Sales Channel, 2022-2032

Figure 51: Latin America Market Value (US$ Mn) by Nature, 2022-2032

Figure 52: Latin America Market Value (US$ Mn) by Country, 2022-2032

Figure 53: Latin America Market Value (US$ Mn) Analysis by Country, 2017-2032

Figure 54: Latin America Market Volume (Units) Analysis by Country, 2017-2032

Figure 55: Latin America Market Value Share (%) and BPS Analysis by Country, 2022-2032

Figure 56: Latin America Market Y-o-Y Growth (%) Projections by Country, 2022-2032

Figure 57: Latin America Market Value (US$ Mn) Analysis by Ingredient Type, 2017-2032

Figure 58: Latin America Market Volume (Units) Analysis by Ingredient Type, 2017-2032

Figure 59: Latin America Market Value Share (%) and BPS Analysis by Ingredient Type, 2022-2032

Figure 60: Latin America Market Y-o-Y Growth (%) Projections by Ingredient Type, 2022-2032

Figure 61: Latin America Market Value (US$ Mn) Analysis by Sales Channel, 2017-2032

Figure 62: Latin America Market Volume (Units) Analysis by Sales Channel, 2017-2032

Figure 63: Latin America Market Value Share (%) and BPS Analysis by Sales Channel, 2022-2032

Figure 64: Latin America Market Y-o-Y Growth (%) Projections by Sales Channel, 2022-2032

Figure 65: Latin America Market Value (US$ Mn) Analysis by Nature, 2017-2032

Figure 66: Latin America Market Volume (Units) Analysis by Nature, 2017-2032

Figure 67: Latin America Market Value Share (%) and BPS Analysis by Nature, 2022-2032

Figure 68: Latin America Market Y-o-Y Growth (%) Projections by Nature, 2022-2032

Figure 69: Latin America Market Attractiveness by Ingredient Type, 2022-2032

Figure 70: Latin America Market Attractiveness by Sales Channel, 2022-2032

Figure 71: Latin America Market Attractiveness by Nature, 2022-2032

Figure 72: Latin America Market Attractiveness by Country, 2022-2032

Figure 73: Europe Market Value (US$ Mn) by Ingredient Type, 2022-2032

Figure 74: Europe Market Value (US$ Mn) by Sales Channel, 2022-2032

Figure 75: Europe Market Value (US$ Mn) by Nature, 2022-2032

Figure 76: Europe Market Value (US$ Mn) by Country, 2022-2032

Figure 77: Europe Market Value (US$ Mn) Analysis by Country, 2017-2032

Figure 78: Europe Market Volume (Units) Analysis by Country, 2017-2032

Figure 79: Europe Market Value Share (%) and BPS Analysis by Country, 2022-2032

Figure 80: Europe Market Y-o-Y Growth (%) Projections by Country, 2022-2032

Figure 81: Europe Market Value (US$ Mn) Analysis by Ingredient Type, 2017-2032

Figure 82: Europe Market Volume (Units) Analysis by Ingredient Type, 2017-2032

Figure 83: Europe Market Value Share (%) and BPS Analysis by Ingredient Type, 2022-2032

Figure 84: Europe Market Y-o-Y Growth (%) Projections by Ingredient Type, 2022-2032

Figure 85: Europe Market Value (US$ Mn) Analysis by Sales Channel, 2017-2032

Figure 86: Europe Market Volume (Units) Analysis by Sales Channel, 2017-2032

Figure 87: Europe Market Value Share (%) and BPS Analysis by Sales Channel, 2022-2032

Figure 88: Europe Market Y-o-Y Growth (%) Projections by Sales Channel, 2022-2032

Figure 89: Europe Market Value (US$ Mn) Analysis by Nature, 2017-2032

Figure 90: Europe Market Volume (Units) Analysis by Nature, 2017-2032

Figure 91: Europe Market Value Share (%) and BPS Analysis by Nature, 2022-2032

Figure 92: Europe Market Y-o-Y Growth (%) Projections by Nature, 2022-2032

Figure 93: Europe Market Attractiveness by Ingredient Type, 2022-2032

Figure 94: Europe Market Attractiveness by Sales Channel, 2022-2032

Figure 95: Europe Market Attractiveness by Nature, 2022-2032

Figure 96: Europe Market Attractiveness by Country, 2022-2032

Figure 97: Asia Pacific Market Value (US$ Mn) by Ingredient Type, 2022-2032

Figure 98: Asia Pacific Market Value (US$ Mn) by Sales Channel, 2022-2032

Figure 99: Asia Pacific Market Value (US$ Mn) by Nature, 2022-2032

Figure 100: Asia Pacific Market Value (US$ Mn) by Country, 2022-2032

Figure 101: Asia Pacific Market Value (US$ Mn) Analysis by Country, 2017-2032

Figure 102: Asia Pacific Market Volume (Units) Analysis by Country, 2017-2032

Figure 103: Asia Pacific Market Value Share (%) and BPS Analysis by Country, 2022-2032

Figure 104: Asia Pacific Market Y-o-Y Growth (%) Projections by Country, 2022-2032

Figure 105: Asia Pacific Market Value (US$ Mn) Analysis by Ingredient Type, 2017-2032

Figure 106: Asia Pacific Market Volume (Units) Analysis by Ingredient Type, 2017-2032

Figure 107: Asia Pacific Market Value Share (%) and BPS Analysis by Ingredient Type, 2022-2032

Figure 108: Asia Pacific Market Y-o-Y Growth (%) Projections by Ingredient Type, 2022-2032

Figure 109: Asia Pacific Market Value (US$ Mn) Analysis by Sales Channel, 2017-2032

Figure 110: Asia Pacific Market Volume (Units) Analysis by Sales Channel, 2017-2032

Figure 111: Asia Pacific Market Value Share (%) and BPS Analysis by Sales Channel, 2022-2032

Figure 112: Asia Pacific Market Y-o-Y Growth (%) Projections by Sales Channel, 2022-2032

Figure 113: Asia Pacific Market Value (US$ Mn) Analysis by Nature, 2017-2032

Figure 114: Asia Pacific Market Volume (Units) Analysis by Nature, 2017-2032

Figure 115: Asia Pacific Market Value Share (%) and BPS Analysis by Nature, 2022-2032

Figure 116: Asia Pacific Market Y-o-Y Growth (%) Projections by Nature, 2022-2032

Figure 117: Asia Pacific Market Attractiveness by Ingredient Type, 2022-2032

Figure 118: Asia Pacific Market Attractiveness by Sales Channel, 2022-2032

Figure 119: Asia Pacific Market Attractiveness by Nature, 2022-2032

Figure 120: Asia Pacific Market Attractiveness by Country, 2022-2032

Figure 121: MEA Market Value (US$ Mn) by Ingredient Type, 2022-2032

Figure 122: MEA Market Value (US$ Mn) by Sales Channel, 2022-2032

Figure 123: MEA Market Value (US$ Mn) by Nature, 2022-2032

Figure 124: MEA Market Value (US$ Mn) by Country, 2022-2032

Figure 125: MEA Market Value (US$ Mn) Analysis by Country, 2017-2032

Figure 126: MEA Market Volume (Units) Analysis by Country, 2017-2032

Figure 127: MEA Market Value Share (%) and BPS Analysis by Country, 2022-2032

Figure 128: MEA Market Y-o-Y Growth (%) Projections by Country, 2022-2032

Figure 129: MEA Market Value (US$ Mn) Analysis by Ingredient Type, 2017-2032

Figure 130: MEA Market Volume (Units) Analysis by Ingredient Type, 2017-2032

Figure 131: MEA Market Value Share (%) and BPS Analysis by Ingredient Type, 2022-2032

Figure 132: MEA Market Y-o-Y Growth (%) Projections by Ingredient Type, 2022-2032

Figure 133: MEA Market Value (US$ Mn) Analysis by Sales Channel, 2017-2032

Figure 134: MEA Market Volume (Units) Analysis by Sales Channel, 2017-2032

Figure 135: MEA Market Value Share (%) and BPS Analysis by Sales Channel, 2022-2032

Figure 136: MEA Market Y-o-Y Growth (%) Projections by Sales Channel, 2022-2032

Figure 137: MEA Market Value (US$ Mn) Analysis by Nature, 2017-2032

Figure 138: MEA Market Volume (Units) Analysis by Nature, 2017-2032

Figure 139: MEA Market Value Share (%) and BPS Analysis by Nature, 2022-2032

Figure 140: MEA Market Y-o-Y Growth (%) Projections by Nature, 2022-2032

Figure 141: MEA Market Attractiveness by Ingredient Type, 2022-2032

Figure 142: MEA Market Attractiveness by Sales Channel, 2022-2032

Figure 143: MEA Market Attractiveness by Nature, 2022-2032

Figure 144: MEA Market Attractiveness by Country, 2022-2032

Recommendations

Consumer Product

Hair Texturizer Product Market

Published : November 2023

Consumer Product

Hair Extension Market

Published : October 2023

Consumer Product

DIY Haircut Kits Market

Published : August 2023

Consumer Product

Hair Gloss Market

Published : January 2023

Explore Consumer Product Insights

View Reports

Hair Serums Ingredient Market