Hair Thinning Solutions Market Size and Share Forecast Outlook 2025 to 2035

The Hair Thinning Solutions Market is projected at USD 6,201.2 million in 2025 and is forecast to achieve USD 14,002.1 million by 2035. An increase of USD 7,800.9 million over the decade represents a 2.3X growth, equal to a CAGR of 8.5%. Expansion is expected to be supported by rising awareness of hair thinning concerns, greater ingredient transparency, and growing digital channel penetration.
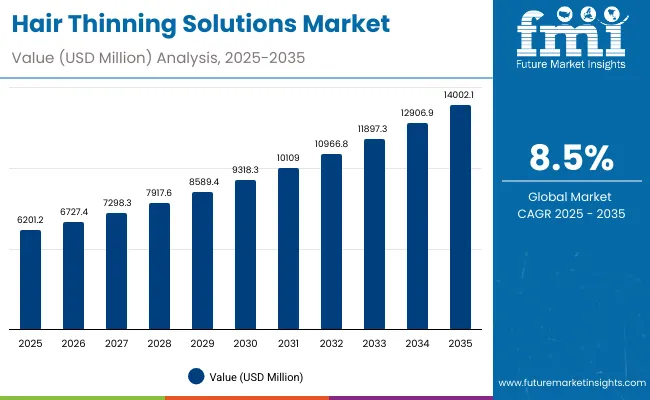
Quick Stats for Hair Thinning Solutions Market

  • Hair Thinning Solutions Market Value (2025): USD 6,201.2 million
  • Hair Thinning Solutions Market Forecast Value (2035): USD 14,002.1 million
  • Hair Thinning Solutions Market Forecast CAGR: 8.5%
  • Leading Segment in Hair Thinning Solutions Market in 2025: Keratin-based solutions (48.0%)
  • Key Growth Regions in Hair Thinning Solutions Market: China, India, Japan
  • Top Key Players in Hair Thinning Solutions Market: Nioxin, Pantene (P&G), Kerastase (L’Oréal), OGX, Viviscal, Nutrafol, DS Laboratories, Kéranique, Marc Anthony, Biolage

Hair Thinning Solutions Market

Hair Thinning Solutions Market Key Takeaways

Metric Value
Hair Thinning Solutions Market Estimated Value in (2025E) USD 6,201.2 million
Hair Thinning Solutions Market Forecast Value in (2035F) USD 14,002.1 million
Forecast CAGR (2025 to 2035) 8.50%

Between 2025 and 2030, the market is estimated to expand from USD 6,201.2 million to USD 9,318.3 million, adding USD 3,117.1 million. This period is projected to account for about 40 percent of the total incremental growth, reflecting strong adoption of advanced formulations featuring keratin and biotin, together with early adoption of subscription-based regimens in mature economies.

The second half of the forecast horizon from 2030 to 2035 is anticipated to contribute USD 4,683.8 million, equaling almost 60 percent of total expansion. Market size is expected to increase from USD 9,318.3 million to USD 14,002.1 million during this phase. Growth will be shaped by wider acceptance of e-commerce, integration of digital diagnostics for personalized solutions, and consumer preference for clinically proven outcomes. Keratin-driven formulations are likely to dominate active ingredient positioning, while volume enhancement remains a key function area. Strong momentum is projected to emerge in Asia, where China and India are forecast to outpace global averages and reinforce the long-term growth trajectory of the sector.

From 2020 to 2024, steady momentum was observed as consumers increasingly adopted ingredient-driven solutions, supported by rising awareness and expanding product accessibility through both online and offline channels. By 2025, demand is anticipated to accelerate to USD 6,201.2 million, underpinned by strong uptake of volume enhancement and keratin-enriched products. Competitive dynamics are projected to remain fragmented, with niche innovators and premium brands competing alongside mass retail players.

Growth through 2035, reaching USD 14,002.1 million, is expected to be fueled by digital commerce penetration, subscription-led replenishment, and expansion into Asia, where China and India are anticipated to lead global growth rates. Traditional leaders are expected to be challenged by new entrants offering science-backed claims and tailored regimens, shifting the basis of competition toward clinical validation, ecosystem strength, and consumer loyalty.

Why the Hair Thinning Solutions Market is growing?

Growth in the Hair Thinning Solutions Market is being propelled by rising consumer awareness of hair density concerns, reinforced by greater exposure to dermatologist-led education and social media advocacy. Demand is being supported by advances in ingredient formulations, where keratin, biotin, and caffeine-based blends are being positioned with clinical validation to deliver measurable outcomes. Expansion of e-commerce platforms has provided seamless access and improved replenishment cycles, accelerating adoption across both mature and emerging economies.

Subscription-based models are being leveraged to enhance long-term regimen adherence, while digital diagnostics and AI-enabled scalp analysis are expected to increase personalization and improve efficacy perceptions. Aging demographics and lifestyle-driven hair loss incidence are further contributing to demand momentum. As consumers seek transparency and proof of results, companies with evidence-backed claims and holistic solutions that combine volume enhancement, strand strengthening, and scalp nutrition are anticipated to capture stronger brand loyalty and accelerate global market penetration.

Segmental Analysis

The Hair Thinning Solutions Market has been segmented across multiple dimensions to capture the diverse factors shaping demand and adoption. Key segmentation areas include product type, function, and active ingredients, each offering a distinct view of consumer priorities and industry strategies. By analyzing these segments, the structural growth drivers of the market can be better understood.

Product type segmentation highlights consumer inclination toward accessible and daily-use formulations, while functional categorization reveals the performance outcomes most valued by buyers. Active ingredient segmentation emphasizes the scientific basis of efficacy claims, which play a central role in consumer trust. Together, these segments provide clarity on the pathways through which innovation, marketing, and consumption trends are expected to influence market expansion.
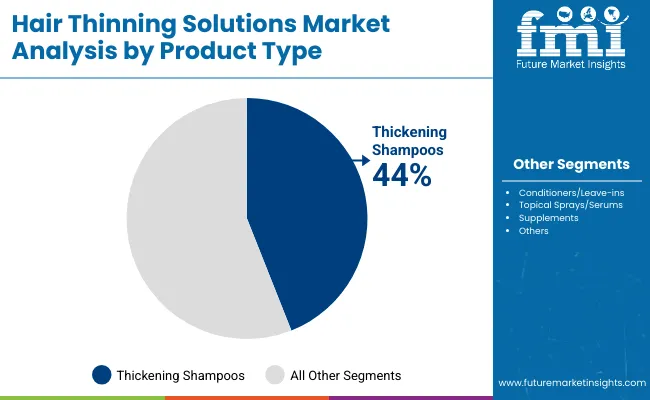
Insights into the Product Type Segment with Thickening Shampoos Leading in Market Share

Hair Thinning Solutions Market By Product

Product Type Market Value Share, 2025
Thickening shampoos 44%
Others 56.0%

The product type segment is expected to be led by thickening shampoos, which accounted for 44% of the market in 2025 with sales of USD 2728.53 million. Growth in this segment is anticipated to be supported by consumer preference for convenient, daily-use solutions that deliver visible improvements in hair density. The rising influence of dermatologist endorsements and digital marketing campaigns is projected to further enhance product trust and repeat purchase rates. Although other product formats collectively hold a higher share at 56%, thickening shampoos are likely to remain the entry point for many first-time consumers. This positioning ensures sustained dominance, as consistent usage patterns strengthen brand loyalty and reinforce their role as the foundation of hair thinning solutions.
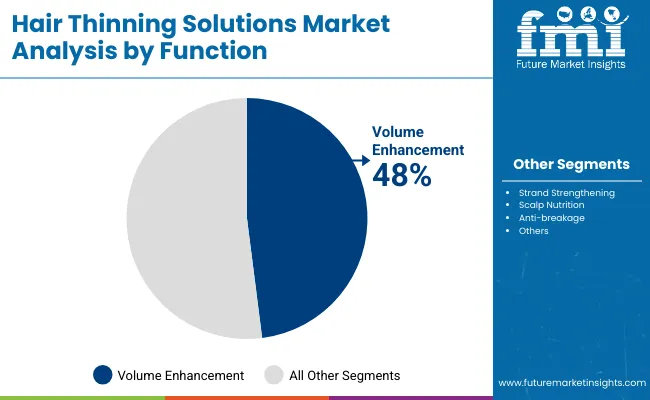
Insights into the Function Segment with Volume Enhancement Dominating Demand

Hair Thinning Solutions Market By Function

Function Market Value Share, 2025
Volume enhancement 48%
Others 52.0%

The function segment is projected to be driven by demand for volume enhancement, which held a 48% share in 2025, equivalent to USD 2976.58 million. Preference for fuller hair profiles and visible thickness has been reinforced by consumer awareness of self-image and social influence, making this function the most recognized category. As marketing narratives shift toward instant but lasting results, volume enhancement solutions are being positioned as essential components of personal care regimens. The segment’s outlook is further strengthened by innovation in product claims that balance efficacy with safety. While other functions collectively dominate with 52% share, volume enhancement is expected to maintain leadership through its universal appeal and consistent ability to address the most visible symptoms of thinning.
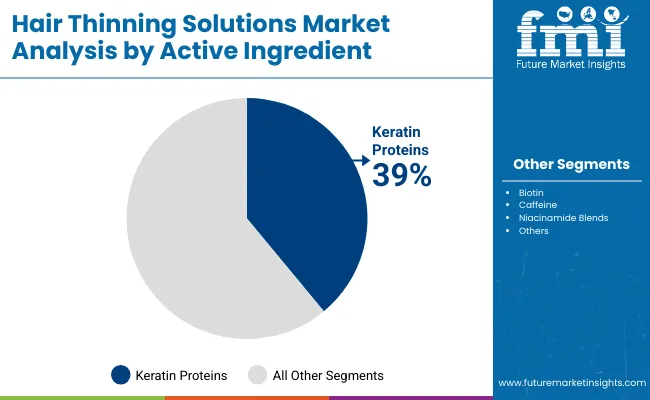
Insights into the Active Ingredient Segment with Keratin Proteins Remaining Prominent

Hair Thinning Solutions Market By Active Ingrediant

Active Ingredient Market Value Share, 2025
Keratin proteins 39%
Others 61.0%

The active ingredient segment is expected to remain anchored by keratin proteins, which accounted for 39% of the market in 2025 with USD 2418.47 million in sales. Keratin-based formulations have been positioned as credible due to their proven role in hair strengthening and density improvement, reinforcing their preference among consumers and professionals. Growing emphasis on clinically validated outcomes and visible repair benefits is expected to support their continued relevance. Although other active ingredients collectively represented 61% of the market, keratin proteins are anticipated to retain dominance as the foundation of premium and mid-range solutions. Sustained consumer trust and compatibility with multi-functional regimens are likely to reinforce keratin’s prominence in the hair thinning solutions category.

What are the Drivers, Restraints, and Key Trends of the Hair Thinning Solutions Market?

The Hair Thinning Solutions Market is being reshaped by scientific validation, consumer behavior shifts, and digital distribution models, even as regulatory scrutiny and competitive fragmentation intensify, making strategic alignment essential for sustaining long-term growth and category leadership.

Clinical Validation and Evidence-Led Adoption

Market expansion is being accelerated by the increasing emphasis on evidence-backed product claims, as clinical validation is now demanded by both regulators and consumers. Formulations featuring keratin, biotin, and caffeine are being subjected to measurable outcome studies, establishing credibility that fosters consumer trust and professional endorsement. This shift is anticipated to redefine brand hierarchies, as companies with strong trial data and dermatology-led credibility secure premium positioning. As ingredient transparency becomes standardized, the competitive advantage will lie in real-world efficacy metrics, reinforcing long-term adoption and market penetration.

Digital Diagnostics and Personalized Regimens

A major trend shaping the industry is the integration of digital diagnostics, where AI-enabled scalp analysis and strand imaging tools are being embedded into purchase journeys. These diagnostics allow for personalized regimens, improving treatment adherence and lifetime customer value. This evolution is projected to blur the lines between product manufacturers and digital health platforms, as consumers increasingly expect holistic solutions that combine analysis, recommendation, and replenishment. The move toward personalization is not only expected to enhance efficacy perceptions but also to lock consumers into long-term subscription models, creating predictable revenue streams.
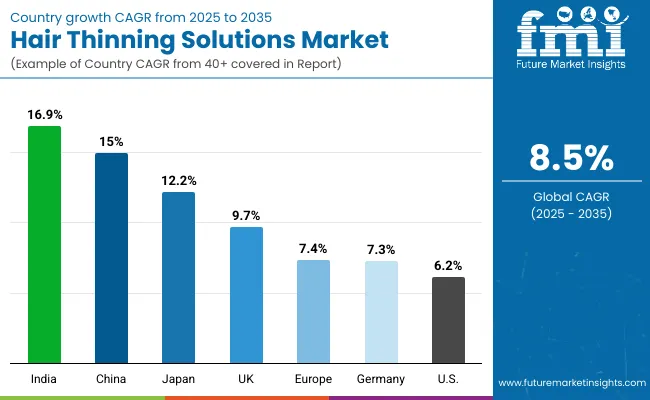
Analysis of Hair Thinning Solutions Market By Key Countries

Hair Thinning Solutions Market By Country

Countries CAGR
China 15.0%
USA 6.2%
India 16.9%
UK 9.7%
Germany 7.3%
Japan 12.2%

The Hair Thinning Solutions Market is projected to demonstrate distinct growth trajectories across major economies, shaped by demographic pressures, digital adoption, and healthcare engagement levels. Asia is anticipated to emerge as the most dynamic growth hub, with India recording the highest CAGR of 16.9 percent and China following at 15.0 percent. Expansion in these markets is expected to be underpinned by rising middle-class incomes, increased willingness to invest in personal care, and rapid scaling of e-commerce ecosystems that enhance accessibility.

Japan, with a CAGR of 12.2 percent, is anticipated to achieve strong traction through premium-led demand, supported by consumers who prioritize efficacy and innovation in routine care. The UK, projected at 9.7 percent, is likely to maintain steady adoption, aided by lifestyle shifts and broad acceptance of dermatologist-endorsed regimens. Germany, at 7.3 percent, is expected to rely on pharmacy-driven trust and high compliance with safety and quality standards. In contrast, the USA is forecast to expand at a relatively moderate CAGR of 6.2 percent, reflecting maturity in adoption patterns but still benefiting from growing acceptance among men and aging consumers. Overall, geographic diversification of growth is projected to define the next decade for the market.
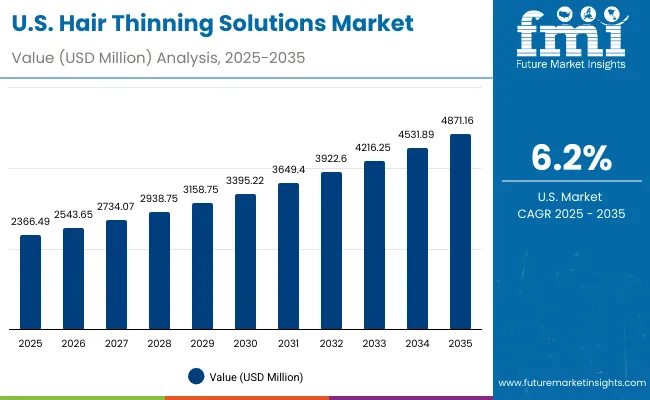
Sales Outlook for Hair Thinning Solutions in the United States

Hair Thinning Solutions Market Usa

Year USA Hair Thinning Solutions Market (USD Million)
2025 2366.49
2026 2543.65
2027 2734.07
2028 2938.75
2029 3158.75
2030 3395.22
2031 3649.40
2032 3922.60
2033 4216.25
2034 4531.89
2035 4871.16

The Hair Thinning Solutions Market in the United States is projected to grow at a CAGR of 6.2 percent between 2025 and 2035. This trajectory represents a near doubling of value across the decade, supported by consistent demand among women, increasing acceptance among men, and strong adoption within aging demographics. Steady year-on-year growth reflects the integration of keratin-based regimens and the expansion of volume enhancement solutions that align with consumer expectations of visible results. E-commerce penetration is anticipated to accelerate market access, while professional salons and pharmacies are projected to remain pivotal for discovery and credibility.

  • Keratin proteins are expected to anchor ingredient positioning, reflecting strong trust in strengthening efficacy.
  • Volume enhancement will remain a core functional driver, capturing attention through visible outcomes.
  • Digital retail and subscription-led replenishment are projected to expand access and retention.
  • Aging consumers are anticipated to shape demand, reinforcing solutions tailored to long-term thinning management.

Growth and Expansion Outlook for Hair Thinning Solutions Market in the United Kingdom

The Hair Thinning Solutions Market in the United Kingdom is projected to expand at a CAGR of 9.7 percent from 2025 to 2035. Growth is expected to be reinforced by lifestyle-driven adoption, strong visibility of hair health in media, and broad access through professional salons and pharmacies. Expansion of dermatologist-endorsed solutions is anticipated to create premium demand, while online subscription models are projected to increase retention rates. Rising awareness among male consumers and younger demographics is likely to broaden adoption beyond traditional segments.

  • Dermatologist-led credibility is expected to drive preference for premium formulations.
  • Subscription services are projected to lock in recurring sales across urban centers.
  • Expanding male grooming culture is likely to strengthen uptake in younger demographics.
  • Retail pharmacies and salons are anticipated to remain trusted distribution channels.

Growth and Expansion Outlook for Hair Thinning Solutions Market in India

The Hair Thinning Solutions Market in India is forecast to grow at a CAGR of 16.9 percent through 2035, positioning it as the fastest-growing market globally. Expansion is expected to be driven by rapid digital adoption, rising disposable incomes, and cultural acceptance of grooming across genders. Increasing penetration of e-commerce marketplaces and quick-commerce platforms is projected to transform accessibility, while urban middle-class consumers are anticipated to favor premium, clinically validated products. Adoption is also expected to rise in tier-two cities, supported by influencer-driven marketing and affordable regimen bundling.

  • Digital marketplaces and quick-commerce are projected to scale access beyond metros.
  • Premium positioning is anticipated to be reinforced by clinical claim validation.
  • Tier-two city demand is expected to rise through influencer-led awareness.
  • Grooming normalization among men is projected to expand the addressable base.

Sales Outlook for Hair Thinning Solutions in China

The Hair Thinning Solutions Market in China is anticipated to register a CAGR of 15.0 percent between 2025 and 2035. Expansion is expected to be shaped by strong e-commerce infrastructure, aggressive adoption of personalized regimens, and growing emphasis on clinical validation. Partnerships with dermatology clinics and digital health platforms are projected to increase credibility and accelerate long-term adherence. Demand is also anticipated to rise across younger demographics, where self-care and appearance are becoming critical lifestyle priorities.
  • Leading e-commerce ecosystems are expected to dominate discovery and replenishment.
  • Clinical collaborations are anticipated to improve regimen credibility.
  • Younger consumers are projected to drive adoption through digital-first behaviors.
  • Personalization and subscription-led services are likely to boost lifetime value.

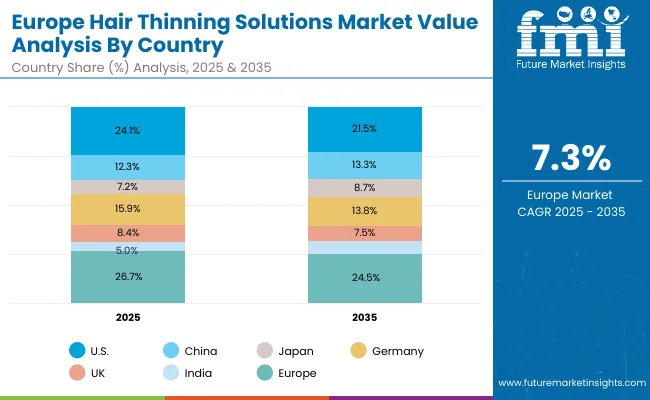
In-depth Analysis of Hair Thinning Solutions in Germany

Hair Thinning Solutions Market Europe

Countries 2025
USA 24.1%
China 12.3%
Japan 7.2%
Germany 15.9%
UK 8.4%
India 5.0%
Countries 2035
USA 21.5%
China 13.3%
Japan 8.7%
Germany 13.8%
UK 7.5%
India 6.1%

The Hair Thinning Solutions Market in Germany is projected to grow at a CAGR of 7.3 percent during the forecast period. Expansion is expected to be supported by strong pharmacy-led trust, adherence to strict quality standards, and consumer preference for clinically proven formulations. Increased acceptance of hair health as part of preventive care is anticipated to reinforce adoption among aging consumers, while digital channels are projected to extend reach to younger cohorts. Professional salon recommendations are likely to sustain premium positioning.
  • Pharmacy-driven credibility is anticipated to strengthen brand adoption.
  • Preventive care integration is projected to expand aging consumer demand.
  • Digital retail growth is expected to capture younger demographics.
  • Professional salons are likely to reinforce premium and trusted solutions.

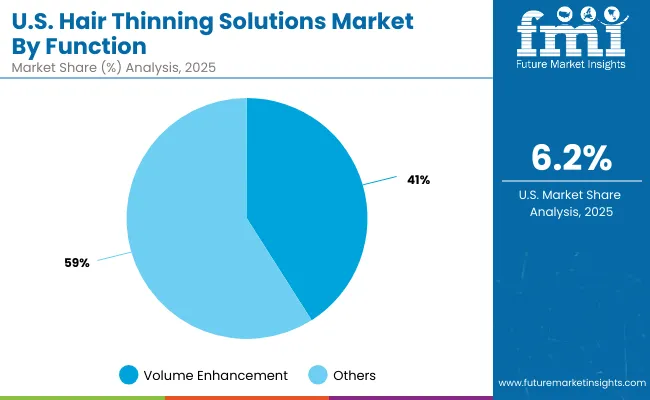
Growth Outlook for Hair Thinning Solutions Market in USA

Hair Thinning Solutions Market Usa 2

USA By FUNCTION Market Value Share, 2025
Volume enhancement 41%
Others 59.0%

The Hair Thinning Solutions Market in the United States is projected at USD 2366.49 million in 2025. Within this, volume enhancement accounts for 41 percent with USD 970.26 million, while other functional outcomes collectively contribute 59 percent with USD 1396.23 million. The greater share of non-volume categories highlights the widening consumer focus on strand strengthening, scalp nourishment, and anti-breakage solutions that extend beyond cosmetic thickening. This shift reflects evolving expectations where effectiveness is judged not only by immediate fullness but also by long-term strand resilience and scalp health. Dermatology-led endorsements and ingredient transparency are reinforcing credibility, particularly in categories that emphasize repair and prevention.
  • Volume enhancement retains 41% share in 2025 with USD 970.26 million.
  • Other functions collectively dominate with 59% share at USD 1396.23 million.
  • Consumer demand is shifting toward scalp health and prevention-focused solutions.
  • Professional recommendations are amplifying the value of diversified functional outcomes.

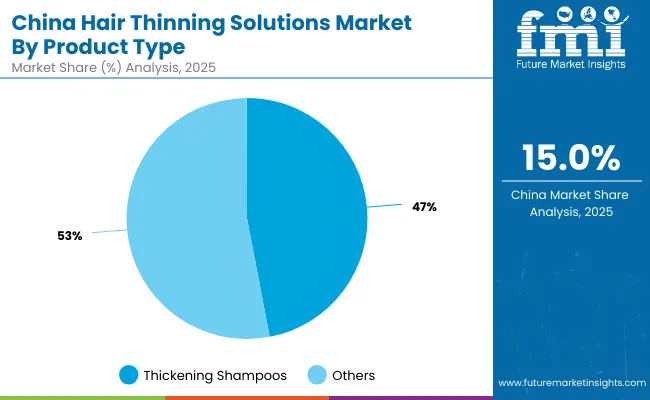
Opportunity Analysis of China Hair Thinning Solutions Market

Hair Thinning Solutions Market China

China By product type Market Value Share, 2025
Thickening shampoos 47%
Others 53.0%

The Hair Thinning Solutions Market in China is projected at USD 765.12 million in 2025. Thickening shampoos represent 47 percent of the value at USD 359.60 million, while other product types collectively hold a 53 percent share at USD 405.51 million. The prominence of thickening shampoos demonstrates their role as an accessible entry point for new consumers, providing immediate visual results that align with growing urban grooming habits. However, the slightly higher share of other product types reflects a transition toward multi-functional regimens, including conditioners, serums, and nutritional supplements, which offer more comprehensive care. E-commerce ecosystems and quick-commerce platforms are expected to accelerate adoption by improving convenience and reinforcing product discovery.
  • Thickening shampoos capture 47% share in 2025 with USD 359.60 million.
  • Other product types collectively dominate at 53% share with USD 405.51 million.
  • Broader regimen adoption is projected as consumers shift toward multi-functional solutions.
  • E-commerce and quick-commerce channels are expected to accelerate nationwide market penetration.

Competitive Landscape of Hair Thinning Solutions Market

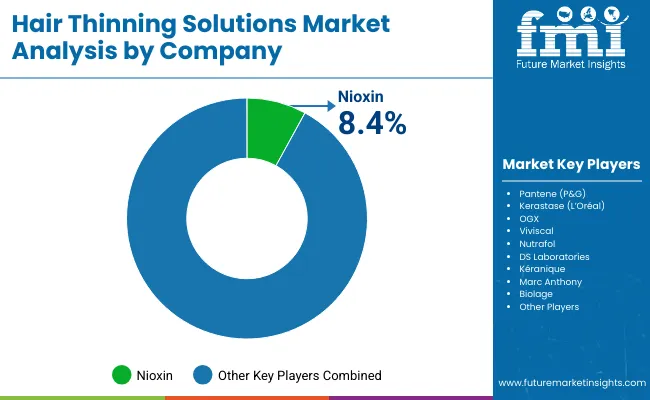
Hair Thinning Solutions Market By Company

The Hair Thinning Solutions Market is moderately fragmented, with global consumer health brands, specialist innovators, and niche-focused formulators competing across diverse distribution channels. Global leaders such as Nioxin and Pantene (P&G) maintain significant visibility, supported by strong retail penetration, salon endorsements, and continuous innovation in thickening shampoos. Their strategies are increasingly aligned with clinically validated claims, ingredient transparency, and omnichannel integration, particularly through e-commerce subscriptions and dermatology-linked partnerships.

Established mid-sized players, including Nutrafol, Viviscal, and DS Laboratories, are catering to the demand for supplement-based and multi-functional regimens. These companies are accelerating adoption through nutraceutical blends, scalp health formulations, and personalized routines that appeal to both men and women.

Niche brands such as Marc Anthony, OGX, and Kéranique focus on cost-effective, consumer-friendly solutions that emphasize affordability, accessibility, and stylist-driven trust. Their strength lies in customization, influencer-led marketing, and regional adaptability rather than global scale.

Competitive differentiation is shifting away from simple thickening promises toward integrated regimens that combine topical care, supplements, and diagnostics. Digital-first approaches, including AI-based scalp analysis, subscription replenishment, and holistic care ecosystems, are expected to define future leadership.

Key Developments in Hair Thinning Solutions Market

  • In July 2025, Leqselvi, an 8 mg tablet by Sun Pharma for treatment of severe alopecia areata, was launched in the USA following a patent-settlement. The introduction is expected to shift treatment portfolios toward prescription therapeutics and expand non-topical care options among consumers.
  • In August 2025, Mallia Aesthetics GmbH completed regulatory validation steps for its cosmetic ingredient MAL-838, derived from soluble CD83, as part of a new hormone-free product line targeting hair growth. This milestone is expected to elevate interest in biotechnology-based, safe alternatives to hormone-driven solutions.

Scope of the Report

Item Value
Market Value & Units USD 6,201.2 million (2025); USD 14,002.1 million (2035); CAGR 8.5% (2025-2035)
Core Segments (Scope) Product Type; Function; Active Ingredient; Channel; End User; Region/Country
Product Type Thickening shampoos; Others (conditioners/leave-ins, topical sprays/serums, supplements)
Function Volume enhancement; Others (strand strengthening, scalp nutrition, anti-breakage)
Active Ingredient Keratin proteins; Others (biotin, caffeine, niacinamide blends)
Channel E-commerce; Pharmacies/drugstores; Salons & professional; Mass retail
End User Women; Men; Aging consumers
Regions Covered North America; Europe; East Asia; South Asia & Pacific; Latin America; Middle East & Africa
Countries Covered United States; China; India; United Kingdom; Germany; Japan
Leading Country Growth (CAGR) India 16.9%; China 15.0%; Japan 12.2%; UK 9.7%; Germany 7.3%; USA 6.2% (2025-2035)
2025 Segment Benchmarks Product Type: Thickening shampoos 44% (USD 2,728.53 million); Function: Volume enhancement 48% (USD 2,976.58 million); Active Ingredient: Keratin proteins 39% (USD 2,418.47 million); E-commerce channel 39% (USD 2,418.47 million, global)
Competitive Snapshot (2025) Nioxin 8.4% global value share; Others 91.6%
Key Companies Profiled Nioxin; Pantene (P&G); Kérastase (L’Oréal); OGX; Viviscal; Nutrafol; DS Laboratories; Kéranique; Marc Anthony; Biolage
USA Market Trajectory USD 2,366.49 million (2025) → USD 4,871.16 million (2035)
China Marker (2025) USD 765.12 million total; Thickening shampoos 47% (USD 359.60 million)
Scope Notes (Method) All values and shares reflect the Hair Thinning Solutions Market; figures synthesized from provided dataset; outlook expressed in passive, evidence-based terms
Additional Attributes Value splits by function, product type, active ingredient, and channel; subscription and e-commerce penetration; dermatologist-endorsed claims; personalization via digital diagnostics; aging-cohort adoption; Asia-led acceleration; fragmentation with long-tail challengers

Key Segments

By Product Type:

  • Thickening shampoos
  • Conditioners/leave-ins
  • Topical sprays/serums
  • Supplements

By Function:

  • Volume enhancement
  • Strand strengthening
  • Scalp nutrition
  • Anti-breakage

By Active Ingredient:

  • Keratin proteins
  • Biotin
  • Caffeine
  • Niacinamide blends

By Channel:

  • E-commerce
  • Pharmacies/drugstores
  • Salons & professional
  • Mass retail

By End User:

  • Women
  • Men
  • Aging consumers

By Region:

  • North America
  • Latin America
  • Europe
  • East Asia
  • South Asia & Pacific
  • Middle East and Africa

Table of Content

  1. Executive Summary
    • Global Market Outlook
    • Demand-side Trends
    • Supply-side Trends
    • Technology Roadmap Analysis
    • Analysis and Recommendations
  2. Market Overview
    • Market Coverage / Taxonomy
    • Market Definition / Scope / Limitations
  3. Market Background
    • Market Dynamics
      • Drivers
      • Restraints
      • Opportunity
      • Trends
    • Scenario Forecast
      • Demand in Optimistic Scenario
      • Demand in Likely Scenario
      • Demand in Conservative Scenario
    • Opportunity Map Analysis
    • Product Life Cycle Analysis
    • Supply Chain Analysis
      • Supply Side Participants and their Roles
        • Producers
        • Mid-Level Participants (Traders/ Agents/ Brokers)
        • Wholesalers and Distributors
      • Value Added and Value Created at Node in the Supply Chain
      • List of Raw Material Suppliers
      • List of Existing and Potential Buyer’s
    • Investment Feasibility Matrix
    • Value Chain Analysis
      • Profit Margin Analysis
      • Wholesalers and Distributors
      • Retailers
    • PESTLE and Porter’s Analysis
    • Regulatory Landscape
      • By Key Regions
      • By Key Countries
    • Regional Parent Market Outlook
    • Production and Consumption Statistics
    • Import and Export Statistics
  4. Global Market Analysis 2020 to 2024 and Forecast, 2025 to 2035
    • Historical Market Size Value (USD Million) & Volume (Units) Analysis, 2020 to 2024
    • Current and Future Market Size Value (USD Million) & Volume (Units) Projections, 2025 to 2035
      • Y-o-Y Growth Trend Analysis
      • Absolute $ Opportunity Analysis
  5. Global Market Analysis 2020 to 2024 and Forecast 2025 to 2035, By Product Type
    • Introduction / Key Findings
    • Historical Market Size Value (USD Million) & Volume (Units) Analysis By Product Type, 2020 to 2024
    • Current and Future Market Size Value (USD Million) & Volume (Units) Analysis and Forecast By Product Type, 2025 to 2035
      • Thickening shampoos
      • Conditioners/leave-ins
      • Topical sprays/serums
      • Supplements
    • Y-o-Y Growth Trend Analysis By Product Type, 2020 to 2024
    • Absolute $ Opportunity Analysis By Product Type, 2025 to 2035
  6. Global Market Analysis 2020 to 2024 and Forecast 2025 to 2035, By Function
    • Introduction / Key Findings
    • Historical Market Size Value (USD Million) & Volume (Units) Analysis By Function, 2020 to 2024
    • Current and Future Market Size Value (USD Million) & Volume (Units) Analysis and Forecast By Function, 2025 to 2035
      • Volume enhancement
      • Strand strengthening
      • Scalp nutrition
      • Anti-breakage
    • Y-o-Y Growth Trend Analysis By Function, 2020 to 2024
    • Absolute $ Opportunity Analysis By Function, 2025 to 2035
  7. Global Market Analysis 2020 to 2024 and Forecast 2025 to 2035, By Active Ingredient
    • Introduction / Key Findings
    • Historical Market Size Value (USD Million) & Volume (Units) Analysis By Active Ingredient, 2020 to 2024
    • Current and Future Market Size Value (USD Million) & Volume (Units) Analysis and Forecast By Active Ingredient, 2025 to 2035
      • Keratin proteins
      • Biotin
      • Caffeine
      • Niacinamide blends
    • Y-o-Y Growth Trend Analysis By Active Ingredient, 2020 to 2024
    • Absolute $ Opportunity Analysis By Active Ingredient, 2025 to 2035
  8. Global Market Analysis 2020 to 2024 and Forecast 2025 to 2035, By Channel
    • Introduction / Key Findings
    • Historical Market Size Value (USD Million) & Volume (Units) Analysis By Channel, 2020 to 2024
    • Current and Future Market Size Value (USD Million) & Volume (Units) Analysis and Forecast By Channel, 2025 to 2035
      • E-commerce
      • Pharmacies/drugstores
      • Salons & professional
      • Mass retail
    • Y-o-Y Growth Trend Analysis By Channel, 2020 to 2024
    • Absolute $ Opportunity Analysis By Channel, 2025 to 2035
  9. Global Market Analysis 2020 to 2024 and Forecast 2025 to 2035, By End User
    • Introduction / Key Findings
    • Historical Market Size Value (USD Million) & Volume (Units) Analysis By End User, 2020 to 2024
    • Current and Future Market Size Value (USD Million) & Volume (Units) Analysis and Forecast By End User, 2025 to 2035
      • Women
      • Men
      • Aging consumers
    • Y-o-Y Growth Trend Analysis By End User, 2020 to 2024
    • Absolute $ Opportunity Analysis By End User, 2025 to 2035
  10. Global Market Analysis 2020 to 2024 and Forecast 2025 to 2035, By Region
    • Introduction
    • Historical Market Size Value (USD Million) & Volume (Units) Analysis By Region, 2020 to 2024
    • Current Market Size Value (USD Million) & Volume (Units) Analysis and Forecast By Region, 2025 to 2035
      • North America
      • Latin America
      • Europe
      • East Asia
      • South Asia & Pacific
      • Middle East and Africa
    • Market Attractiveness Analysis By Region
  11. North America Market Analysis 2020 to 2024 and Forecast 2025 to 2035, By Country
    • Historical Market Size Value (USD Million) & Volume (Units) Trend Analysis By Market Taxonomy, 2020 to 2024
    • Market Size Value (USD Million) & Volume (Units) Forecast By Market Taxonomy, 2025 to 2035
      • By Country
        • USA
        • Canada
      • By Product Type
      • By Function
      • By Active Ingredient
      • By Channel
      • By End User
    • Market Attractiveness Analysis
      • By Country
      • By Product Type
      • By Function
      • By Active Ingredient
      • By Channel
      • By End User
    • Key Takeaways
  12. Latin America Market Analysis 2020 to 2024 and Forecast 2025 to 2035, By Country
    • Historical Market Size Value (USD Million) & Volume (Units) Trend Analysis By Market Taxonomy, 2020 to 2024
    • Market Size Value (USD Million) & Volume (Units) Forecast By Market Taxonomy, 2025 to 2035
      • By Country
        • Brazil
        • Mexico
        • Colombia
        • Rest of Latin America
      • By Product Type
      • By Function
      • By Active Ingredient
      • By Channel
      • By End User
    • Market Attractiveness Analysis
      • By Country
      • By Product Type
      • By Function
      • By Active Ingredient
      • By Channel
      • By End User
    • Key Takeaways
  13. Europe Market Analysis 2020 to 2024 and Forecast 2025 to 2035, By Country
    • Historical Market Size Value (USD Million) & Volume (Units) Trend Analysis By Market Taxonomy, 2020 to 2024
    • Market Size Value (USD Million) & Volume (Units) Forecast By Market Taxonomy, 2025 to 2035
      • By Country
        • Germany
        • UK
        • France
        • Italy
        • Spain
        • Belgium
        • Netherlands
        • Nordic
        • Switzerland
        • Russia
        • Poland
        • Rest of Europe
      • By Product Type
      • By Function
      • By Active Ingredient
      • By Channel
      • By End User
    • Market Attractiveness Analysis
      • By Country
      • By Product Type
      • By Function
      • By Active Ingredient
      • By Channel
      • By End User
    • Key Takeaways
  14. East Asia Market Analysis 2020 to 2024 and Forecast 2025 to 2035, By Country
    • Historical Market Size Value (USD Million) & Volume (Units) Trend Analysis By Market Taxonomy, 2020 to 2024
    • Market Size Value (USD Million) & Volume (Units) Forecast By Market Taxonomy, 2025 to 2035
      • By Country
        • China
        • Japan
        • South Korea
      • By Product Type
      • By Function
      • By Active Ingredient
      • By Channel
      • By End User
    • Market Attractiveness Analysis
      • By Country
      • By Product Type
      • By Function
      • By Active Ingredient
      • By Channel
      • By End User
    • Key Takeaways
  15. South Asia & Pacific Market Analysis 2020 to 2024 and Forecast 2025 to 2035, By Country
    • Historical Market Size Value (USD Million) & Volume (Units) Trend Analysis By Market Taxonomy, 2020 to 2024
    • Market Size Value (USD Million) & Volume (Units) Forecast By Market Taxonomy, 2025 to 2035
      • By Country
        • India
        • Thailand
        • Malaysia
        • Indonesia
        • Singapore
        • Vietnam
        • Australia
        • New Zealand
        • Rest of South Asia
      • By Product Type
      • By Function
      • By Active Ingredient
      • By Channel
      • By End User
    • Market Attractiveness Analysis
      • By Country
      • By Product Type
      • By Function
      • By Active Ingredient
      • By Channel
      • By End User
    • Key Takeaways
  16. Middle East and Africa Market Analysis 2020 to 2024 and Forecast 2025 to 2035, By Country
    • Historical Market Size Value (USD Million) & Volume (Units) Trend Analysis By Market Taxonomy, 2020 to 2024
    • Market Size Value (USD Million) & Volume (Units) Forecast By Market Taxonomy, 2025 to 2035
      • By Country
        • Turkey
        • UAE
        • Saudi Arabia
        • Israel
        • Other GCC Countries
        • North Africa
        • South Africa
      • By Product Type
      • By Function
      • By Active Ingredient
      • By Channel
      • By End User
    • Market Attractiveness Analysis
      • By Country
      • By Product Type
      • By Function
      • By Active Ingredient
      • By Channel
      • By End User
    • Key Takeaways
  17. Key Countries Market Analysis
    • USA
      • Pricing Analysis
      • Market Share Analysis, 2024
        • By Product Type
        • By Function
        • By Active Ingredient
        • By Channel
        • By End User
    • Canada
      • Pricing Analysis
      • Market Share Analysis, 2024
        • By Product Type
        • By Function
        • By Active Ingredient
        • By Channel
        • By End User
    • Brazil
      • Pricing Analysis
      • Market Share Analysis, 2024
        • By Product Type
        • By Function
        • By Active Ingredient
        • By Channel
        • By End User
    • Mexico
      • Pricing Analysis
      • Market Share Analysis, 2024
        • By Product Type
        • By Function
        • By Active Ingredient
        • By Channel
        • By End User
    • Colombia
      • Pricing Analysis
      • Market Share Analysis, 2024
        • By Product Type
        • By Function
        • By Active Ingredient
        • By Channel
        • By End User
    • Germany
      • Pricing Analysis
      • Market Share Analysis, 2024
        • By Product Type
        • By Function
        • By Active Ingredient
        • By Channel
        • By End User
    • UK
      • Pricing Analysis
      • Market Share Analysis, 2024
        • By Product Type
        • By Function
        • By Active Ingredient
        • By Channel
        • By End User
    • France
      • Pricing Analysis
      • Market Share Analysis, 2024
        • By Product Type
        • By Function
        • By Active Ingredient
        • By Channel
        • By End User
    • Italy
      • Pricing Analysis
      • Market Share Analysis, 2024
        • By Product Type
        • By Function
        • By Active Ingredient
        • By Channel
        • By End User
    • Spain
      • Pricing Analysis
      • Market Share Analysis, 2024
        • By Product Type
        • By Function
        • By Active Ingredient
        • By Channel
        • By End User
    • Belgium
      • Pricing Analysis
      • Market Share Analysis, 2024
        • By Product Type
        • By Function
        • By Active Ingredient
        • By Channel
        • By End User
    • Netherlands
      • Pricing Analysis
      • Market Share Analysis, 2024
        • By Product Type
        • By Function
        • By Active Ingredient
        • By Channel
        • By End User
    • Nordic
      • Pricing Analysis
      • Market Share Analysis, 2024
        • By Product Type
        • By Function
        • By Active Ingredient
        • By Channel
        • By End User
    • Switzerland
      • Pricing Analysis
      • Market Share Analysis, 2024
        • By Product Type
        • By Function
        • By Active Ingredient
        • By Channel
        • By End User
    • Russia
      • Pricing Analysis
      • Market Share Analysis, 2024
        • By Product Type
        • By Function
        • By Active Ingredient
        • By Channel
        • By End User
    • Poland
      • Pricing Analysis
      • Market Share Analysis, 2024
        • By Product Type
        • By Function
        • By Active Ingredient
        • By Channel
        • By End User
    • China
      • Pricing Analysis
      • Market Share Analysis, 2024
        • By Product Type
        • By Function
        • By Active Ingredient
        • By Channel
        • By End User
    • Japan
      • Pricing Analysis
      • Market Share Analysis, 2024
        • By Product Type
        • By Function
        • By Active Ingredient
        • By Channel
        • By End User
    • South Korea
      • Pricing Analysis
      • Market Share Analysis, 2024
        • By Product Type
        • By Function
        • By Active Ingredient
        • By Channel
        • By End User
    • India
      • Pricing Analysis
      • Market Share Analysis, 2024
        • By Product Type
        • By Function
        • By Active Ingredient
        • By Channel
        • By End User
    • Thailand
      • Pricing Analysis
      • Market Share Analysis, 2024
        • By Product Type
        • By Function
        • By Active Ingredient
        • By Channel
        • By End User
    • Indonesia
      • Pricing Analysis
      • Market Share Analysis, 2024
        • By Product Type
        • By Function
        • By Active Ingredient
        • By Channel
        • By End User
    • Australia
      • Pricing Analysis
      • Market Share Analysis, 2024
        • By Product Type
        • By Function
        • By Active Ingredient
        • By Channel
        • By End User
    • New Zealand
      • Pricing Analysis
      • Market Share Analysis, 2024
        • By Product Type
        • By Function
        • By Active Ingredient
        • By Channel
        • By End User
    • Turkey
      • Pricing Analysis
      • Market Share Analysis, 2024
        • By Product Type
        • By Function
        • By Active Ingredient
        • By Channel
        • By End User
    • UAE
      • Pricing Analysis
      • Market Share Analysis, 2024
        • By Product Type
        • By Function
        • By Active Ingredient
        • By Channel
        • By End User
    • Saudi Arabia
      • Pricing Analysis
      • Market Share Analysis, 2024
        • By Product Type
        • By Function
        • By Active Ingredient
        • By Channel
        • By End User
    • Israel
      • Pricing Analysis
      • Market Share Analysis, 2024
        • By Product Type
        • By Function
        • By Active Ingredient
        • By Channel
        • By End User
    • North Africa
      • Pricing Analysis
      • Market Share Analysis, 2024
        • By Product Type
        • By Function
        • By Active Ingredient
        • By Channel
        • By End User
    • South Africa
      • Pricing Analysis
      • Market Share Analysis, 2024
        • By Product Type
        • By Function
        • By Active Ingredient
        • By Channel
        • By End User
  18. Market Structure Analysis
    • Competition Dashboard
    • Competition Benchmarking
    • Market Share Analysis of Top Players
      • By Regional
      • By Product Type
      • By Function
      • By Active Ingredient
      • By Channel
      • By End User
  19. Competition Analysis
    • Competition Deep Dive
      • Nioxin
        • Overview
        • Product Portfolio
        • Profitability by Market Segments (Product/Age /Sales Channel/Region)
        • Sales Footprint
        • Strategy Overview
          • Marketing Strategy
          • Product Strategy
          • Channel Strategy
      • Pantene (P&G)
        • Overview
        • Product Portfolio
        • Profitability by Market Segments (Product/Age /Sales Channel/Region)
        • Sales Footprint
        • Strategy Overview
          • Marketing Strategy
          • Product Strategy
          • Channel Strategy
      • Kerastase (L’Oréal)
        • Overview
        • Product Portfolio
        • Profitability by Market Segments (Product/Age /Sales Channel/Region)
        • Sales Footprint
        • Strategy Overview
          • Marketing Strategy
          • Product Strategy
          • Channel Strategy
      • OGX
        • Overview
        • Product Portfolio
        • Profitability by Market Segments (Product/Age /Sales Channel/Region)
        • Sales Footprint
        • Strategy Overview
          • Marketing Strategy
          • Product Strategy
          • Channel Strategy
      • Viviscal
        • Overview
        • Product Portfolio
        • Profitability by Market Segments (Product/Age /Sales Channel/Region)
        • Sales Footprint
        • Strategy Overview
          • Marketing Strategy
          • Product Strategy
          • Channel Strategy
      • Nutrafol
        • Overview
        • Product Portfolio
        • Profitability by Market Segments (Product/Age /Sales Channel/Region)
        • Sales Footprint
        • Strategy Overview
          • Marketing Strategy
          • Product Strategy
          • Channel Strategy
      • DS Laboratories
        • Overview
        • Product Portfolio
        • Profitability by Market Segments (Product/Age /Sales Channel/Region)
        • Sales Footprint
        • Strategy Overview
          • Marketing Strategy
          • Product Strategy
          • Channel Strategy
      • Kéranique
        • Overview
        • Product Portfolio
        • Profitability by Market Segments (Product/Age /Sales Channel/Region)
        • Sales Footprint
        • Strategy Overview
          • Marketing Strategy
          • Product Strategy
          • Channel Strategy
      • Marc Anthony
        • Overview
        • Product Portfolio
        • Profitability by Market Segments (Product/Age /Sales Channel/Region)
        • Sales Footprint
        • Strategy Overview
          • Marketing Strategy
          • Product Strategy
          • Channel Strategy
      • Biolage
        • Overview
        • Product Portfolio
        • Profitability by Market Segments (Product/Age /Sales Channel/Region)
        • Sales Footprint
        • Strategy Overview
          • Marketing Strategy
          • Product Strategy
          • Channel Strategy
      • Others
        • Overview
        • Product Portfolio
        • Profitability by Market Segments (Product/Age /Sales Channel/Region)
        • Sales Footprint
        • Strategy Overview
          • Marketing Strategy
          • Product Strategy
          • Channel Strategy
  20. Assumptions & Acronyms Used
  21. Research Methodology

List of Tables

  • Table 1: Global Market Value (USD Million) Forecast by Region, 2020-2035
  • Table 2: Global Market Volume (Units) Forecast by Region, 2020-2035
  • Table 3: Global Market Value (USD Million) Forecast by Product Type, 2020-2035
  • Table 4: Global Market Volume (Units) Forecast by Product Type, 2020-2035
  • Table 5: Global Market Value (USD Million) Forecast by Function, 2020-2035
  • Table 6: Global Market Volume (Units) Forecast by Function, 2020-2035
  • Table 7: Global Market Value (USD Million) Forecast by Active Ingredient, 2020-2035
  • Table 8: Global Market Volume (Units) Forecast by Active Ingredient, 2020-2035
  • Table 9: Global Market Value (USD Million) Forecast by Channel, 2020-2035
  • Table 10: Global Market Volume (Units) Forecast by Channel, 2020-2035
  • Table 11: Global Market Value (USD Million) Forecast by End User, 2020-2035
  • Table 12: Global Market Volume (Units) Forecast by End User, 2020-2035
  • Table 13: North America Market Value (USD Million) Forecast by Country, 2020-2035
  • Table 14: North America Market Volume (Units) Forecast by Country, 2020-2035
  • Table 15: North America Market Value (USD Million) Forecast by Product Type, 2020-2035
  • Table 16: North America Market Volume (Units) Forecast by Product Type, 2020-2035
  • Table 17: North America Market Value (USD Million) Forecast by Function, 2020-2035
  • Table 18: North America Market Volume (Units) Forecast by Function, 2020-2035
  • Table 19: North America Market Value (USD Million) Forecast by Active Ingredient, 2020-2035
  • Table 20: North America Market Volume (Units) Forecast by Active Ingredient, 2020-2035
  • Table 21: North America Market Value (USD Million) Forecast by Channel, 2020-2035
  • Table 22: North America Market Volume (Units) Forecast by Channel, 2020-2035
  • Table 23: North America Market Value (USD Million) Forecast by End User, 2020-2035
  • Table 24: North America Market Volume (Units) Forecast by End User, 2020-2035
  • Table 25: Latin America Market Value (USD Million) Forecast by Country, 2020-2035
  • Table 26: Latin America Market Volume (Units) Forecast by Country, 2020-2035
  • Table 27: Latin America Market Value (USD Million) Forecast by Product Type, 2020-2035
  • Table 28: Latin America Market Volume (Units) Forecast by Product Type, 2020-2035
  • Table 29: Latin America Market Value (USD Million) Forecast by Function, 2020-2035
  • Table 30: Latin America Market Volume (Units) Forecast by Function, 2020-2035
  • Table 31: Latin America Market Value (USD Million) Forecast by Active Ingredient, 2020-2035
  • Table 32: Latin America Market Volume (Units) Forecast by Active Ingredient, 2020-2035
  • Table 33: Latin America Market Value (USD Million) Forecast by Channel, 2020-2035
  • Table 34: Latin America Market Volume (Units) Forecast by Channel, 2020-2035
  • Table 35: Latin America Market Value (USD Million) Forecast by End User, 2020-2035
  • Table 36: Latin America Market Volume (Units) Forecast by End User, 2020-2035
  • Table 37: Europe Market Value (USD Million) Forecast by Country, 2020-2035
  • Table 38: Europe Market Volume (Units) Forecast by Country, 2020-2035
  • Table 39: Europe Market Value (USD Million) Forecast by Product Type, 2020-2035
  • Table 40: Europe Market Volume (Units) Forecast by Product Type, 2020-2035
  • Table 41: Europe Market Value (USD Million) Forecast by Function, 2020-2035
  • Table 42: Europe Market Volume (Units) Forecast by Function, 2020-2035
  • Table 43: Europe Market Value (USD Million) Forecast by Active Ingredient, 2020-2035
  • Table 44: Europe Market Volume (Units) Forecast by Active Ingredient, 2020-2035
  • Table 45: Europe Market Value (USD Million) Forecast by Channel, 2020-2035
  • Table 46: Europe Market Volume (Units) Forecast by Channel, 2020-2035
  • Table 47: Europe Market Value (USD Million) Forecast by End User, 2020-2035
  • Table 48: Europe Market Volume (Units) Forecast by End User, 2020-2035
  • Table 49: East Asia Market Value (USD Million) Forecast by Country, 2020-2035
  • Table 50: East Asia Market Volume (Units) Forecast by Country, 2020-2035
  • Table 51: East Asia Market Value (USD Million) Forecast by Product Type, 2020-2035
  • Table 52: East Asia Market Volume (Units) Forecast by Product Type, 2020-2035
  • Table 53: East Asia Market Value (USD Million) Forecast by Function, 2020-2035
  • Table 54: East Asia Market Volume (Units) Forecast by Function, 2020-2035
  • Table 55: East Asia Market Value (USD Million) Forecast by Active Ingredient, 2020-2035
  • Table 56: East Asia Market Volume (Units) Forecast by Active Ingredient, 2020-2035
  • Table 57: East Asia Market Value (USD Million) Forecast by Channel, 2020-2035
  • Table 58: East Asia Market Volume (Units) Forecast by Channel, 2020-2035
  • Table 59: East Asia Market Value (USD Million) Forecast by End User, 2020-2035
  • Table 60: East Asia Market Volume (Units) Forecast by End User, 2020-2035
  • Table 61: South Asia & Pacific Market Value (USD Million) Forecast by Country, 2020-2035
  • Table 62: South Asia & Pacific Market Volume (Units) Forecast by Country, 2020-2035
  • Table 63: South Asia & Pacific Market Value (USD Million) Forecast by Product Type, 2020-2035
  • Table 64: South Asia & Pacific Market Volume (Units) Forecast by Product Type, 2020-2035
  • Table 65: South Asia & Pacific Market Value (USD Million) Forecast by Function, 2020-2035
  • Table 66: South Asia & Pacific Market Volume (Units) Forecast by Function, 2020-2035
  • Table 67: South Asia & Pacific Market Value (USD Million) Forecast by Active Ingredient, 2020-2035
  • Table 68: South Asia & Pacific Market Volume (Units) Forecast by Active Ingredient, 2020-2035
  • Table 69: South Asia & Pacific Market Value (USD Million) Forecast by Channel, 2020-2035
  • Table 70: South Asia & Pacific Market Volume (Units) Forecast by Channel, 2020-2035
  • Table 71: South Asia & Pacific Market Value (USD Million) Forecast by End User, 2020-2035
  • Table 72: South Asia & Pacific Market Volume (Units) Forecast by End User, 2020-2035
  • Table 73: Middle East and Africa Market Value (USD Million) Forecast by Country, 2020-2035
  • Table 74: Middle East and Africa Market Volume (Units) Forecast by Country, 2020-2035
  • Table 75: Middle East and Africa Market Value (USD Million) Forecast by Product Type, 2020-2035
  • Table 76: Middle East and Africa Market Volume (Units) Forecast by Product Type, 2020-2035
  • Table 77: Middle East and Africa Market Value (USD Million) Forecast by Function, 2020-2035
  • Table 78: Middle East and Africa Market Volume (Units) Forecast by Function, 2020-2035
  • Table 79: Middle East and Africa Market Value (USD Million) Forecast by Active Ingredient, 2020-2035
  • Table 80: Middle East and Africa Market Volume (Units) Forecast by Active Ingredient, 2020-2035
  • Table 81: Middle East and Africa Market Value (USD Million) Forecast by Channel, 2020-2035
  • Table 82: Middle East and Africa Market Volume (Units) Forecast by Channel, 2020-2035
  • Table 83: Middle East and Africa Market Value (USD Million) Forecast by End User, 2020-2035
  • Table 84: Middle East and Africa Market Volume (Units) Forecast by End User, 2020-2035

List of Figures

  • Figure 1: Global Market Value (USD Million) by Product Type, 2025-2035
  • Figure 2: Global Market Value (USD Million) by Function, 2025-2035
  • Figure 3: Global Market Value (USD Million) by Active Ingredient, 2025-2035
  • Figure 4: Global Market Value (USD Million) by Channel, 2025-2035
  • Figure 5: Global Market Value (USD Million) by End User, 2025-2035
  • Figure 6: Global Market Value (USD Million) by Region, 2025-2035
  • Figure 7: Global Market Value (USD Million) Analysis by Region, 2020-2035
  • Figure 8: Global Market Volume (Units) Analysis by Region, 2020-2035
  • Figure 9: Global Market Value Share (%) and BPS Analysis by Region, 2025-2035
  • Figure 10: Global Market Y-o-Y Growth (%) Projections by Region, 2025-2035
  • Figure 11: Global Market Value (USD Million) Analysis by Product Type, 2020-2035
  • Figure 12: Global Market Volume (Units) Analysis by Product Type, 2020-2035
  • Figure 13: Global Market Value Share (%) and BPS Analysis by Product Type, 2025-2035
  • Figure 14: Global Market Y-o-Y Growth (%) Projections by Product Type, 2025-2035
  • Figure 15: Global Market Value (USD Million) Analysis by Function, 2020-2035
  • Figure 16: Global Market Volume (Units) Analysis by Function, 2020-2035
  • Figure 17: Global Market Value Share (%) and BPS Analysis by Function, 2025-2035
  • Figure 18: Global Market Y-o-Y Growth (%) Projections by Function, 2025-2035
  • Figure 19: Global Market Value (USD Million) Analysis by Active Ingredient, 2020-2035
  • Figure 20: Global Market Volume (Units) Analysis by Active Ingredient, 2020-2035
  • Figure 21: Global Market Value Share (%) and BPS Analysis by Active Ingredient, 2025-2035
  • Figure 22: Global Market Y-o-Y Growth (%) Projections by Active Ingredient, 2025-2035
  • Figure 23: Global Market Value (USD Million) Analysis by Channel, 2020-2035
  • Figure 24: Global Market Volume (Units) Analysis by Channel, 2020-2035
  • Figure 25: Global Market Value Share (%) and BPS Analysis by Channel, 2025-2035
  • Figure 26: Global Market Y-o-Y Growth (%) Projections by Channel, 2025-2035
  • Figure 27: Global Market Value (USD Million) Analysis by End User, 2020-2035
  • Figure 28: Global Market Volume (Units) Analysis by End User, 2020-2035
  • Figure 29: Global Market Value Share (%) and BPS Analysis by End User, 2025-2035
  • Figure 30: Global Market Y-o-Y Growth (%) Projections by End User, 2025-2035
  • Figure 31: Global Market Attractiveness by Product Type, 2025-2035
  • Figure 32: Global Market Attractiveness by Function, 2025-2035
  • Figure 33: Global Market Attractiveness by Active Ingredient, 2025-2035
  • Figure 34: Global Market Attractiveness by Channel, 2025-2035
  • Figure 35: Global Market Attractiveness by End User, 2025-2035
  • Figure 36: Global Market Attractiveness by Region, 2025-2035
  • Figure 37: North America Market Value (USD Million) by Product Type, 2025-2035
  • Figure 38: North America Market Value (USD Million) by Function, 2025-2035
  • Figure 39: North America Market Value (USD Million) by Active Ingredient, 2025-2035
  • Figure 40: North America Market Value (USD Million) by Channel, 2025-2035
  • Figure 41: North America Market Value (USD Million) by End User, 2025-2035
  • Figure 42: North America Market Value (USD Million) by Country, 2025-2035
  • Figure 43: North America Market Value (USD Million) Analysis by Country, 2020-2035
  • Figure 44: North America Market Volume (Units) Analysis by Country, 2020-2035
  • Figure 45: North America Market Value Share (%) and BPS Analysis by Country, 2025-2035
  • Figure 46: North America Market Y-o-Y Growth (%) Projections by Country, 2025-2035
  • Figure 47: North America Market Value (USD Million) Analysis by Product Type, 2020-2035
  • Figure 48: North America Market Volume (Units) Analysis by Product Type, 2020-2035
  • Figure 49: North America Market Value Share (%) and BPS Analysis by Product Type, 2025-2035
  • Figure 50: North America Market Y-o-Y Growth (%) Projections by Product Type, 2025-2035
  • Figure 51: North America Market Value (USD Million) Analysis by Function, 2020-2035
  • Figure 52: North America Market Volume (Units) Analysis by Function, 2020-2035
  • Figure 53: North America Market Value Share (%) and BPS Analysis by Function, 2025-2035
  • Figure 54: North America Market Y-o-Y Growth (%) Projections by Function, 2025-2035
  • Figure 55: North America Market Value (USD Million) Analysis by Active Ingredient, 2020-2035
  • Figure 56: North America Market Volume (Units) Analysis by Active Ingredient, 2020-2035
  • Figure 57: North America Market Value Share (%) and BPS Analysis by Active Ingredient, 2025-2035
  • Figure 58: North America Market Y-o-Y Growth (%) Projections by Active Ingredient, 2025-2035
  • Figure 59: North America Market Value (USD Million) Analysis by Channel, 2020-2035
  • Figure 60: North America Market Volume (Units) Analysis by Channel, 2020-2035
  • Figure 61: North America Market Value Share (%) and BPS Analysis by Channel, 2025-2035
  • Figure 62: North America Market Y-o-Y Growth (%) Projections by Channel, 2025-2035
  • Figure 63: North America Market Value (USD Million) Analysis by End User, 2020-2035
  • Figure 64: North America Market Volume (Units) Analysis by End User, 2020-2035
  • Figure 65: North America Market Value Share (%) and BPS Analysis by End User, 2025-2035
  • Figure 66: North America Market Y-o-Y Growth (%) Projections by End User, 2025-2035
  • Figure 67: North America Market Attractiveness by Product Type, 2025-2035
  • Figure 68: North America Market Attractiveness by Function, 2025-2035
  • Figure 69: North America Market Attractiveness by Active Ingredient, 2025-2035
  • Figure 70: North America Market Attractiveness by Channel, 2025-2035
  • Figure 71: North America Market Attractiveness by End User, 2025-2035
  • Figure 72: North America Market Attractiveness by Country, 2025-2035
  • Figure 73: Latin America Market Value (USD Million) by Product Type, 2025-2035
  • Figure 74: Latin America Market Value (USD Million) by Function, 2025-2035
  • Figure 75: Latin America Market Value (USD Million) by Active Ingredient, 2025-2035
  • Figure 76: Latin America Market Value (USD Million) by Channel, 2025-2035
  • Figure 77: Latin America Market Value (USD Million) by End User, 2025-2035
  • Figure 78: Latin America Market Value (USD Million) by Country, 2025-2035
  • Figure 79: Latin America Market Value (USD Million) Analysis by Country, 2020-2035
  • Figure 80: Latin America Market Volume (Units) Analysis by Country, 2020-2035
  • Figure 81: Latin America Market Value Share (%) and BPS Analysis by Country, 2025-2035
  • Figure 82: Latin America Market Y-o-Y Growth (%) Projections by Country, 2025-2035
  • Figure 83: Latin America Market Value (USD Million) Analysis by Product Type, 2020-2035
  • Figure 84: Latin America Market Volume (Units) Analysis by Product Type, 2020-2035
  • Figure 85: Latin America Market Value Share (%) and BPS Analysis by Product Type, 2025-2035
  • Figure 86: Latin America Market Y-o-Y Growth (%) Projections by Product Type, 2025-2035
  • Figure 87: Latin America Market Value (USD Million) Analysis by Function, 2020-2035
  • Figure 88: Latin America Market Volume (Units) Analysis by Function, 2020-2035
  • Figure 89: Latin America Market Value Share (%) and BPS Analysis by Function, 2025-2035
  • Figure 90: Latin America Market Y-o-Y Growth (%) Projections by Function, 2025-2035
  • Figure 91: Latin America Market Value (USD Million) Analysis by Active Ingredient, 2020-2035
  • Figure 92: Latin America Market Volume (Units) Analysis by Active Ingredient, 2020-2035
  • Figure 93: Latin America Market Value Share (%) and BPS Analysis by Active Ingredient, 2025-2035
  • Figure 94: Latin America Market Y-o-Y Growth (%) Projections by Active Ingredient, 2025-2035
  • Figure 95: Latin America Market Value (USD Million) Analysis by Channel, 2020-2035
  • Figure 96: Latin America Market Volume (Units) Analysis by Channel, 2020-2035
  • Figure 97: Latin America Market Value Share (%) and BPS Analysis by Channel, 2025-2035
  • Figure 98: Latin America Market Y-o-Y Growth (%) Projections by Channel, 2025-2035
  • Figure 99: Latin America Market Value (USD Million) Analysis by End User, 2020-2035
  • Figure 100: Latin America Market Volume (Units) Analysis by End User, 2020-2035
  • Figure 101: Latin America Market Value Share (%) and BPS Analysis by End User, 2025-2035
  • Figure 102: Latin America Market Y-o-Y Growth (%) Projections by End User, 2025-2035
  • Figure 103: Latin America Market Attractiveness by Product Type, 2025-2035
  • Figure 104: Latin America Market Attractiveness by Function, 2025-2035
  • Figure 105: Latin America Market Attractiveness by Active Ingredient, 2025-2035
  • Figure 106: Latin America Market Attractiveness by Channel, 2025-2035
  • Figure 107: Latin America Market Attractiveness by End User, 2025-2035
  • Figure 108: Latin America Market Attractiveness by Country, 2025-2035
  • Figure 109: Europe Market Value (USD Million) by Product Type, 2025-2035
  • Figure 110: Europe Market Value (USD Million) by Function, 2025-2035
  • Figure 111: Europe Market Value (USD Million) by Active Ingredient, 2025-2035
  • Figure 112: Europe Market Value (USD Million) by Channel, 2025-2035
  • Figure 113: Europe Market Value (USD Million) by End User, 2025-2035
  • Figure 114: Europe Market Value (USD Million) by Country, 2025-2035
  • Figure 115: Europe Market Value (USD Million) Analysis by Country, 2020-2035
  • Figure 116: Europe Market Volume (Units) Analysis by Country, 2020-2035
  • Figure 117: Europe Market Value Share (%) and BPS Analysis by Country, 2025-2035
  • Figure 118: Europe Market Y-o-Y Growth (%) Projections by Country, 2025-2035
  • Figure 119: Europe Market Value (USD Million) Analysis by Product Type, 2020-2035
  • Figure 120: Europe Market Volume (Units) Analysis by Product Type, 2020-2035
  • Figure 121: Europe Market Value Share (%) and BPS Analysis by Product Type, 2025-2035
  • Figure 122: Europe Market Y-o-Y Growth (%) Projections by Product Type, 2025-2035
  • Figure 123: Europe Market Value (USD Million) Analysis by Function, 2020-2035
  • Figure 124: Europe Market Volume (Units) Analysis by Function, 2020-2035
  • Figure 125: Europe Market Value Share (%) and BPS Analysis by Function, 2025-2035
  • Figure 126: Europe Market Y-o-Y Growth (%) Projections by Function, 2025-2035
  • Figure 127: Europe Market Value (USD Million) Analysis by Active Ingredient, 2020-2035
  • Figure 128: Europe Market Volume (Units) Analysis by Active Ingredient, 2020-2035
  • Figure 129: Europe Market Value Share (%) and BPS Analysis by Active Ingredient, 2025-2035
  • Figure 130: Europe Market Y-o-Y Growth (%) Projections by Active Ingredient, 2025-2035
  • Figure 131: Europe Market Value (USD Million) Analysis by Channel, 2020-2035
  • Figure 132: Europe Market Volume (Units) Analysis by Channel, 2020-2035
  • Figure 133: Europe Market Value Share (%) and BPS Analysis by Channel, 2025-2035
  • Figure 134: Europe Market Y-o-Y Growth (%) Projections by Channel, 2025-2035
  • Figure 135: Europe Market Value (USD Million) Analysis by End User, 2020-2035
  • Figure 136: Europe Market Volume (Units) Analysis by End User, 2020-2035
  • Figure 137: Europe Market Value Share (%) and BPS Analysis by End User, 2025-2035
  • Figure 138: Europe Market Y-o-Y Growth (%) Projections by End User, 2025-2035
  • Figure 139: Europe Market Attractiveness by Product Type, 2025-2035
  • Figure 140: Europe Market Attractiveness by Function, 2025-2035
  • Figure 141: Europe Market Attractiveness by Active Ingredient, 2025-2035
  • Figure 142: Europe Market Attractiveness by Channel, 2025-2035
  • Figure 143: Europe Market Attractiveness by End User, 2025-2035
  • Figure 144: Europe Market Attractiveness by Country, 2025-2035
  • Figure 145: East Asia Market Value (USD Million) by Product Type, 2025-2035
  • Figure 146: East Asia Market Value (USD Million) by Function, 2025-2035
  • Figure 147: East Asia Market Value (USD Million) by Active Ingredient, 2025-2035
  • Figure 148: East Asia Market Value (USD Million) by Channel, 2025-2035
  • Figure 149: East Asia Market Value (USD Million) by End User, 2025-2035
  • Figure 150: East Asia Market Value (USD Million) by Country, 2025-2035
  • Figure 151: East Asia Market Value (USD Million) Analysis by Country, 2020-2035
  • Figure 152: East Asia Market Volume (Units) Analysis by Country, 2020-2035
  • Figure 153: East Asia Market Value Share (%) and BPS Analysis by Country, 2025-2035
  • Figure 154: East Asia Market Y-o-Y Growth (%) Projections by Country, 2025-2035
  • Figure 155: East Asia Market Value (USD Million) Analysis by Product Type, 2020-2035
  • Figure 156: East Asia Market Volume (Units) Analysis by Product Type, 2020-2035
  • Figure 157: East Asia Market Value Share (%) and BPS Analysis by Product Type, 2025-2035
  • Figure 158: East Asia Market Y-o-Y Growth (%) Projections by Product Type, 2025-2035
  • Figure 159: East Asia Market Value (USD Million) Analysis by Function, 2020-2035
  • Figure 160: East Asia Market Volume (Units) Analysis by Function, 2020-2035
  • Figure 161: East Asia Market Value Share (%) and BPS Analysis by Function, 2025-2035
  • Figure 162: East Asia Market Y-o-Y Growth (%) Projections by Function, 2025-2035
  • Figure 163: East Asia Market Value (USD Million) Analysis by Active Ingredient, 2020-2035
  • Figure 164: East Asia Market Volume (Units) Analysis by Active Ingredient, 2020-2035
  • Figure 165: East Asia Market Value Share (%) and BPS Analysis by Active Ingredient, 2025-2035
  • Figure 166: East Asia Market Y-o-Y Growth (%) Projections by Active Ingredient, 2025-2035
  • Figure 167: East Asia Market Value (USD Million) Analysis by Channel, 2020-2035
  • Figure 168: East Asia Market Volume (Units) Analysis by Channel, 2020-2035
  • Figure 169: East Asia Market Value Share (%) and BPS Analysis by Channel, 2025-2035
  • Figure 170: East Asia Market Y-o-Y Growth (%) Projections by Channel, 2025-2035
  • Figure 171: East Asia Market Value (USD Million) Analysis by End User, 2020-2035
  • Figure 172: East Asia Market Volume (Units) Analysis by End User, 2020-2035
  • Figure 173: East Asia Market Value Share (%) and BPS Analysis by End User, 2025-2035
  • Figure 174: East Asia Market Y-o-Y Growth (%) Projections by End User, 2025-2035
  • Figure 175: East Asia Market Attractiveness by Product Type, 2025-2035
  • Figure 176: East Asia Market Attractiveness by Function, 2025-2035
  • Figure 177: East Asia Market Attractiveness by Active Ingredient, 2025-2035
  • Figure 178: East Asia Market Attractiveness by Channel, 2025-2035
  • Figure 179: East Asia Market Attractiveness by End User, 2025-2035
  • Figure 180: East Asia Market Attractiveness by Country, 2025-2035
  • Figure 181: South Asia & Pacific Market Value (USD Million) by Product Type, 2025-2035
  • Figure 182: South Asia & Pacific Market Value (USD Million) by Function, 2025-2035
  • Figure 183: South Asia & Pacific Market Value (USD Million) by Active Ingredient, 2025-2035
  • Figure 184: South Asia & Pacific Market Value (USD Million) by Channel, 2025-2035
  • Figure 185: South Asia & Pacific Market Value (USD Million) by End User, 2025-2035
  • Figure 186: South Asia & Pacific Market Value (USD Million) by Country, 2025-2035
  • Figure 187: South Asia & Pacific Market Value (USD Million) Analysis by Country, 2020-2035
  • Figure 188: South Asia & Pacific Market Volume (Units) Analysis by Country, 2020-2035
  • Figure 189: South Asia & Pacific Market Value Share (%) and BPS Analysis by Country, 2025-2035
  • Figure 190: South Asia & Pacific Market Y-o-Y Growth (%) Projections by Country, 2025-2035
  • Figure 191: South Asia & Pacific Market Value (USD Million) Analysis by Product Type, 2020-2035
  • Figure 192: South Asia & Pacific Market Volume (Units) Analysis by Product Type, 2020-2035
  • Figure 193: South Asia & Pacific Market Value Share (%) and BPS Analysis by Product Type, 2025-2035
  • Figure 194: South Asia & Pacific Market Y-o-Y Growth (%) Projections by Product Type, 2025-2035
  • Figure 195: South Asia & Pacific Market Value (USD Million) Analysis by Function, 2020-2035
  • Figure 196: South Asia & Pacific Market Volume (Units) Analysis by Function, 2020-2035
  • Figure 197: South Asia & Pacific Market Value Share (%) and BPS Analysis by Function, 2025-2035
  • Figure 198: South Asia & Pacific Market Y-o-Y Growth (%) Projections by Function, 2025-2035
  • Figure 199: South Asia & Pacific Market Value (USD Million) Analysis by Active Ingredient, 2020-2035
  • Figure 200: South Asia & Pacific Market Volume (Units) Analysis by Active Ingredient, 2020-2035
  • Figure 201: South Asia & Pacific Market Value Share (%) and BPS Analysis by Active Ingredient, 2025-2035
  • Figure 202: South Asia & Pacific Market Y-o-Y Growth (%) Projections by Active Ingredient, 2025-2035
  • Figure 203: South Asia & Pacific Market Value (USD Million) Analysis by Channel, 2020-2035
  • Figure 204: South Asia & Pacific Market Volume (Units) Analysis by Channel, 2020-2035
  • Figure 205: South Asia & Pacific Market Value Share (%) and BPS Analysis by Channel, 2025-2035
  • Figure 206: South Asia & Pacific Market Y-o-Y Growth (%) Projections by Channel, 2025-2035
  • Figure 207: South Asia & Pacific Market Value (USD Million) Analysis by End User, 2020-2035
  • Figure 208: South Asia & Pacific Market Volume (Units) Analysis by End User, 2020-2035
  • Figure 209: South Asia & Pacific Market Value Share (%) and BPS Analysis by End User, 2025-2035
  • Figure 210: South Asia & Pacific Market Y-o-Y Growth (%) Projections by End User, 2025-2035
  • Figure 211: South Asia & Pacific Market Attractiveness by Product Type, 2025-2035
  • Figure 212: South Asia & Pacific Market Attractiveness by Function, 2025-2035
  • Figure 213: South Asia & Pacific Market Attractiveness by Active Ingredient, 2025-2035
  • Figure 214: South Asia & Pacific Market Attractiveness by Channel, 2025-2035
  • Figure 215: South Asia & Pacific Market Attractiveness by End User, 2025-2035
  • Figure 216: South Asia & Pacific Market Attractiveness by Country, 2025-2035
  • Figure 217: Middle East and Africa Market Value (USD Million) by Product Type, 2025-2035
  • Figure 218: Middle East and Africa Market Value (USD Million) by Function, 2025-2035
  • Figure 219: Middle East and Africa Market Value (USD Million) by Active Ingredient, 2025-2035
  • Figure 220: Middle East and Africa Market Value (USD Million) by Channel, 2025-2035
  • Figure 221: Middle East and Africa Market Value (USD Million) by End User, 2025-2035
  • Figure 222: Middle East and Africa Market Value (USD Million) by Country, 2025-2035
  • Figure 223: Middle East and Africa Market Value (USD Million) Analysis by Country, 2020-2035
  • Figure 224: Middle East and Africa Market Volume (Units) Analysis by Country, 2020-2035
  • Figure 225: Middle East and Africa Market Value Share (%) and BPS Analysis by Country, 2025-2035
  • Figure 226: Middle East and Africa Market Y-o-Y Growth (%) Projections by Country, 2025-2035
  • Figure 227: Middle East and Africa Market Value (USD Million) Analysis by Product Type, 2020-2035
  • Figure 228: Middle East and Africa Market Volume (Units) Analysis by Product Type, 2020-2035
  • Figure 229: Middle East and Africa Market Value Share (%) and BPS Analysis by Product Type, 2025-2035
  • Figure 230: Middle East and Africa Market Y-o-Y Growth (%) Projections by Product Type, 2025-2035
  • Figure 231: Middle East and Africa Market Value (USD Million) Analysis by Function, 2020-2035
  • Figure 232: Middle East and Africa Market Volume (Units) Analysis by Function, 2020-2035
  • Figure 233: Middle East and Africa Market Value Share (%) and BPS Analysis by Function, 2025-2035
  • Figure 234: Middle East and Africa Market Y-o-Y Growth (%) Projections by Function, 2025-2035
  • Figure 235: Middle East and Africa Market Value (USD Million) Analysis by Active Ingredient, 2020-2035
  • Figure 236: Middle East and Africa Market Volume (Units) Analysis by Active Ingredient, 2020-2035
  • Figure 237: Middle East and Africa Market Value Share (%) and BPS Analysis by Active Ingredient, 2025-2035
  • Figure 238: Middle East and Africa Market Y-o-Y Growth (%) Projections by Active Ingredient, 2025-2035
  • Figure 239: Middle East and Africa Market Value (USD Million) Analysis by Channel, 2020-2035
  • Figure 240: Middle East and Africa Market Volume (Units) Analysis by Channel, 2020-2035
  • Figure 241: Middle East and Africa Market Value Share (%) and BPS Analysis by Channel, 2025-2035
  • Figure 242: Middle East and Africa Market Y-o-Y Growth (%) Projections by Channel, 2025-2035
  • Figure 243: Middle East and Africa Market Value (USD Million) Analysis by End User, 2020-2035
  • Figure 244: Middle East and Africa Market Volume (Units) Analysis by End User, 2020-2035
  • Figure 245: Middle East and Africa Market Value Share (%) and BPS Analysis by End User, 2025-2035
  • Figure 246: Middle East and Africa Market Y-o-Y Growth (%) Projections by End User, 2025-2035
  • Figure 247: Middle East and Africa Market Attractiveness by Product Type, 2025-2035
  • Figure 248: Middle East and Africa Market Attractiveness by Function, 2025-2035
  • Figure 249: Middle East and Africa Market Attractiveness by Active Ingredient, 2025-2035
  • Figure 250: Middle East and Africa Market Attractiveness by Channel, 2025-2035
  • Figure 251: Middle East and Africa Market Attractiveness by End User, 2025-2035
  • Figure 252: Middle East and Africa Market Attractiveness by Country, 2025-2035

Frequently Asked Questions

How big is the Hair Thinning Solutions Market in 2025?

The global Hair Thinning Solutions Market is estimated to be valued at USD 6,201.2 million in 2025.

What will be the size of the Hair Thinning Solutions Market in 2035?

The market size for the Hair Thinning Solutions Market is projected to reach USD 14,002.1 million by 2035.

How much will be the Hair Thinning Solutions Market growth between 2025 and 2035?

The Hair Thinning Solutions Market is expected to grow at a CAGR of 8.5 percent between 2025 and 2035.

What are the key product types in the Hair Thinning Solutions Market?

The key product types in the Hair Thinning Solutions Market are thickening shampoos, conditioners/leave-ins, topical sprays/serums, and supplements.

Which product type is expected to contribute significant share in the Hair Thinning Solutions Market in 2025?

In terms of product type, thickening shampoos are anticipated to command a 44 percent share, valued at USD 2,728.53 million, in the Hair Thinning Solutions Market in 2025.

Explore Similar Insights

Future Market Insights

Hair Thinning Solutions Market

Chat With

MaRIA

Hi There, I am MaRIA, Your Market Research Intelligence Assistant. How may I help you?