Hair Growth Serums Market Size and Share Forecast Outlook 2025 to 2035

A valuation of USD 6,602.1 Million has been projected for the Hair Growth Serums Market in 2025, which is anticipated to advance to USD 15,503.2 Million by 2035. This reflects an expansion of nearly 2.3 times over the decade, translating into a CAGR of 8.9% during the assessment period. The strong trajectory is expected to be sustained by higher treatment adoption, widening product availability, and growing emphasis on preventative hair health solutions.
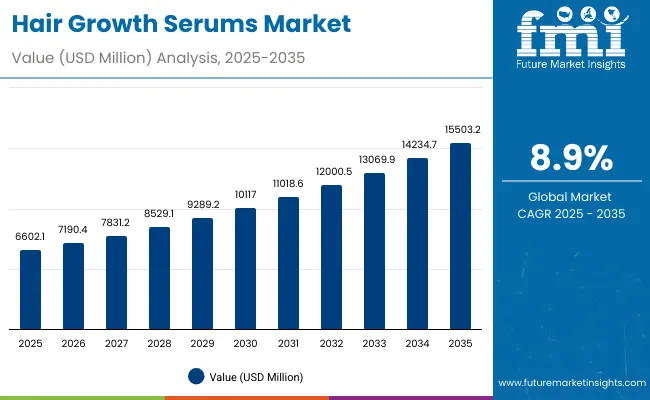
Quick Stats For Hair Growth Serums Market

  • Hair Growth Serums Market Value (2025): USD 6,602.1 Million
  • Hair Growth Serums Market Forecast Value (2035): USD 15,503.2 Million
  • Hair Growth Serums Market Forecast CAGR (2025 to 2035): 8.9%
  • Leading Segment in 2025: Minoxidil by active ingredient (42.0% share)
  • Key Growth Regions: North America, East Asia, South Asia & Pacific, Europe
  • Top Key Players: Rogaine, Kirkland Signature, Keeps, Hims, Nutrafol, Keranique, Alpecin, DS Laboratories, Vegamour, Nioxin

Hair Growth Serums Market

Hair Growth Serums Market Key Takeaways

Metric Value
Hair Growth Serums Market Estimated Value in (2025E) USD 6,602.1 Million
Hair Growth Serums Market Forecast Value in (2035F) USD 15,503.2 Million
Forecast CAGR (2025 to 2035) 8.90%

During the first half of the forecast period, from 2025 to 2030, the market is expected to increase from USD 6,602.1 Million to USD 10,117.0 Million. This gain of USD 3,514.9 Million accounts for a significant share of total decade growth. The pace will be supported by steady penetration of clinically validated active ingredients, particularly Minoxidil, which is projected to dominate with a 42.0% share in 2025. Functional categories led by follicle stimulation, representing 47.0% of value in 2025, are also expected to underpin sustained adoption.

The second phase between 2030 and 2035 is anticipated to accelerate further, adding USD 5,386.2 Million as the market moves from USD 10,117.0 Million to USD 15,503.2 Million. Nearly 60% of the decade’s absolute growth is concentrated in this period, underscoring rapid uptake across Asia and digital-first retail formats. Rising consumer confidence in long-term efficacy, along with heightened investment in professional-grade formulations, is expected to reinforce both value creation and category maturity.

The market is projected to more than double in value between 2025 and 2035, highlighting an enduring consumer preference for clinically proven ingredients and innovation-led formulations. Minoxidil is expected to retain dominance, while follicle-stimulation functions will lead performance positioning. Asia, particularly China and India, is forecast to emerge as the fastest-growing region, supported by double-digit CAGR levels. A fragmented competitive landscape is anticipated, with top brands holding single-digit shares, thereby offering significant room for challenger brands and digital-first entrants to expand.

Why the Hair Growth Serums Market is growing?

Growth in the Hair Growth Serums Market is being driven by heightened awareness of hair health, rising prevalence of hair thinning, and increasing adoption of preventative care routines. Demand is being reinforced by clinically validated actives such as Minoxidil, which continue to establish credibility through proven efficacy. Expanding e-commerce access has been enabling broader consumer reach, while pharmacies and professional clinics are contributing to trust-based adoption.

Consumer preference has been shifting toward early intervention and long-term scalp care, ensuring repeat usage and higher lifetime value. Advancements in formulation science, including peptide-based blends and plant-derived actives, are expected to enhance appeal among wellness-oriented buyers. Strong growth has been projected across Asia, where double-digit CAGR rates are anticipated due to lifestyle changes, rising incomes, and greater willingness to invest in personal care. A fragmented competitive field has been allowing new entrants and digital-first brands to capture incremental share.

Segmental Analysis

The Hair Growth Serums Market has been segmented across active ingredients, functional benefits, and product types, reflecting the structural factors shaping adoption trends. Active ingredients highlight the scientific backbone of formulations, ranging from clinically proven compounds such as Minoxidil to emerging blends of peptides and botanicals. Functions emphasize the outcomes most sought after by consumers, including follicle stimulation, scalp nourishment, and anti-hair-loss benefits. Product types demonstrate the formats through which these solutions are delivered, with topical serums, sprays, ampoules, and leave-in tonics catering to varied preferences. Each segment has been contributing to distinct consumer behavior patterns, and their relative performance is expected to define the long-term trajectory of the market.
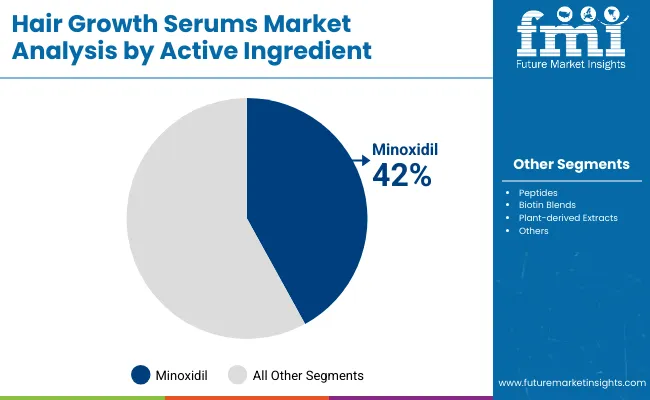
Insights into the Active Ingredient Segment with Minoxidil Leading in Market Share

Hair Growth Serums Market By Active Ingrediant

Active Ingredient Market Value Share, 2025
Minoxidil 42%
Others 58.0%

Minoxidil has been positioned as the cornerstone of the Hair Growth Serums Market, contributing 42.0% of revenue in 2025. Its dominance has been reinforced by long-standing clinical validation and consistent consumer trust in efficacy. Broader availability across regulated retail and digital channels has supported sustained adoption. While alternative blends such as peptides, biotin, and plant-derived extracts have been gaining traction, these have been complementing rather than displacing Minoxidil.

Over the forecast period, continuous product innovations and enhanced treatment adherence programs are expected to preserve Minoxidil’s strong market standing. Expansion of supportive evidence and inclusion in multi-functional formulations are anticipated to extend its relevance. Consequently, Minoxidil is expected to remain the anchor active in the competitive landscape of hair growth solutions.
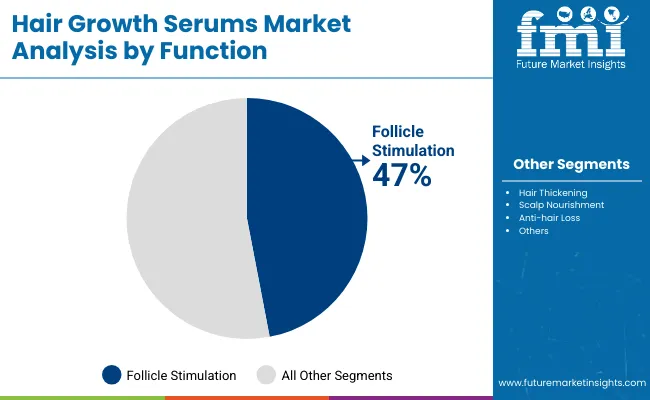
Insights into the Function Segment with Follicle Stimulation Driving Demand

Hair Growth Serums Market By Function

Function Market Value Share, 2025
Follicle stimulation 47%
Others 53.0%

Follicle stimulation has been identified as the primary functional focus, commanding 47.0% share in 2025. This leadership has been enabled by strong consumer preference for visible outcomes tied to growth initiation and density improvement. Scientific communication has emphasized the role of follicle activity in reversing early signs of thinning, thereby encouraging proactive usage.

Increasing reliance on targeted solutions that directly address root-level concerns has positioned follicle stimulation as a long-term growth catalyst. While scalp nourishment and anti-hair-loss features are contributing, they remain secondary to the performance-driven appeal of follicle activation. As clinical studies and product trials reinforce efficacy claims, the function of follicle stimulation is expected to expand further, shaping consumer loyalty and driving sustained market momentum.
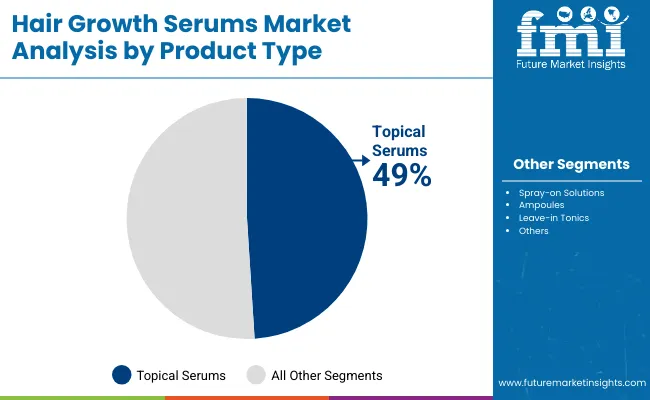
Insights into the Product Type Segment with Topical Serums Dominating Usage

Hair Growth Serums Market By Product

Product Type Market Value Share, 2025
Topical serums 49%
Others 51.0%

Topical serums have been projected to hold 49.0% share in 2025, reflecting their position as the most accessible and widely adopted format in the Hair Growth Serums Market. Ease of application, strong compliance rates, and direct-to-scalp delivery mechanisms have supported their dominance. These serums have been increasingly integrated into daily care routines, making them suitable for long-term treatment adherence.

In contrast, alternatives such as sprays, ampoules, and leave-in solutions have been appealing to niche users but have not displaced the consistent demand for serums. As personalization and subscription models expand online, topical serums are expected to retain leadership, supported by strong retail presence and innovation in multi-active formulations. Their role as the foundational product format is anticipated to remain intact over the forecast horizon.

What are the Drivers, Restraints, and Key Trends of the Hair Growth Serums Market?

Expanding innovation pipelines and diversified consumer habits have been reshaping the Hair Growth Serums Market, yet barriers linked to efficacy skepticism and compliance hurdles continue to challenge long-term adoption. Opportunities and risks are being shaped simultaneously by shifting clinical evidence and digital retail ecosystems.

Integration of Clinical Validation with Consumer Accessibility

Market acceleration has been supported by the alignment of clinical-grade formulations with mass-market accessibility. Robust clinical data has been integrated into consumer messaging, enabling credibility across diverse demographics. Pharmaceutical-grade actives such as Minoxidil have been positioned not only as treatment solutions but also as lifestyle maintenance tools. This repositioning has allowed adherence to improve while expanding consumer willingness to engage in subscription-based regimens. Partnerships with telehealth platforms have been amplifying this effect, as prescriptions and follow-ups have been streamlined into digital journeys. The blending of rigorous efficacy standards with accessible formats has been reinforcing trust, thereby shaping durable consumer retention in the coming decade.

Adherence Fatigue and Treatment Discontinuation

Sustained compliance has been hindered by treatment fatigue, as long application cycles and delayed visible results have been associated with high discontinuation rates. Even clinically effective regimens have been affected by inconsistent user commitment, limiting the overall lifetime value of consumers. Digital adherence tools and mobile app integrations have been piloted, yet their adoption has not fully offset consumer impatience with extended treatment horizons. As convenience and instant gratification dominate personal care habits, adherence fatigue remains a central bottleneck. Unless resolved through innovation in delivery mechanisms or accelerated efficacy, this restraint is expected to temper growth potential despite a robust demand base.
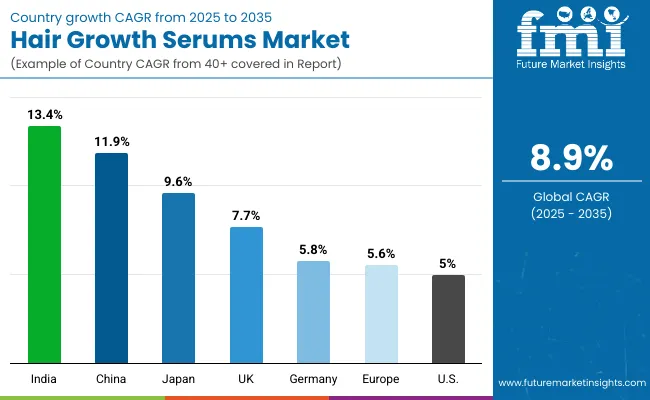
Analysis of Hair Growth Serums Market By Key Countries

Hair Growth Serums Market By Country

Countries CAGR
China 11.9%
USA 5.0%
India 13.4%
UK 7.7%
Germany 5.8%
Japan 9.6%

Adoption of hair growth serums has been unfolding unevenly across leading economies, with structural factors such as demographic shifts, healthcare accessibility, and evolving beauty standards shaping country-specific trajectories. Asia has been positioned as the strongest growth hub, with India projected at a 13.4% CAGR and China closely following at 11.9%. These outlooks have been reinforced by rising disposable incomes, rapid urbanization, and a cultural shift toward preventative self-care. Increasing male grooming adoption and the broadening of female consumer categories have also been amplifying market depth in both countries. Japan is expected to record a 9.6% CAGR, supported by an aging population investing in advanced scalp and follicle-care solutions.

In contrast, Europe reflects steady but moderate expansion, with the UK projected at 7.7% and Germany at 5.8%. Growth has been sustained by high awareness levels and robust distribution networks, although saturation in certain consumer groups has limited acceleration. The USA is anticipated to expand at a more modest 5.0% CAGR, reflecting maturity in early-adopter categories and slower onboarding of new users. Despite this, digital-first retail strategies and personalized regimens are expected to maintain growth momentum. Overall, emerging Asia is forecast to shape the global market’s most dynamic demand curve.
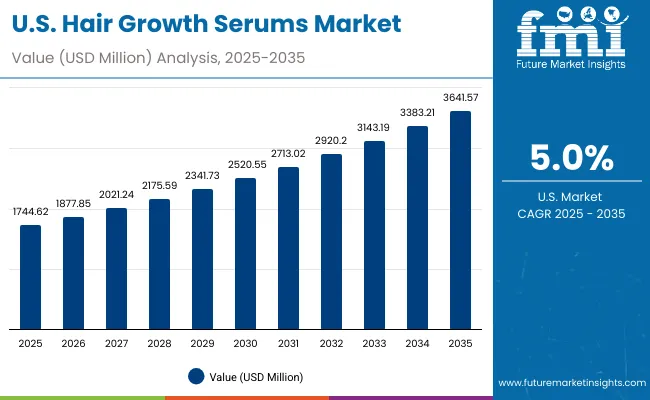
Sales Outlook for Hair Growth Serums in the United States

Hair Growth Serums Market Usa

Year USA Hair Growth Serums Market (USD Million)
2025 1744.62
2026 1877.85
2027 2021.24
2028 2175.59
2029 2341.73
2030 2520.55
2031 2713.02
2032 2920.20
2033 3143.19
2034 3383.21
2035 3641.57

The Hair Growth Serums Market in the United States is projected to grow at a CAGR of 7.7%, advancing from USD 1,744.62 Million in 2025 to USD 3,641.57 Million by 2035. Expansion is expected to be enabled by stronger consumer adoption of preventative hair health solutions and increasing penetration of clinically validated actives. Pharmacies and drugstores are projected to retain a significant role, while e-commerce growth is anticipated to accelerate through subscription services and integration with tele-dermatology platforms.

Innovation in topical formulations and wider acceptance of Minoxidil as a trusted active are expected to sustain demand momentum. At the same time, premium positioning of peptide- and plant-based blends is forecast to broaden appeal among wellness-focused segments. Competitive intensity is projected to increase as direct-to-consumer models reshape distribution and adherence tools improve long-term engagement.

  • Pharmacies and drugstores are expected to anchor baseline demand across mainstream consumers.
  • E-commerce subscriptions and telehealth integrations are projected to reinforce repeat usage and customer loyalty.
  • Premium formulations with multi-active blends are anticipated to expand adoption among wellness-oriented buyers.

Growth and Expansion Outlook for Hair Growth Serums Market in the United Kingdom

The Hair Growth Serums Market in the UK is projected to expand at a CAGR of 7.7% between 2025 and 2035. Growth is expected to be supported by rising awareness of early-stage hair thinning among younger demographics and increased investment in specialized scalp-care solutions. Pharmacies are forecast to remain vital as trusted retail touchpoints, while digital channels are expected to accelerate adoption through subscription-based delivery models. Minoxidil-led offerings are anticipated to hold a strong share, but wellness-focused blends featuring natural and peptide-based actives are likely to broaden the appeal among holistic health consumers.

  • Pharmacies are projected to serve as the most influential distribution channel.
  • Subscription models are expected to drive adherence and repeat purchases.
  • Minoxidil will anchor efficacy-led demand, while natural blends are anticipated to rise.

Growth and Expansion Outlook for Hair Growth Serums Market in India

The Hair Growth Serums Market in India is anticipated to record the highest growth among key countries, expanding at a CAGR of 13.4% from 2025 to 2035. Market acceleration is expected to be fueled by a young consumer base, rapid urbanization, and increased prioritization of grooming routines. E-commerce penetration is forecast to deliver significant growth, enabling access to both premium and mass-market formulations. Clinically proven actives such as Minoxidil are anticipated to drive baseline demand, while herbal and plant-derived blends are projected to resonate strongly with local preferences for natural remedies.

  • India is expected to post the fastest CAGR at 13.4%.
  • E-commerce platforms are anticipated to dominate adoption and accessibility.
  • Natural formulations are projected to expand demand among wellness-driven buyers.
  • Urban youth adoption will be a critical growth driver.

Sales Outlook for Hair Growth Serums in China

The Hair Growth Serums Market in China is projected to grow at a CAGR of 11.9% between 2025 and 2035. Rapid adoption is expected to be enabled by rising disposable incomes, a strong focus on appearance, and increasing acceptance of medical-grade actives. Pharmacies are forecast to remain influential in establishing trust, while cross-border e-commerce platforms are projected to strengthen access to international brands. Minoxidil is anticipated to dominate share, while fast innovation cycles in peptide- and herbal-based blends are expected to diversify choices for consumers seeking differentiated solutions.
  • CAGR of 11.9% places China among the fastest-growing markets.
  • Cross-border e-commerce is anticipated to boost international brand penetration.
  • Minoxidil will remain dominant, but peptide-based and herbal options are expected to grow.
  • Rising incomes and urban lifestyles are projected to sustain market expansion.

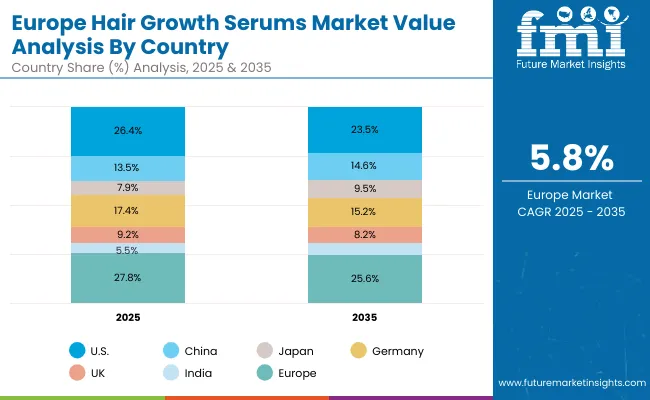
In-depth Analysis of Hair Growth Serums in Germany

Hair Growth Serums Market Europe

Countries 2025
USA 26.4%
China 13.5%
Japan 7.9%
Germany 17.4%
UK 9.2%
India 5.5%
Countries 2035
USA 23.5%
China 14.6%
Japan 9.5%
Germany 15.2%
UK 8.2%
India 6.7%

The Hair Growth Serums Market in Germany is forecast to expand at a CAGR of 5.8% during 2025-2035. Growth is anticipated to remain steady, supported by strong consumer awareness and widespread availability of premium brands across pharmacies. A mature market profile suggests incremental growth will be driven by product innovation, particularly in formulations combining Minoxidil with advanced peptides or botanical blends. Online platforms are expected to strengthen consumer engagement, while offline channels will maintain credibility in clinical and dermatology-driven adoption.
  • CAGR of 5.8% signals steady but slower expansion relative to Asia.
  • Pharmacies will remain critical for trust and product positioning.
  • Product innovations with combined actives are expected to drive incremental growth.
  • Online channels are projected to reinforce engagement with younger demographics.

Growth Outlook for Hair Growth Serums Market in USA

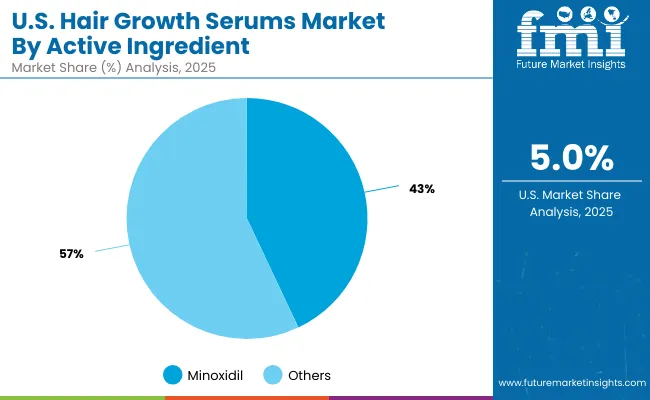
Hair Growth Serums Market Usa 2

USA By Active Ingredient Market Value Share, 2025
Minoxidil 43%
Others 57.0%

The Hair Growth Serums Market in the USA is projected at USD 1,744.62 Million in 2025. Minoxidil contributes 43.0% (USD 750.19 Million), while other ingredients account for 57.0% (USD 994.43 Million), underscoring a slight dominance of diversified blends over a single active compound. This balance reflects the expanding consumer demand for wellness-driven, multi-functional formulations that combine efficacy with natural positioning.

Although Minoxidil remains a clinically validated gold standard, the appeal of biotin-based, peptide-enhanced, and plant-derived alternatives is being amplified by lifestyle preferences and growing trust in holistic health solutions. Increased research focus on next-generation actives is expected to accelerate this trend, with consumer adoption being shaped by evidence-driven marketing. As personalization advances, complementary actives are anticipated to move toward parity with Minoxidil, creating a diversified market portfolio.
  • The USA market value in 2025 is USD 1,744.62 Million.
  • Minoxidil holds 43.0% share, while other blends dominate with 57.0%.
  • Diversified formulations are expected to drive incremental adoption.
  • Growth will be reinforced by demand for natural and peptide-enhanced actives.

Opportunity Analysis of China Hair Growth Serums Market

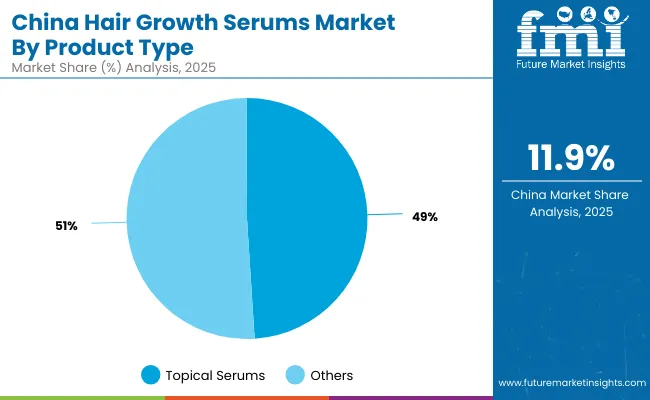
Hair Growth Serums Market China

China By product type Market Value Share, 2025
Topical serums 49%
Others 51.0%

The Hair Growth Serums Market in China is projected at USD 891.70 Million in 2025. Topical serums contribute 49.0% (USD 436.93 Million), while other product formats hold a slightly higher share at 51.0% (USD 454.76 Million). This near-parity highlights the evolving diversity of consumer preferences, where traditional serum formats are being complemented by sprays, ampoules, and leave-in tonics. Trust in topical serums remains strong due to direct-to-scalp application and proven adherence, yet growing experimentation with alternative delivery systems is reshaping product adoption.

Expansion of cross-border e-commerce has been amplifying access to innovative global formulations, further boosting the role of emerging product types. As personalization and convenience become central to consumer choices, the balance between serums and alternative formats is expected to remain competitive, driving continued innovation in formulation and application technologies.
  • China market value in 2025 is USD 891.70 Million.
  • Topical serums account for 49.0%, while other formats hold 51.0%.
  • Alternative delivery systems are expected to gain incremental traction.
  • Cross-border e-commerce is anticipated to expand access to global innovations.

Competitive Landscape of Hair Growth Serums Market

Hair Growth Serums Market By Company

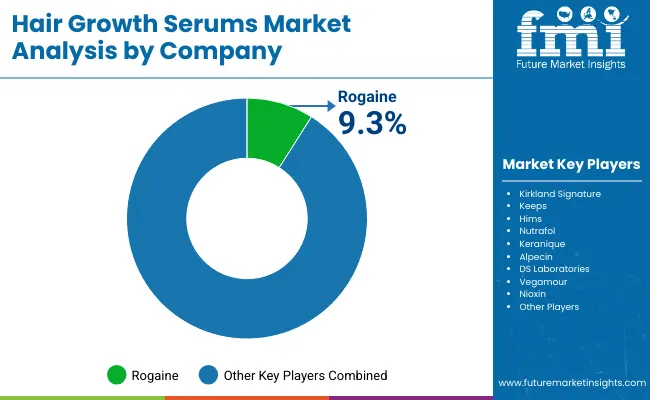
The Hair Growth Serums Market is moderately fragmented, with a mix of global leaders, specialized wellness brands, and emerging digital-first challengers competing across varied consumer segments. Rogaine has been identified as the dominant global player, holding a 9.3% value share in 2025, while all other competitors collectively account for 90.7%. Its leadership has been sustained through clinical credibility, strong brand recall, and extensive pharmacy distribution.

Established players such as Kirkland Signature, Keeps, Hims, Nutrafol, Keranique, and Alpecin have been expanding their reach, leveraging both direct-to-consumer models and e-commerce subscription platforms. These companies have been emphasizing innovation in multi-active formulations, consumer education, and long-term adherence tools, positioning themselves strongly among younger demographics and women consumers.

Niche specialists such as DS Laboratories, Vegamour, and Nioxin have been differentiating through plant-based formulations, scalp-focused wellness routines, and professional salon partnerships. Their strengths lie in premium positioning, clean-label narratives, and targeted marketing strategies that resonate with health-conscious consumers.

Competitive differentiation is expected to shift further toward ecosystem strength, with subscription-driven regimens, digital adherence tools, and tele-dermatology integrations reinforcing loyalty. As clinical validation and personalization become critical, competitive advantage will be shaped less by ingredient exclusivity and more by consumer engagement, data-driven outcomes, and credibility of evidence-based results.

Key Developments in Hair Growth Serums Market

  • In March 2025, a research team at UCLA unveiled a novel molecule, PP405, which has been shown in early trials to reactivate dormant hair follicles potentially reversing hair loss. Commercialization is being targeted, with regulatory approval and market launch expected between 2027 and 2030.
  • On August 7, 2025, the USA Consumer Product Safety Commission ordered a recall of the Sefralls Minoxidil Hair Generation Serum over non-compliant, non-child-resistant packaging, due to the risk of poisoning in children and pets. Approximately 21,300 units were affected.

Scope of the Report

Item Value
Quantitative Units USD 6,602.1 Million (2025) → USD 15,503.2 Million (2035)
Active Ingredient Minoxidil, Peptides, Biotin blends, Plant-derived extracts (ginseng, saw palmetto)
Function Follicle stimulation, Hair thickening, Scalp nourishment, Anti-hair loss
Product Type Topical serums, Spray-on solutions, Ampoules, Leave-in tonics
Distribution Channel Pharmacies & drugstores, E-commerce, Salons & clinics, Mass retail
End User Men, Women, Aging consumers
Regions Covered North America, Europe, East Asia, South Asia & Pacific, Latin America, Middle East & Africa
Countries Covered United States, Canada, Germany, United Kingdom, France, China, Japan, India, Brazil, South Africa
Key Companies Profiled Rogaine, Kirkland Signature, Keeps, Hims, Nutrafol, Keranique, Alpecin, DS Laboratories, Vegamour, Nioxin
Additional Attributes Dollar sales by active ingredient and function, adoption of clinically validated formulations, growing e-commerce subscriptions, rising demand for plant-based and peptide-enhanced blends, digital adherence tools, subscription-driven regimens, expansion in Asia with high CAGR, and integration of tele-dermatology platforms with product adoption.

Key Segments

By Active Ingredient:

  • Minoxidil
  • Peptides
  • Biotin blends
  • Plant-derived extracts (ginseng, saw palmetto)

By Function:

  • Follicle stimulation
  • Hair thickening
  • Scalp nourishment
  • Anti-hair loss

By Product Type:

  • Topical serums
  • Spray-on solutions
  • Ampoules
  • Leave-in tonics

By Channel:

  • Pharmacies/drugstores
  • E-commerce
  • Salons & clinics
  • Mass retail

By End User:

  • Men
  • Women
  • Aging consumers

By Region:

  • North America
  • Latin America
  • Europe
  • East Asia
  • South Asia & Pacific
  • Middle East and Africa

Table of Content

  1. Executive Summary
    • Global Market Outlook
    • Demand-side Trends
    • Supply-side Trends
    • Technology Roadmap Analysis
    • Analysis and Recommendations
  2. Market Overview
    • Market Coverage / Taxonomy
    • Market Definition / Scope / Limitations
  3. Market Background
    • Market Dynamics
      • Drivers
      • Restraints
      • Opportunity
      • Trends
    • Scenario Forecast
      • Demand in Optimistic Scenario
      • Demand in Likely Scenario
      • Demand in Conservative Scenario
    • Opportunity Map Analysis
    • Product Life Cycle Analysis
    • Supply Chain Analysis
      • Supply Side Participants and their Roles
        • Producers
        • Mid-Level Participants (Traders/ Agents/ Brokers)
        • Wholesalers and Distributors
      • Value Added and Value Created at Node in the Supply Chain
      • List of Raw Material Suppliers
      • List of Existing and Potential Buyer’s
    • Investment Feasibility Matrix
    • Value Chain Analysis
      • Profit Margin Analysis
      • Wholesalers and Distributors
      • Retailers
    • PESTLE and Porter’s Analysis
    • Regulatory Landscape
      • By Key Regions
      • By Key Countries
    • Regional Parent Market Outlook
    • Production and Consumption Statistics
    • Import and Export Statistics
  4. Global Market Analysis 2020-2024 and Forecast, 2025-2035
    • Historical Market Size Value (USD Million) & Volume (Units) Analysis, 2020-2024
    • Current and Future Market Size Value (USD Million) & Volume (Units) Projections, 2025-2035
      • Y-o-Y Growth Trend Analysis
      • Absolute $ Opportunity Analysis
  5. Global Market Analysis 2020-2024 and Forecast 2025-2035, By Active Ingredient
    • Introduction / Key Findings
    • Historical Market Size Value (USD Million) & Volume (Units) Analysis By Active Ingredient, 2020-2024
    • Current and Future Market Size Value (USD Million) & Volume (Units) Analysis and Forecast By Active Ingredient, 2025-2035
      • Minoxidil
      • Peptides
      • Biotin blends
      • Plant-derived extracts (ginseng, saw palmetto)
    • Y-o-Y Growth Trend Analysis By Active Ingredient, 2020-2024
    • Absolute $ Opportunity Analysis By Active Ingredient, 2025-2035
  6. Global Market Analysis 2020-2024 and Forecast 2025-2035, By Function
    • Introduction / Key Findings
    • Historical Market Size Value (USD Million) & Volume (Units) Analysis By Function, 2020-2024
    • Current and Future Market Size Value (USD Million) & Volume (Units) Analysis and Forecast By Function, 2025-2035
      • Follicle stimulation
      • Hair thickening
      • Scalp nourishment
      • Anti-hair loss
    • Y-o-Y Growth Trend Analysis By Function, 2020-2024
    • Absolute $ Opportunity Analysis By Function, 2025-2035
  7. Global Market Analysis 2020-2024 and Forecast 2025-2035, By Product Type
    • Introduction / Key Findings
    • Historical Market Size Value (USD Million) & Volume (Units) Analysis By Product Type, 2020-2024
    • Current and Future Market Size Value (USD Million) & Volume (Units) Analysis and Forecast By Product Type, 2025-2035
      • Topical serums
      • Spray-on solutions
      • Ampoules
      • Leave-in tonics
    • Y-o-Y Growth Trend Analysis By Product Type, 2020-2024
    • Absolute $ Opportunity Analysis By Product Type, 2025-2035
  8. Global Market Analysis 2020-2024 and Forecast 2025-2035, By Channel
    • Introduction / Key Findings
    • Historical Market Size Value (USD Million) & Volume (Units) Analysis By Channel, 2020-2024
    • Current and Future Market Size Value (USD Million) & Volume (Units) Analysis and Forecast By Channel, 2025-2035
      • Pharmacies/drugstores
      • E-commerce
      • Salons & clinics
      • Mass retail
    • Y-o-Y Growth Trend Analysis By Channel, 2020-2024
    • Absolute $ Opportunity Analysis By Channel, 2025-2035
  9. Global Market Analysis 2020-2024 and Forecast 2025-2035, By End User
    • Introduction / Key Findings
    • Historical Market Size Value (USD Million) & Volume (Units) Analysis By End User, 2020-2024
    • Current and Future Market Size Value (USD Million) & Volume (Units) Analysis and Forecast By End User, 2025-2035
      • Men
      • Women
      • Aging consumers
    • Y-o-Y Growth Trend Analysis By End User, 2020-2024
    • Absolute $ Opportunity Analysis By End User, 2025-2035
  10. Global Market Analysis 2020-2024 and Forecast 2025-2035, By Region
    • Introduction
    • Historical Market Size Value (USD Million) & Volume (Units) Analysis By Region, 2020-2024
    • Current Market Size Value (USD Million) & Volume (Units) Analysis and Forecast By Region, 2025-2035
      • North America
      • Latin America
      • Europe
      • East Asia
      • South Asia & Pacific
      • Middle East and Africa
    • Market Attractiveness Analysis By Region
  11. North America Market Analysis 2020-2024 and Forecast 2025-2035, By Country
    • Historical Market Size Value (USD Million) & Volume (Units) Trend Analysis By Market Taxonomy, 2020-2024
    • Market Size Value (USD Million) & Volume (Units) Forecast By Market Taxonomy, 2025-2035
      • By Country
        • USA
        • Canada
      • By Active Ingredient
      • By Function
      • By Product Type
      • By Channel
      • By End User
    • Market Attractiveness Analysis
      • By Country
      • By Active Ingredient
      • By Function
      • By Product Type
      • By Channel
      • By End User
    • Key Takeaways
  12. Latin America Market Analysis 2020-2024 and Forecast 2025-2035, By Country
    • Historical Market Size Value (USD Million) & Volume (Units) Trend Analysis By Market Taxonomy, 2020-2024
    • Market Size Value (USD Million) & Volume (Units) Forecast By Market Taxonomy, 2025-2035
      • By Country
        • Brazil
        • Mexico
        • Colombia
        • Rest of Latin America
      • By Active Ingredient
      • By Function
      • By Product Type
      • By Channel
      • By End User
    • Market Attractiveness Analysis
      • By Country
      • By Active Ingredient
      • By Function
      • By Product Type
      • By Channel
      • By End User
    • Key Takeaways
  13. Europe Market Analysis 2020-2024 and Forecast 2025-2035, By Country
    • Historical Market Size Value (USD Million) & Volume (Units) Trend Analysis By Market Taxonomy, 2020-2024
    • Market Size Value (USD Million) & Volume (Units) Forecast By Market Taxonomy, 2025-2035
      • By Country
        • Germany
        • UK
        • France
        • Italy
        • Spain
        • Belgium
        • Netherlands
        • Nordic
        • Switzerland
        • Russia
        • Poland
        • Rest of Europe
      • By Active Ingredient
      • By Function
      • By Product Type
      • By Channel
      • By End User
    • Market Attractiveness Analysis
      • By Country
      • By Active Ingredient
      • By Function
      • By Product Type
      • By Channel
      • By End User
    • Key Takeaways
  14. East Asia Market Analysis 2020-2024 and Forecast 2025-2035, By Country
    • Historical Market Size Value (USD Million) & Volume (Units) Trend Analysis By Market Taxonomy, 2020-2024
    • Market Size Value (USD Million) & Volume (Units) Forecast By Market Taxonomy, 2025-2035
      • By Country
        • China
        • Japan
        • South Korea
      • By Active Ingredient
      • By Function
      • By Product Type
      • By Channel
      • By End User
    • Market Attractiveness Analysis
      • By Country
      • By Active Ingredient
      • By Function
      • By Product Type
      • By Channel
      • By End User
    • Key Takeaways
  15. South Asia & Pacific Market Analysis 2020-2024 and Forecast 2025-2035, By Country
    • Historical Market Size Value (USD Million) & Volume (Units) Trend Analysis By Market Taxonomy, 2020-2024
    • Market Size Value (USD Million) & Volume (Units) Forecast By Market Taxonomy, 2025-2035
      • By Country
        • India
        • Thailand
        • Malaysia
        • Indonesia
        • Singapore
        • Vietnam
        • Australia
        • New Zealand
        • Rest of South Asia
      • By Active Ingredient
      • By Function
      • By Product Type
      • By Channel
      • By End User
    • Market Attractiveness Analysis
      • By Country
      • By Active Ingredient
      • By Function
      • By Product Type
      • By Channel
      • By End User
    • Key Takeaways
  16. Middle East and Africa Market Analysis 2020-2024 and Forecast 2025-2035, By Country
    • Historical Market Size Value (USD Million) & Volume (Units) Trend Analysis By Market Taxonomy, 2020-2024
    • Market Size Value (USD Million) & Volume (Units) Forecast By Market Taxonomy, 2025-2035
      • By Country
        • Turkey
        • UAE
        • Saudi Arabia
        • Israel
        • Other GCC Countries
        • North Africa
        • South Africa
      • By Active Ingredient
      • By Function
      • By Product Type
      • By Channel
      • By End User
    • Market Attractiveness Analysis
      • By Country
      • By Active Ingredient
      • By Function
      • By Product Type
      • By Channel
      • By End User
    • Key Takeaways
  17. Key Countries Market Analysis
    • USA
      • Pricing Analysis
      • Market Share Analysis, 2024
        • By Active Ingredient
        • By Function
        • By Product Type
        • By Channel
        • By End User
    • Canada
      • Pricing Analysis
      • Market Share Analysis, 2024
        • By Active Ingredient
        • By Function
        • By Product Type
        • By Channel
        • By End User
    • Brazil
      • Pricing Analysis
      • Market Share Analysis, 2024
        • By Active Ingredient
        • By Function
        • By Product Type
        • By Channel
        • By End User
    • Mexico
      • Pricing Analysis
      • Market Share Analysis, 2024
        • By Active Ingredient
        • By Function
        • By Product Type
        • By Channel
        • By End User
    • Colombia
      • Pricing Analysis
      • Market Share Analysis, 2024
        • By Active Ingredient
        • By Function
        • By Product Type
        • By Channel
        • By End User
    • Germany
      • Pricing Analysis
      • Market Share Analysis, 2024
        • By Active Ingredient
        • By Function
        • By Product Type
        • By Channel
        • By End User
    • UK
      • Pricing Analysis
      • Market Share Analysis, 2024
        • By Active Ingredient
        • By Function
        • By Product Type
        • By Channel
        • By End User
    • France
      • Pricing Analysis
      • Market Share Analysis, 2024
        • By Active Ingredient
        • By Function
        • By Product Type
        • By Channel
        • By End User
    • Italy
      • Pricing Analysis
      • Market Share Analysis, 2024
        • By Active Ingredient
        • By Function
        • By Product Type
        • By Channel
        • By End User
    • Spain
      • Pricing Analysis
      • Market Share Analysis, 2024
        • By Active Ingredient
        • By Function
        • By Product Type
        • By Channel
        • By End User
    • Belgium
      • Pricing Analysis
      • Market Share Analysis, 2024
        • By Active Ingredient
        • By Function
        • By Product Type
        • By Channel
        • By End User
    • Netherlands
      • Pricing Analysis
      • Market Share Analysis, 2024
        • By Active Ingredient
        • By Function
        • By Product Type
        • By Channel
        • By End User
    • Nordic
      • Pricing Analysis
      • Market Share Analysis, 2024
        • By Active Ingredient
        • By Function
        • By Product Type
        • By Channel
        • By End User
    • Switzerland
      • Pricing Analysis
      • Market Share Analysis, 2024
        • By Active Ingredient
        • By Function
        • By Product Type
        • By Channel
        • By End User
    • Russia
      • Pricing Analysis
      • Market Share Analysis, 2024
        • By Active Ingredient
        • By Function
        • By Product Type
        • By Channel
        • By End User
    • Poland
      • Pricing Analysis
      • Market Share Analysis, 2024
        • By Active Ingredient
        • By Function
        • By Product Type
        • By Channel
        • By End User
    • China
      • Pricing Analysis
      • Market Share Analysis, 2024
        • By Active Ingredient
        • By Function
        • By Product Type
        • By Channel
        • By End User
    • Japan
      • Pricing Analysis
      • Market Share Analysis, 2024
        • By Active Ingredient
        • By Function
        • By Product Type
        • By Channel
        • By End User
    • South Korea
      • Pricing Analysis
      • Market Share Analysis, 2024
        • By Active Ingredient
        • By Function
        • By Product Type
        • By Channel
        • By End User
    • India
      • Pricing Analysis
      • Market Share Analysis, 2024
        • By Active Ingredient
        • By Function
        • By Product Type
        • By Channel
        • By End User
    • Thailand
      • Pricing Analysis
      • Market Share Analysis, 2024
        • By Active Ingredient
        • By Function
        • By Product Type
        • By Channel
        • By End User
    • Indonesia
      • Pricing Analysis
      • Market Share Analysis, 2024
        • By Active Ingredient
        • By Function
        • By Product Type
        • By Channel
        • By End User
    • Australia
      • Pricing Analysis
      • Market Share Analysis, 2024
        • By Active Ingredient
        • By Function
        • By Product Type
        • By Channel
        • By End User
    • New Zealand
      • Pricing Analysis
      • Market Share Analysis, 2024
        • By Active Ingredient
        • By Function
        • By Product Type
        • By Channel
        • By End User
    • Turkey
      • Pricing Analysis
      • Market Share Analysis, 2024
        • By Active Ingredient
        • By Function
        • By Product Type
        • By Channel
        • By End User
    • UAE
      • Pricing Analysis
      • Market Share Analysis, 2024
        • By Active Ingredient
        • By Function
        • By Product Type
        • By Channel
        • By End User
    • Saudi Arabia
      • Pricing Analysis
      • Market Share Analysis, 2024
        • By Active Ingredient
        • By Function
        • By Product Type
        • By Channel
        • By End User
    • Israel
      • Pricing Analysis
      • Market Share Analysis, 2024
        • By Active Ingredient
        • By Function
        • By Product Type
        • By Channel
        • By End User
    • North Africa
      • Pricing Analysis
      • Market Share Analysis, 2024
        • By Active Ingredient
        • By Function
        • By Product Type
        • By Channel
        • By End User
    • South Africa
      • Pricing Analysis
      • Market Share Analysis, 2024
        • By Active Ingredient
        • By Function
        • By Product Type
        • By Channel
        • By End User
  18. Market Structure Analysis
    • Competition Dashboard
    • Competition Benchmarking
    • Market Share Analysis of Top Players
      • By Regional
      • By Active Ingredient
      • By Function
      • By Product Type
      • By Channel
      • By End User
  19. Competition Analysis
    • Competition Deep Dive
      • Rogaine
        • Overview
        • Product Portfolio
        • Profitability by Market Segments (Product/Age /Sales Channel/Region)
        • Sales Footprint
        • Strategy Overview
          • Marketing Strategy
          • Product Strategy
          • Channel Strategy
      • Kirkland Signature
        • Overview
        • Product Portfolio
        • Profitability by Market Segments (Product/Age /Sales Channel/Region)
        • Sales Footprint
        • Strategy Overview
          • Marketing Strategy
          • Product Strategy
          • Channel Strategy
      • Keeps
        • Overview
        • Product Portfolio
        • Profitability by Market Segments (Product/Age /Sales Channel/Region)
        • Sales Footprint
        • Strategy Overview
          • Marketing Strategy
          • Product Strategy
          • Channel Strategy
      • Hims
        • Overview
        • Product Portfolio
        • Profitability by Market Segments (Product/Age /Sales Channel/Region)
        • Sales Footprint
        • Strategy Overview
          • Marketing Strategy
          • Product Strategy
          • Channel Strategy
      • Nutrafol
        • Overview
        • Product Portfolio
        • Profitability by Market Segments (Product/Age /Sales Channel/Region)
        • Sales Footprint
        • Strategy Overview
          • Marketing Strategy
          • Product Strategy
          • Channel Strategy
      • Keranique
        • Overview
        • Product Portfolio
        • Profitability by Market Segments (Product/Age /Sales Channel/Region)
        • Sales Footprint
        • Strategy Overview
          • Marketing Strategy
          • Product Strategy
          • Channel Strategy
      • Alpecin
        • Overview
        • Product Portfolio
        • Profitability by Market Segments (Product/Age /Sales Channel/Region)
        • Sales Footprint
        • Strategy Overview
          • Marketing Strategy
          • Product Strategy
          • Channel Strategy
      • DS Laboratories
        • Overview
        • Product Portfolio
        • Profitability by Market Segments (Product/Age /Sales Channel/Region)
        • Sales Footprint
        • Strategy Overview
          • Marketing Strategy
          • Product Strategy
          • Channel Strategy
      • Vegamour
        • Overview
        • Product Portfolio
        • Profitability by Market Segments (Product/Age /Sales Channel/Region)
        • Sales Footprint
        • Strategy Overview
          • Marketing Strategy
          • Product Strategy
          • Channel Strategy
      • Nioxin
        • Overview
        • Product Portfolio
        • Profitability by Market Segments (Product/Age /Sales Channel/Region)
        • Sales Footprint
        • Strategy Overview
          • Marketing Strategy
          • Product Strategy
          • Channel Strategy
      • Others
        • Overview
        • Product Portfolio
        • Profitability by Market Segments (Product/Age /Sales Channel/Region)
        • Sales Footprint
        • Strategy Overview
          • Marketing Strategy
          • Product Strategy
          • Channel Strategy
  20. Assumptions & Acronyms Used
  21. Research Methodology

List of Tables

  • Table 1: Global Market Value (USD Million) Forecast by Region, 2020-2035
  • Table 2: Global Market Volume (Units) Forecast by Region, 2020-2035
  • Table 3: Global Market Value (USD Million) Forecast by Active Ingredient, 2020-2035
  • Table 4: Global Market Volume (Units) Forecast by Active Ingredient, 2020-2035
  • Table 5: Global Market Value (USD Million) Forecast by Function, 2020-2035
  • Table 6: Global Market Volume (Units) Forecast by Function, 2020-2035
  • Table 7: Global Market Value (USD Million) Forecast by Product Type, 2020-2035
  • Table 8: Global Market Volume (Units) Forecast by Product Type, 2020-2035
  • Table 9: Global Market Value (USD Million) Forecast by Channel, 2020-2035
  • Table 10: Global Market Volume (Units) Forecast by Channel, 2020-2035
  • Table 11: Global Market Value (USD Million) Forecast by End User, 2020-2035
  • Table 12: Global Market Volume (Units) Forecast by End User, 2020-2035
  • Table 13: North America Market Value (USD Million) Forecast by Country, 2020-2035
  • Table 14: North America Market Volume (Units) Forecast by Country, 2020-2035
  • Table 15: North America Market Value (USD Million) Forecast by Active Ingredient, 2020-2035
  • Table 16: North America Market Volume (Units) Forecast by Active Ingredient, 2020-2035
  • Table 17: North America Market Value (USD Million) Forecast by Function, 2020-2035
  • Table 18: North America Market Volume (Units) Forecast by Function, 2020-2035
  • Table 19: North America Market Value (USD Million) Forecast by Product Type, 2020-2035
  • Table 20: North America Market Volume (Units) Forecast by Product Type, 2020-2035
  • Table 21: North America Market Value (USD Million) Forecast by Channel, 2020-2035
  • Table 22: North America Market Volume (Units) Forecast by Channel, 2020-2035
  • Table 23: North America Market Value (USD Million) Forecast by End User, 2020-2035
  • Table 24: North America Market Volume (Units) Forecast by End User, 2020-2035
  • Table 25: Latin America Market Value (USD Million) Forecast by Country, 2020-2035
  • Table 26: Latin America Market Volume (Units) Forecast by Country, 2020-2035
  • Table 27: Latin America Market Value (USD Million) Forecast by Active Ingredient, 2020-2035
  • Table 28: Latin America Market Volume (Units) Forecast by Active Ingredient, 2020-2035
  • Table 29: Latin America Market Value (USD Million) Forecast by Function, 2020-2035
  • Table 30: Latin America Market Volume (Units) Forecast by Function, 2020-2035
  • Table 31: Latin America Market Value (USD Million) Forecast by Product Type, 2020-2035
  • Table 32: Latin America Market Volume (Units) Forecast by Product Type, 2020-2035
  • Table 33: Latin America Market Value (USD Million) Forecast by Channel, 2020-2035
  • Table 34: Latin America Market Volume (Units) Forecast by Channel, 2020-2035
  • Table 35: Latin America Market Value (USD Million) Forecast by End User, 2020-2035
  • Table 36: Latin America Market Volume (Units) Forecast by End User, 2020-2035
  • Table 37: Europe Market Value (USD Million) Forecast by Country, 2020-2035
  • Table 38: Europe Market Volume (Units) Forecast by Country, 2020-2035
  • Table 39: Europe Market Value (USD Million) Forecast by Active Ingredient, 2020-2035
  • Table 40: Europe Market Volume (Units) Forecast by Active Ingredient, 2020-2035
  • Table 41: Europe Market Value (USD Million) Forecast by Function, 2020-2035
  • Table 42: Europe Market Volume (Units) Forecast by Function, 2020-2035
  • Table 43: Europe Market Value (USD Million) Forecast by Product Type, 2020-2035
  • Table 44: Europe Market Volume (Units) Forecast by Product Type, 2020-2035
  • Table 45: Europe Market Value (USD Million) Forecast by Channel, 2020-2035
  • Table 46: Europe Market Volume (Units) Forecast by Channel, 2020-2035
  • Table 47: Europe Market Value (USD Million) Forecast by End User, 2020-2035
  • Table 48: Europe Market Volume (Units) Forecast by End User, 2020-2035
  • Table 49: East Asia Market Value (USD Million) Forecast by Country, 2020-2035
  • Table 50: East Asia Market Volume (Units) Forecast by Country, 2020-2035
  • Table 51: East Asia Market Value (USD Million) Forecast by Active Ingredient, 2020-2035
  • Table 52: East Asia Market Volume (Units) Forecast by Active Ingredient, 2020-2035
  • Table 53: East Asia Market Value (USD Million) Forecast by Function, 2020-2035
  • Table 54: East Asia Market Volume (Units) Forecast by Function, 2020-2035
  • Table 55: East Asia Market Value (USD Million) Forecast by Product Type, 2020-2035
  • Table 56: East Asia Market Volume (Units) Forecast by Product Type, 2020-2035
  • Table 57: East Asia Market Value (USD Million) Forecast by Channel, 2020-2035
  • Table 58: East Asia Market Volume (Units) Forecast by Channel, 2020-2035
  • Table 59: East Asia Market Value (USD Million) Forecast by End User, 2020-2035
  • Table 60: East Asia Market Volume (Units) Forecast by End User, 2020-2035
  • Table 61: South Asia & Pacific Market Value (USD Million) Forecast by Country, 2020-2035
  • Table 62: South Asia & Pacific Market Volume (Units) Forecast by Country, 2020-2035
  • Table 63: South Asia & Pacific Market Value (USD Million) Forecast by Active Ingredient, 2020-2035
  • Table 64: South Asia & Pacific Market Volume (Units) Forecast by Active Ingredient, 2020-2035
  • Table 65: South Asia & Pacific Market Value (USD Million) Forecast by Function, 2020-2035
  • Table 66: South Asia & Pacific Market Volume (Units) Forecast by Function, 2020-2035
  • Table 67: South Asia & Pacific Market Value (USD Million) Forecast by Product Type, 2020-2035
  • Table 68: South Asia & Pacific Market Volume (Units) Forecast by Product Type, 2020-2035
  • Table 69: South Asia & Pacific Market Value (USD Million) Forecast by Channel, 2020-2035
  • Table 70: South Asia & Pacific Market Volume (Units) Forecast by Channel, 2020-2035
  • Table 71: South Asia & Pacific Market Value (USD Million) Forecast by End User, 2020-2035
  • Table 72: South Asia & Pacific Market Volume (Units) Forecast by End User, 2020-2035
  • Table 73: Middle East and Africa Market Value (USD Million) Forecast by Country, 2020-2035
  • Table 74: Middle East and Africa Market Volume (Units) Forecast by Country, 2020-2035
  • Table 75: Middle East and Africa Market Value (USD Million) Forecast by Active Ingredient, 2020-2035
  • Table 76: Middle East and Africa Market Volume (Units) Forecast by Active Ingredient, 2020-2035
  • Table 77: Middle East and Africa Market Value (USD Million) Forecast by Function, 2020-2035
  • Table 78: Middle East and Africa Market Volume (Units) Forecast by Function, 2020-2035
  • Table 79: Middle East and Africa Market Value (USD Million) Forecast by Product Type, 2020-2035
  • Table 80: Middle East and Africa Market Volume (Units) Forecast by Product Type, 2020-2035
  • Table 81: Middle East and Africa Market Value (USD Million) Forecast by Channel, 2020-2035
  • Table 82: Middle East and Africa Market Volume (Units) Forecast by Channel, 2020-2035
  • Table 83: Middle East and Africa Market Value (USD Million) Forecast by End User, 2020-2035
  • Table 84: Middle East and Africa Market Volume (Units) Forecast by End User, 2020-2035

List of Figures

  • Figure 1: Global Market Value (USD Million) by Active Ingredient, 2025-2035
  • Figure 2: Global Market Value (USD Million) by Function, 2025-2035
  • Figure 3: Global Market Value (USD Million) by Product Type, 2025-2035
  • Figure 4: Global Market Value (USD Million) by Channel, 2025-2035
  • Figure 5: Global Market Value (USD Million) by End User, 2025-2035
  • Figure 6: Global Market Value (USD Million) by Region, 2025-2035
  • Figure 7: Global Market Value (USD Million) Analysis by Region, 2020-2035
  • Figure 8: Global Market Volume (Units) Analysis by Region, 2020-2035
  • Figure 9: Global Market Value Share (%) and BPS Analysis by Region, 2025-2035
  • Figure 10: Global Market Y-o-Y Growth (%) Projections by Region, 2025-2035
  • Figure 11: Global Market Value (USD Million) Analysis by Active Ingredient, 2020-2035
  • Figure 12: Global Market Volume (Units) Analysis by Active Ingredient, 2020-2035
  • Figure 13: Global Market Value Share (%) and BPS Analysis by Active Ingredient, 2025-2035
  • Figure 14: Global Market Y-o-Y Growth (%) Projections by Active Ingredient, 2025-2035
  • Figure 15: Global Market Value (USD Million) Analysis by Function, 2020-2035
  • Figure 16: Global Market Volume (Units) Analysis by Function, 2020-2035
  • Figure 17: Global Market Value Share (%) and BPS Analysis by Function, 2025-2035
  • Figure 18: Global Market Y-o-Y Growth (%) Projections by Function, 2025-2035
  • Figure 19: Global Market Value (USD Million) Analysis by Product Type, 2020-2035
  • Figure 20: Global Market Volume (Units) Analysis by Product Type, 2020-2035
  • Figure 21: Global Market Value Share (%) and BPS Analysis by Product Type, 2025-2035
  • Figure 22: Global Market Y-o-Y Growth (%) Projections by Product Type, 2025-2035
  • Figure 23: Global Market Value (USD Million) Analysis by Channel, 2020-2035
  • Figure 24: Global Market Volume (Units) Analysis by Channel, 2020-2035
  • Figure 25: Global Market Value Share (%) and BPS Analysis by Channel, 2025-2035
  • Figure 26: Global Market Y-o-Y Growth (%) Projections by Channel, 2025-2035
  • Figure 27: Global Market Value (USD Million) Analysis by End User, 2020-2035
  • Figure 28: Global Market Volume (Units) Analysis by End User, 2020-2035
  • Figure 29: Global Market Value Share (%) and BPS Analysis by End User, 2025-2035
  • Figure 30: Global Market Y-o-Y Growth (%) Projections by End User, 2025-2035
  • Figure 31: Global Market Attractiveness by Active Ingredient, 2025-2035
  • Figure 32: Global Market Attractiveness by Function, 2025-2035
  • Figure 33: Global Market Attractiveness by Product Type, 2025-2035
  • Figure 34: Global Market Attractiveness by Channel, 2025-2035
  • Figure 35: Global Market Attractiveness by End User, 2025-2035
  • Figure 36: Global Market Attractiveness by Region, 2025-2035
  • Figure 37: North America Market Value (USD Million) by Active Ingredient, 2025-2035
  • Figure 38: North America Market Value (USD Million) by Function, 2025-2035
  • Figure 39: North America Market Value (USD Million) by Product Type, 2025-2035
  • Figure 40: North America Market Value (USD Million) by Channel, 2025-2035
  • Figure 41: North America Market Value (USD Million) by End User, 2025-2035
  • Figure 42: North America Market Value (USD Million) by Country, 2025-2035
  • Figure 43: North America Market Value (USD Million) Analysis by Country, 2020-2035
  • Figure 44: North America Market Volume (Units) Analysis by Country, 2020-2035
  • Figure 45: North America Market Value Share (%) and BPS Analysis by Country, 2025-2035
  • Figure 46: North America Market Y-o-Y Growth (%) Projections by Country, 2025-2035
  • Figure 47: North America Market Value (USD Million) Analysis by Active Ingredient, 2020-2035
  • Figure 48: North America Market Volume (Units) Analysis by Active Ingredient, 2020-2035
  • Figure 49: North America Market Value Share (%) and BPS Analysis by Active Ingredient, 2025-2035
  • Figure 50: North America Market Y-o-Y Growth (%) Projections by Active Ingredient, 2025-2035
  • Figure 51: North America Market Value (USD Million) Analysis by Function, 2020-2035
  • Figure 52: North America Market Volume (Units) Analysis by Function, 2020-2035
  • Figure 53: North America Market Value Share (%) and BPS Analysis by Function, 2025-2035
  • Figure 54: North America Market Y-o-Y Growth (%) Projections by Function, 2025-2035
  • Figure 55: North America Market Value (USD Million) Analysis by Product Type, 2020-2035
  • Figure 56: North America Market Volume (Units) Analysis by Product Type, 2020-2035
  • Figure 57: North America Market Value Share (%) and BPS Analysis by Product Type, 2025-2035
  • Figure 58: North America Market Y-o-Y Growth (%) Projections by Product Type, 2025-2035
  • Figure 59: North America Market Value (USD Million) Analysis by Channel, 2020-2035
  • Figure 60: North America Market Volume (Units) Analysis by Channel, 2020-2035
  • Figure 61: North America Market Value Share (%) and BPS Analysis by Channel, 2025-2035
  • Figure 62: North America Market Y-o-Y Growth (%) Projections by Channel, 2025-2035
  • Figure 63: North America Market Value (USD Million) Analysis by End User, 2020-2035
  • Figure 64: North America Market Volume (Units) Analysis by End User, 2020-2035
  • Figure 65: North America Market Value Share (%) and BPS Analysis by End User, 2025-2035
  • Figure 66: North America Market Y-o-Y Growth (%) Projections by End User, 2025-2035
  • Figure 67: North America Market Attractiveness by Active Ingredient, 2025-2035
  • Figure 68: North America Market Attractiveness by Function, 2025-2035
  • Figure 69: North America Market Attractiveness by Product Type, 2025-2035
  • Figure 70: North America Market Attractiveness by Channel, 2025-2035
  • Figure 71: North America Market Attractiveness by End User, 2025-2035
  • Figure 72: North America Market Attractiveness by Country, 2025-2035
  • Figure 73: Latin America Market Value (USD Million) by Active Ingredient, 2025-2035
  • Figure 74: Latin America Market Value (USD Million) by Function, 2025-2035
  • Figure 75: Latin America Market Value (USD Million) by Product Type, 2025-2035
  • Figure 76: Latin America Market Value (USD Million) by Channel, 2025-2035
  • Figure 77: Latin America Market Value (USD Million) by End User, 2025-2035
  • Figure 78: Latin America Market Value (USD Million) by Country, 2025-2035
  • Figure 79: Latin America Market Value (USD Million) Analysis by Country, 2020-2035
  • Figure 80: Latin America Market Volume (Units) Analysis by Country, 2020-2035
  • Figure 81: Latin America Market Value Share (%) and BPS Analysis by Country, 2025-2035
  • Figure 82: Latin America Market Y-o-Y Growth (%) Projections by Country, 2025-2035
  • Figure 83: Latin America Market Value (USD Million) Analysis by Active Ingredient, 2020-2035
  • Figure 84: Latin America Market Volume (Units) Analysis by Active Ingredient, 2020-2035
  • Figure 85: Latin America Market Value Share (%) and BPS Analysis by Active Ingredient, 2025-2035
  • Figure 86: Latin America Market Y-o-Y Growth (%) Projections by Active Ingredient, 2025-2035
  • Figure 87: Latin America Market Value (USD Million) Analysis by Function, 2020-2035
  • Figure 88: Latin America Market Volume (Units) Analysis by Function, 2020-2035
  • Figure 89: Latin America Market Value Share (%) and BPS Analysis by Function, 2025-2035
  • Figure 90: Latin America Market Y-o-Y Growth (%) Projections by Function, 2025-2035
  • Figure 91: Latin America Market Value (USD Million) Analysis by Product Type, 2020-2035
  • Figure 92: Latin America Market Volume (Units) Analysis by Product Type, 2020-2035
  • Figure 93: Latin America Market Value Share (%) and BPS Analysis by Product Type, 2025-2035
  • Figure 94: Latin America Market Y-o-Y Growth (%) Projections by Product Type, 2025-2035
  • Figure 95: Latin America Market Value (USD Million) Analysis by Channel, 2020-2035
  • Figure 96: Latin America Market Volume (Units) Analysis by Channel, 2020-2035
  • Figure 97: Latin America Market Value Share (%) and BPS Analysis by Channel, 2025-2035
  • Figure 98: Latin America Market Y-o-Y Growth (%) Projections by Channel, 2025-2035
  • Figure 99: Latin America Market Value (USD Million) Analysis by End User, 2020-2035
  • Figure 100: Latin America Market Volume (Units) Analysis by End User, 2020-2035
  • Figure 101: Latin America Market Value Share (%) and BPS Analysis by End User, 2025-2035
  • Figure 102: Latin America Market Y-o-Y Growth (%) Projections by End User, 2025-2035
  • Figure 103: Latin America Market Attractiveness by Active Ingredient, 2025-2035
  • Figure 104: Latin America Market Attractiveness by Function, 2025-2035
  • Figure 105: Latin America Market Attractiveness by Product Type, 2025-2035
  • Figure 106: Latin America Market Attractiveness by Channel, 2025-2035
  • Figure 107: Latin America Market Attractiveness by End User, 2025-2035
  • Figure 108: Latin America Market Attractiveness by Country, 2025-2035
  • Figure 109: Europe Market Value (USD Million) by Active Ingredient, 2025-2035
  • Figure 110: Europe Market Value (USD Million) by Function, 2025-2035
  • Figure 111: Europe Market Value (USD Million) by Product Type, 2025-2035
  • Figure 112: Europe Market Value (USD Million) by Channel, 2025-2035
  • Figure 113: Europe Market Value (USD Million) by End User, 2025-2035
  • Figure 114: Europe Market Value (USD Million) by Country, 2025-2035
  • Figure 115: Europe Market Value (USD Million) Analysis by Country, 2020-2035
  • Figure 116: Europe Market Volume (Units) Analysis by Country, 2020-2035
  • Figure 117: Europe Market Value Share (%) and BPS Analysis by Country, 2025-2035
  • Figure 118: Europe Market Y-o-Y Growth (%) Projections by Country, 2025-2035
  • Figure 119: Europe Market Value (USD Million) Analysis by Active Ingredient, 2020-2035
  • Figure 120: Europe Market Volume (Units) Analysis by Active Ingredient, 2020-2035
  • Figure 121: Europe Market Value Share (%) and BPS Analysis by Active Ingredient, 2025-2035
  • Figure 122: Europe Market Y-o-Y Growth (%) Projections by Active Ingredient, 2025-2035
  • Figure 123: Europe Market Value (USD Million) Analysis by Function, 2020-2035
  • Figure 124: Europe Market Volume (Units) Analysis by Function, 2020-2035
  • Figure 125: Europe Market Value Share (%) and BPS Analysis by Function, 2025-2035
  • Figure 126: Europe Market Y-o-Y Growth (%) Projections by Function, 2025-2035
  • Figure 127: Europe Market Value (USD Million) Analysis by Product Type, 2020-2035
  • Figure 128: Europe Market Volume (Units) Analysis by Product Type, 2020-2035
  • Figure 129: Europe Market Value Share (%) and BPS Analysis by Product Type, 2025-2035
  • Figure 130: Europe Market Y-o-Y Growth (%) Projections by Product Type, 2025-2035
  • Figure 131: Europe Market Value (USD Million) Analysis by Channel, 2020-2035
  • Figure 132: Europe Market Volume (Units) Analysis by Channel, 2020-2035
  • Figure 133: Europe Market Value Share (%) and BPS Analysis by Channel, 2025-2035
  • Figure 134: Europe Market Y-o-Y Growth (%) Projections by Channel, 2025-2035
  • Figure 135: Europe Market Value (USD Million) Analysis by End User, 2020-2035
  • Figure 136: Europe Market Volume (Units) Analysis by End User, 2020-2035
  • Figure 137: Europe Market Value Share (%) and BPS Analysis by End User, 2025-2035
  • Figure 138: Europe Market Y-o-Y Growth (%) Projections by End User, 2025-2035
  • Figure 139: Europe Market Attractiveness by Active Ingredient, 2025-2035
  • Figure 140: Europe Market Attractiveness by Function, 2025-2035
  • Figure 141: Europe Market Attractiveness by Product Type, 2025-2035
  • Figure 142: Europe Market Attractiveness by Channel, 2025-2035
  • Figure 143: Europe Market Attractiveness by End User, 2025-2035
  • Figure 144: Europe Market Attractiveness by Country, 2025-2035
  • Figure 145: East Asia Market Value (USD Million) by Active Ingredient, 2025-2035
  • Figure 146: East Asia Market Value (USD Million) by Function, 2025-2035
  • Figure 147: East Asia Market Value (USD Million) by Product Type, 2025-2035
  • Figure 148: East Asia Market Value (USD Million) by Channel, 2025-2035
  • Figure 149: East Asia Market Value (USD Million) by End User, 2025-2035
  • Figure 150: East Asia Market Value (USD Million) by Country, 2025-2035
  • Figure 151: East Asia Market Value (USD Million) Analysis by Country, 2020-2035
  • Figure 152: East Asia Market Volume (Units) Analysis by Country, 2020-2035
  • Figure 153: East Asia Market Value Share (%) and BPS Analysis by Country, 2025-2035
  • Figure 154: East Asia Market Y-o-Y Growth (%) Projections by Country, 2025-2035
  • Figure 155: East Asia Market Value (USD Million) Analysis by Active Ingredient, 2020-2035
  • Figure 156: East Asia Market Volume (Units) Analysis by Active Ingredient, 2020-2035
  • Figure 157: East Asia Market Value Share (%) and BPS Analysis by Active Ingredient, 2025-2035
  • Figure 158: East Asia Market Y-o-Y Growth (%) Projections by Active Ingredient, 2025-2035
  • Figure 159: East Asia Market Value (USD Million) Analysis by Function, 2020-2035
  • Figure 160: East Asia Market Volume (Units) Analysis by Function, 2020-2035
  • Figure 161: East Asia Market Value Share (%) and BPS Analysis by Function, 2025-2035
  • Figure 162: East Asia Market Y-o-Y Growth (%) Projections by Function, 2025-2035
  • Figure 163: East Asia Market Value (USD Million) Analysis by Product Type, 2020-2035
  • Figure 164: East Asia Market Volume (Units) Analysis by Product Type, 2020-2035
  • Figure 165: East Asia Market Value Share (%) and BPS Analysis by Product Type, 2025-2035
  • Figure 166: East Asia Market Y-o-Y Growth (%) Projections by Product Type, 2025-2035
  • Figure 167: East Asia Market Value (USD Million) Analysis by Channel, 2020-2035
  • Figure 168: East Asia Market Volume (Units) Analysis by Channel, 2020-2035
  • Figure 169: East Asia Market Value Share (%) and BPS Analysis by Channel, 2025-2035
  • Figure 170: East Asia Market Y-o-Y Growth (%) Projections by Channel, 2025-2035
  • Figure 171: East Asia Market Value (USD Million) Analysis by End User, 2020-2035
  • Figure 172: East Asia Market Volume (Units) Analysis by End User, 2020-2035
  • Figure 173: East Asia Market Value Share (%) and BPS Analysis by End User, 2025-2035
  • Figure 174: East Asia Market Y-o-Y Growth (%) Projections by End User, 2025-2035
  • Figure 175: East Asia Market Attractiveness by Active Ingredient, 2025-2035
  • Figure 176: East Asia Market Attractiveness by Function, 2025-2035
  • Figure 177: East Asia Market Attractiveness by Product Type, 2025-2035
  • Figure 178: East Asia Market Attractiveness by Channel, 2025-2035
  • Figure 179: East Asia Market Attractiveness by End User, 2025-2035
  • Figure 180: East Asia Market Attractiveness by Country, 2025-2035
  • Figure 181: South Asia & Pacific Market Value (USD Million) by Active Ingredient, 2025-2035
  • Figure 182: South Asia & Pacific Market Value (USD Million) by Function, 2025-2035
  • Figure 183: South Asia & Pacific Market Value (USD Million) by Product Type, 2025-2035
  • Figure 184: South Asia & Pacific Market Value (USD Million) by Channel, 2025-2035
  • Figure 185: South Asia & Pacific Market Value (USD Million) by End User, 2025-2035
  • Figure 186: South Asia & Pacific Market Value (USD Million) by Country, 2025-2035
  • Figure 187: South Asia & Pacific Market Value (USD Million) Analysis by Country, 2020-2035
  • Figure 188: South Asia & Pacific Market Volume (Units) Analysis by Country, 2020-2035
  • Figure 189: South Asia & Pacific Market Value Share (%) and BPS Analysis by Country, 2025-2035
  • Figure 190: South Asia & Pacific Market Y-o-Y Growth (%) Projections by Country, 2025-2035
  • Figure 191: South Asia & Pacific Market Value (USD Million) Analysis by Active Ingredient, 2020-2035
  • Figure 192: South Asia & Pacific Market Volume (Units) Analysis by Active Ingredient, 2020-2035
  • Figure 193: South Asia & Pacific Market Value Share (%) and BPS Analysis by Active Ingredient, 2025-2035
  • Figure 194: South Asia & Pacific Market Y-o-Y Growth (%) Projections by Active Ingredient, 2025-2035
  • Figure 195: South Asia & Pacific Market Value (USD Million) Analysis by Function, 2020-2035
  • Figure 196: South Asia & Pacific Market Volume (Units) Analysis by Function, 2020-2035
  • Figure 197: South Asia & Pacific Market Value Share (%) and BPS Analysis by Function, 2025-2035
  • Figure 198: South Asia & Pacific Market Y-o-Y Growth (%) Projections by Function, 2025-2035
  • Figure 199: South Asia & Pacific Market Value (USD Million) Analysis by Product Type, 2020-2035
  • Figure 200: South Asia & Pacific Market Volume (Units) Analysis by Product Type, 2020-2035
  • Figure 201: South Asia & Pacific Market Value Share (%) and BPS Analysis by Product Type, 2025-2035
  • Figure 202: South Asia & Pacific Market Y-o-Y Growth (%) Projections by Product Type, 2025-2035
  • Figure 203: South Asia & Pacific Market Value (USD Million) Analysis by Channel, 2020-2035
  • Figure 204: South Asia & Pacific Market Volume (Units) Analysis by Channel, 2020-2035
  • Figure 205: South Asia & Pacific Market Value Share (%) and BPS Analysis by Channel, 2025-2035
  • Figure 206: South Asia & Pacific Market Y-o-Y Growth (%) Projections by Channel, 2025-2035
  • Figure 207: South Asia & Pacific Market Value (USD Million) Analysis by End User, 2020-2035
  • Figure 208: South Asia & Pacific Market Volume (Units) Analysis by End User, 2020-2035
  • Figure 209: South Asia & Pacific Market Value Share (%) and BPS Analysis by End User, 2025-2035
  • Figure 210: South Asia & Pacific Market Y-o-Y Growth (%) Projections by End User, 2025-2035
  • Figure 211: South Asia & Pacific Market Attractiveness by Active Ingredient, 2025-2035
  • Figure 212: South Asia & Pacific Market Attractiveness by Function, 2025-2035
  • Figure 213: South Asia & Pacific Market Attractiveness by Product Type, 2025-2035
  • Figure 214: South Asia & Pacific Market Attractiveness by Channel, 2025-2035
  • Figure 215: South Asia & Pacific Market Attractiveness by End User, 2025-2035
  • Figure 216: South Asia & Pacific Market Attractiveness by Country, 2025-2035
  • Figure 217: Middle East and Africa Market Value (USD Million) by Active Ingredient, 2025-2035
  • Figure 218: Middle East and Africa Market Value (USD Million) by Function, 2025-2035
  • Figure 219: Middle East and Africa Market Value (USD Million) by Product Type, 2025-2035
  • Figure 220: Middle East and Africa Market Value (USD Million) by Channel, 2025-2035
  • Figure 221: Middle East and Africa Market Value (USD Million) by End User, 2025-2035
  • Figure 222: Middle East and Africa Market Value (USD Million) by Country, 2025-2035
  • Figure 223: Middle East and Africa Market Value (USD Million) Analysis by Country, 2020-2035
  • Figure 224: Middle East and Africa Market Volume (Units) Analysis by Country, 2020-2035
  • Figure 225: Middle East and Africa Market Value Share (%) and BPS Analysis by Country, 2025-2035
  • Figure 226: Middle East and Africa Market Y-o-Y Growth (%) Projections by Country, 2025-2035
  • Figure 227: Middle East and Africa Market Value (USD Million) Analysis by Active Ingredient, 2020-2035
  • Figure 228: Middle East and Africa Market Volume (Units) Analysis by Active Ingredient, 2020-2035
  • Figure 229: Middle East and Africa Market Value Share (%) and BPS Analysis by Active Ingredient, 2025-2035
  • Figure 230: Middle East and Africa Market Y-o-Y Growth (%) Projections by Active Ingredient, 2025-2035
  • Figure 231: Middle East and Africa Market Value (USD Million) Analysis by Function, 2020-2035
  • Figure 232: Middle East and Africa Market Volume (Units) Analysis by Function, 2020-2035
  • Figure 233: Middle East and Africa Market Value Share (%) and BPS Analysis by Function, 2025-2035
  • Figure 234: Middle East and Africa Market Y-o-Y Growth (%) Projections by Function, 2025-2035
  • Figure 235: Middle East and Africa Market Value (USD Million) Analysis by Product Type, 2020-2035
  • Figure 236: Middle East and Africa Market Volume (Units) Analysis by Product Type, 2020-2035
  • Figure 237: Middle East and Africa Market Value Share (%) and BPS Analysis by Product Type, 2025-2035
  • Figure 238: Middle East and Africa Market Y-o-Y Growth (%) Projections by Product Type, 2025-2035
  • Figure 239: Middle East and Africa Market Value (USD Million) Analysis by Channel, 2020-2035
  • Figure 240: Middle East and Africa Market Volume (Units) Analysis by Channel, 2020-2035
  • Figure 241: Middle East and Africa Market Value Share (%) and BPS Analysis by Channel, 2025-2035
  • Figure 242: Middle East and Africa Market Y-o-Y Growth (%) Projections by Channel, 2025-2035
  • Figure 243: Middle East and Africa Market Value (USD Million) Analysis by End User, 2020-2035
  • Figure 244: Middle East and Africa Market Volume (Units) Analysis by End User, 2020-2035
  • Figure 245: Middle East and Africa Market Value Share (%) and BPS Analysis by End User, 2025-2035
  • Figure 246: Middle East and Africa Market Y-o-Y Growth (%) Projections by End User, 2025-2035
  • Figure 247: Middle East and Africa Market Attractiveness by Active Ingredient, 2025-2035
  • Figure 248: Middle East and Africa Market Attractiveness by Function, 2025-2035
  • Figure 249: Middle East and Africa Market Attractiveness by Product Type, 2025-2035
  • Figure 250: Middle East and Africa Market Attractiveness by Channel, 2025-2035
  • Figure 251: Middle East and Africa Market Attractiveness by End User, 2025-2035
  • Figure 252: Middle East and Africa Market Attractiveness by Country, 2025-2035

Frequently Asked Questions

How big is the Hair Growth Serums Market in 2025?

The global Hair Growth Serums Market is estimated to be valued at USD 6,602.1 Million in 2025.

What will be the size of the Hair Growth Serums Market in 2035?

The market size for the Hair Growth Serums Market is projected to reach USD 15,503.2 Million by 2035.

How much will be the Hair Growth Serums Market growth between 2025 and 2035?

The Hair Growth Serums Market is expected to grow at a CAGR of 8.9% between 2025 and 2035.

What are the key product types in the Hair Growth Serums Market?

The key product types in the Hair Growth Serums Market are topical serums, spray-on solutions, ampoules, and leave-in tonics.

Which function segment will contribute significant share in the Hair Growth Serums Market in 2025?

In terms of function, the follicle stimulation segment is expected to command 47.0% share of the Hair Growth Serums Market in 2025.

Explore Similar Insights

Future Market Insights

Hair Growth Serums Market

Chat With

MaRIA

Hi There, I am MaRIA, Your Market Research Intelligence Assistant. How may I help you?