Hair Regrowth Treatments Market Size and Share Forecast Outlook 2025 to 2035

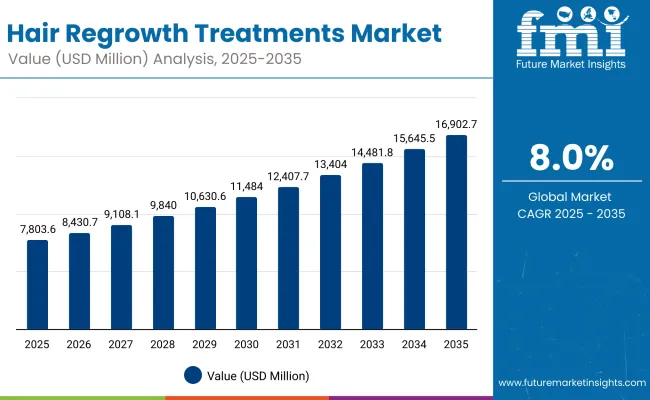
The Global Hair Regrowth Treatments Market is expected to record a valuation of USD 7,803.6 million in 2025 and USD 16,902.7 million in 2035, with an increase of USD 9,099.1 million, which equals a growth of nearly 193% over the decade. The overall expansion represents a CAGR of 8.0% and more than a 2X increase in market size.
Quick Stats for Global Hair Regrowth Treatments Market

  • Global Hair Regrowth Treatments Market Value (2025): USD 7,803.6 million
  • Global Hair Regrowth Treatments Market Forecast Value (2035): USD 16,902.7 million
  • Global Hair Regrowth Treatments Market Forecast CAGR: 8.0%
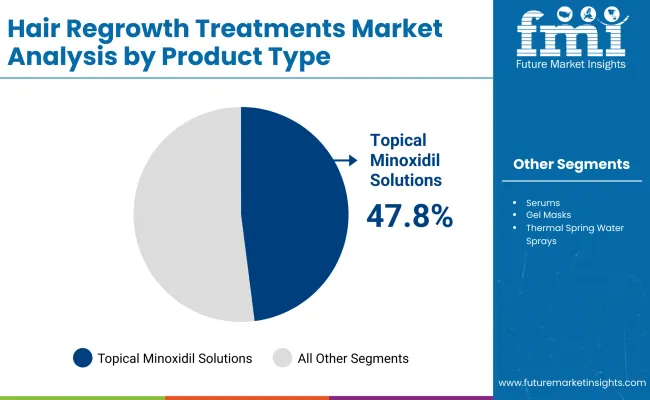
  • Leading Segment in Global Hair Regrowth Treatments Market in 2025: Topical minoxidil solutions (47.8%)
  • Key Growth Regions in the Global Hair Regrowth Treatments Market: India, China, Japan, USA, Europe
  • Top Key Players in Global Hair Regrowth Treatments Market: Rogaine, Kirkland Signature, Hims, Keeps, Nutrafol, Viviscal, DS Laboratories, Lipogaine, Regaine (J&J), Shapiro MD
Hair Regrowth Treatments Market

Global Hair Regrowth Treatments Market Key Takeaways

Metric Value
Global Hair Regrowth Treatments Market Estimated Value (2025E) USD 7,803.6 million
Global Hair Regrowth Treatments Market Forecast Value (2035F) USD 16,902.7 million
Forecast CAGR (2025 to 2035) 8.0%

During the first five-year period from 2025 to 2030, the market increases from USD 7,803.6 million to USD 11,484.9 million, adding USD 3,681.3 million, which accounts for around 40% of the total decade growth.

This phase records steady adoption in over-the-counter topical solutions, dermatology-prescribed regimens, and dietary hair supplements, driven by the rising prevalence of male pattern baldness and women experiencing age-related or hormonal hair thinning. Topical minoxidil formulations dominate this period as they cater to over 47% of the global demand, being the most clinically recognized and widely available solution.

The second half from 2030 to 2035 contributes USD 5,417.8 million, equal to nearly 60% of total growth, as the market jumps from USD 11,484.9 million to USD 16,902.7 million. This acceleration is powered by widespread deployment of laser therapy devices, digital platforms offering personalized regrowth plans, and integration of natural/herbal oils within mainstream treatments.

E-commerce and direct-to-consumer brands capture a larger share by the end of the decade, with digital-first companies like Hims, Keeps, and Nutrafol leveraging online subscription models. Clinical services and dermatology clinics also scale up significantly, particularly in Asia, where medical tourism and affordable procedures drive market adoption. Innovation in oral nutraceuticals, AI-based diagnostics for scalp health, and hormone-specific regimens further expand recurring revenue opportunities.

From 2020 to 2024, the Global Hair Regrowth Treatments Market grew from USD 6,520 million to USD 7,450 million, driven by rising consumer preference for over-the-counter topical treatments and supplements. During this period, the competitive landscape was dominated by established minoxidil brands such as Rogaine and Kirkland Signature, which together controlled nearly 15% of revenue.

Competitive differentiation relied on proven efficacy, clinical trust, and broad retail availability. Herbal oils and natural products gained momentum in Asia and Latin America, but adoption was slower in the West, where clinically backed minoxidil solutions remained the first line of choice. Subscription-based telehealth companies like Hims and Keeps emerged, but their share was still under 5% of the global market by 2024.

Demand for hair regrowth treatments will expand to USD 7,803.6 million in 2025, and the revenue mix will begin to shift as oral supplements and devices grow faster than traditional topical formulas. By mid-decade, players like Nutrafol and Viviscal are pushing category expansion into nutraceuticals, while DS Laboratories and Shapiro MD are integrating AI-driven scalp diagnostics with tailored regimens.

Traditional leaders face rising competition from new digital-first players offering bundled care plans, subscription refills, and direct dermatologist access. Emerging entrants specializing in hormone-based customization, natural formulations, and AR/VR-based scalp imaging tools are gaining share. The competitive advantage is moving away from single-product solutions to integrated care ecosystems, subscription-driven customer retention, and digital distribution strength.

Why the Global Hair Regrowth Treatments Market is growing?

Advances in clinically tested formulations and digital distribution have expanded the accessibility of hair regrowth solutions worldwide. Topical minoxidil remains the most trusted treatment due to decades of proven results, but oral supplements and nutraceuticals are gaining attention among younger consumers looking for preventive care.

The popularity of personalized regimens tailored by age, gender, and hormonal profile has significantly increased, enabling consumers to treat scalp hair loss, beard thinning, and even eyebrow/eyelash concerns with targeted solutions.

The expansion of dermatology clinics and telemedicine-based consultations has fueled market growth, particularly in Asia-Pacific, where medical tourism and lower treatment costs encourage early adoption. E-commerce penetration has accelerated sales, offering global access to both established brands like Rogaine and Nutrafol as well as smaller natural/herbal entrants.

Segment growth is expected to be led by topical minoxidil solutions in 2025, but oral nutraceuticals and laser therapy devices are projected to show faster growth in the second half of the decade. The shift reflects growing consumer demand for both convenience and holistic, multi-modal hair regrowth solutions.

Segmental Analysis

The market is segmented by product type, application area, user group, channel, and region. Product type includes topical minoxidil solutions, oral supplements, laser therapy devices, and natural/herbal oils, which represent the core solutions driving adoption. Application area classification covers scalp hair loss, eyebrow/eyelash thinning, and beard enhancement, catering to both cosmetic and medical requirements.

Based on user group, the market is segmented into men, women, post-partum mothers, and age-related hair loss patients, reflecting the diverse demand base across life stages and conditions. In terms of channel, categories encompass pharmacies & drugstores, e-commerce, dermatology clinics, and supermarkets, highlighting the balance between traditional retail and emerging digital platforms.

Regionally, the scope spans North America, Latin America, Europe, East Asia, South Asia & Pacific, and the Middle East & Africa, where adoption patterns differ based on cultural acceptance, healthcare infrastructure, and consumer affordability.
Insights into the Product Type Segment with Topical Minoxidil Solutions Leading in Market Share

Hair Regrowth Treatments Market By Product Type
Product Type Value Share % 2025
Topical minoxidil solutions 47.8%
Others 52.2%

The topical minoxidil solutions segment is projected to contribute 47.8% of the Global Hair Regrowth Treatments Market revenue in 2025, maintaining its lead as the dominant product type. This strong position is driven by decades of clinical validation, FDA and EMA approvals, and consumer trust in minoxidil as the most reliable first-line treatment for androgenetic alopecia. Topical solutions are widely distributed through pharmacies, e-commerce, and dermatology clinics, ensuring strong penetration across both developed and emerging markets.

Growth within this segment is further fueled by innovations in formulations, such as foam-based solutions, low-irritant versions, and gender-specific concentrations that enhance usability and reduce side effects. Subscription-based direct-to-consumer brands are also expanding minoxidil accessibility with auto-refill plans and bundled dermatologist consultations, reinforcing minoxidil’s status as a staple treatment. While competition from oral supplements and devices is increasing, topical minoxidil is expected to retain its position as the backbone of the market due to affordability, proven efficacy, and accessibility.
Insights into the Application Area Segment with Scalp Hair Loss Dominating the Demand

Hair Regrowth Treatments Market By Application Area
Application Area Value Share % 2025
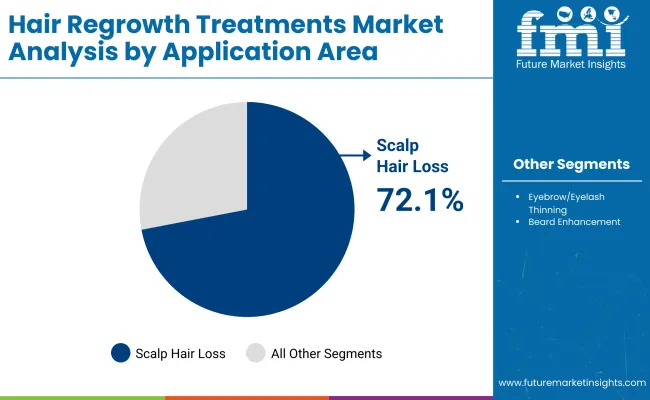
Scalp hair loss 72.1%
Others 27.9%

The scalp hair loss segment is forecasted to hold 72.1% of the market share in 2025, led by its central role in addressing male and female pattern baldness the most prevalent form of hair loss globally. Treatments in this category range from topical minoxidil to oral nutraceuticals and laser therapy devices, all of which are designed to restore or slow down hair thinning on the scalp. The high share reflects both medical necessity and the strong cultural and psychological emphasis on scalp hair as a marker of youth and vitality.

The segment’s dominance is reinforced by its suitability across diverse age groups, from young adults experiencing early-onset alopecia to older patients with progressive thinning. Dermatology clinics are increasingly incorporating advanced regrowth therapies such as platelet-rich plasma (PRP) and laser caps alongside topical treatments, widening the treatment mix available for scalp hair restoration. With technological advancements and growing consumer willingness to invest in long-term scalp care, this segment is expected to continue leading demand in the Global Hair Regrowth Treatments Market.
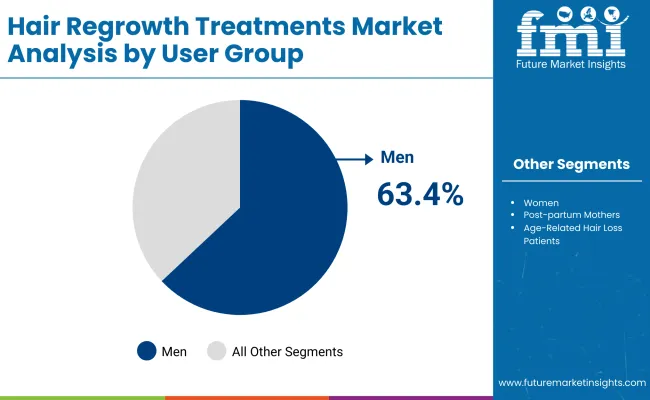
Insights into the User Group Segment with Men Driving the Market

Hair Regrowth Treatments Market By User Group
User Group Value Share % 2025
Men 63.4%
Others 36.6%

The men’s segment is projected to account for 63.4% of the Global Hair Regrowth Treatments Market revenue in 2025, establishing it as the leading user group. Male pattern baldness affects a significant proportion of the global male population, with prevalence increasing sharply after the age of 30. The availability of well-recognized treatments such as minoxidil and finasteride-based regimens has further reinforced men’s adoption levels, with subscription services and telehealth platforms making access more convenient than ever.

The segment’s dominance is strengthened by lifestyle and cultural trends that emphasize appearance and grooming, especially in regions such as North America, Europe, and East Asia. Online awareness campaigns and influencer-driven marketing have also helped normalize male hair regrowth treatments, reducing stigma around seeking medical or cosmetic intervention.

While the women’s and post-partum mothers’ categories are expected to show strong growth over the next decade, men will continue to drive the largest share of demand, supported by early diagnosis, high treatment persistence, and a wide range of both prescription and over-the-counter solutions.

What are the Drivers, Restraints, and Key Trends of the Global Hair Regrowth Treatments Market?

Drivers

Rising Acceptance of Preventive and Multi-Modal Hair Regrowth Solutions

One of the strongest growth drivers for the Global Hair Regrowth Treatments Market is the shift from reactive to preventive approaches to hair loss management. Historically, treatments such as topical minoxidil were adopted once visible baldness had occurred. Now, consumers in their early 20s and 30s especially men at risk of androgenetic alopecia and women with hormonal hair loss are turning to oral supplements, nutraceuticals, and scalp care products as preventive solutions.

Brands like Nutrafol and Viviscal are capitalizing on this trend by marketing hair wellness as part of overall health. This preventive orientation significantly expands the customer base beyond patients with advanced hair thinning, creating a recurring revenue opportunity.

Coupled with rising awareness driven by social media influencers, this driver pushes growth across both developed markets like the USA and rapidly expanding economies like India and China, where younger demographics are highly engaged in beauty and grooming.

Expansion of Digital Platforms and Subscription-Based Telehealth Models

Another major driver is the rapid adoption of digital-first distribution and subscription-based treatment services. Platforms such as Hims and Keeps have disrupted traditional pharmacy distribution by offering complete online ecosystems diagnosis through teleconsultation, treatment prescriptions, auto-refill minoxidil, finasteride, or supplement packs, and long-term tracking.

This model has been particularly successful in the USA and is expanding globally into Europe and Asia. Consumers value the privacy, convenience, and affordability of such services, especially for a condition often associated with stigma.

The recurring subscription structure creates predictable revenue streams for companies while reducing consumer dropout rates, which historically has been a challenge in the hair regrowth space. This shift toward digital ecosystems is a powerful driver sustaining long-term growth.

Restraints

Limited Treatment Efficacy and High Dropout Rates

Despite the growth, the Global Hair Regrowth Treatments Market faces a restraint in terms of product efficacy and consumer adherence. Topical minoxidil, while clinically proven, does not work for all patients and requires consistent application over months to maintain visible results. Similarly, oral supplements often face skepticism as outcomes vary across individuals depending on genetics, nutrition, and hormonal profiles.

These limitations lead to high dropout rates, especially within the first 6-12 months of use. In markets like the USA and Europe, where consumers are highly aware and demanding of results, this factor creates churn and reduces long-term market penetration. New entrants with natural or herbal oils also struggle to provide robust clinical validation, limiting adoption beyond niche consumer bases.

Regulatory Barriers and Side-Effect Concerns

Regulatory frameworks in different regions present another restraint. In the USA and Europe, topical minoxidil is FDA- and EMA-approved, but other products like finasteride are prescription-only, creating barriers to easy access. In addition, oral supplements and herbal oils fall into gray regulatory zones, often marketed as nutraceuticals without strict efficacy claims, leading to trust issues.

Side effects such as scalp irritation from minoxidil, hormonal effects from finasteride, or allergic reactions to herbal blends further restrict adoption. In Asia-Pacific and the Middle East, regulatory approval processes for new ingredients or devices can be lengthy, delaying market entry and regional expansion. These challenges slow down product innovation and consumer confidence, acting as a cap on growth potential.

Key Trends

Integration of AI and Digital Diagnostics in Personalized Hair Regrowth Plans

A key trend shaping the market is the use of AI-driven diagnostic tools and digital imaging platforms for scalp analysis. Emerging brands and dermatology clinics are adopting mobile apps, AR scalp imaging, and AI algorithms that assess follicle density, scalp health, and potential hair thinning trajectories.

Based on these diagnostics, companies can recommend personalized regimens combining topical minoxidil, oral supplements, and lifestyle changes to maximize efficacy. This trend is especially strong in China, Japan, and India, where tech-savvy consumers and large smartphone penetration rates enable rapid adoption. By enhancing personalization, AI tools improve consumer trust, reduce dropout rates, and differentiate premium brands in a crowded marketplace.

Rising Popularity of Natural and Herbal Oils as Complementary Treatments

Another important trend is the growing role of natural and herbal oils in consumer regimens. While not always clinically comparable to minoxidil, these products such as rosemary oil, castor oil, and ayurvedic blends are increasingly popular due to their “clean-label,” chemical-free appeal. In markets such as India, Southeast Asia, and Latin America, herbal oils have strong cultural acceptance and are used alongside topical or oral treatments as supportive care.

Global brands are recognizing this trend, with some integrating natural oils into product portfolios to cater to consumers who seek holistic, low-risk alternatives. This trend also aligns with the broader global movement toward plant-based wellness and is likely to grow in parallel with mainstream clinical treatments, carving out a complementary rather than competitive role in the market.
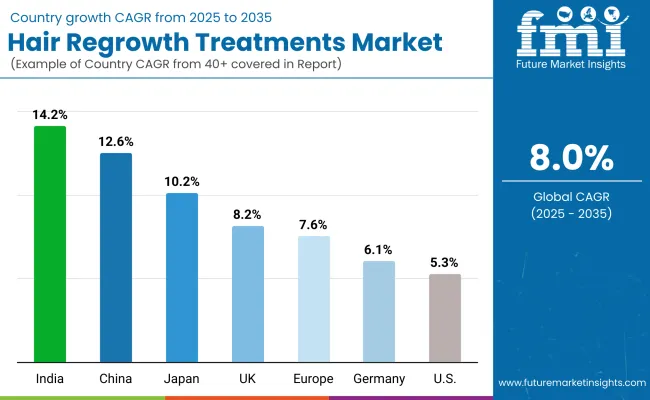
Analysis of Global Hair Regrowth Treatments Market By Key Countries

Hair Regrowth Treatments Market By Country

Country Estimated CAGR (2025 to 2035)
China 12.6%
USA 5.3%
India 14.2%
UK 8.2%
Germany 6.1%
Japan 10.2%
Europe 7.6%

The country-wise outlook of the Global Hair Regrowth Treatments Market highlights strong growth momentum in Asia, with India (14.2% CAGR) and China (12.6% CAGR) emerging as the fastest-expanding markets between 2025 and 2035. In India, rising disposable incomes, greater acceptance of nutraceuticals, and the deep cultural roots of herbal oils are driving rapid expansion.

Younger consumers are proactively adopting preventive treatments, while urban populations are increasingly turning to e-commerce platforms for minoxidil and supplement purchases. China, on the other hand, is benefitting from strong demand for premium dermatology services, rising adoption of AI-based scalp diagnostics, and growing consumer openness to laser therapy devices. Both markets are expected to outpace global averages due to their large populations, younger demographics, and a fast-growing awareness of cosmetic wellness.

In contrast, developed markets like the USA (5.3% CAGR), Germany (6.1% CAGR), and the UK (8.2% CAGR) reflect slower but steady growth as penetration levels are already high and competition is mature. The USA remains the largest single-country market, supported by subscription-based telehealth services such as Hims and Keeps, but growth is capped by high dropout rates and regulatory restrictions on certain oral treatments.

European markets, including the UK and Germany, are witnessing moderate expansion, supported by dermatology clinics and clean-label natural alternatives, though stricter regulatory frameworks slow the adoption of newer products.

Japan (10.2% CAGR) is a standout among developed nations, benefitting from high consumer spending on grooming, advanced clinic-based therapies, and widespread acceptance of technology-driven solutions such as laser caps. Overall, the regional picture shows Asia-Pacific driving global growth, while the USA and Europe maintain market maturity with gradual, innovation-driven gains.
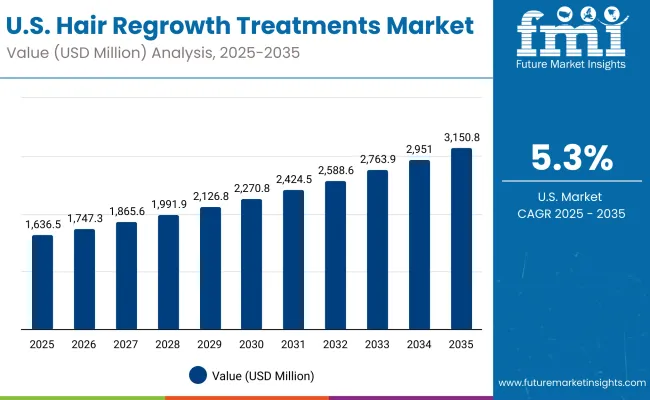
Sales Outlook for Hair Regrowth Treatments in the United States

United States Hair Regrowth Treatments Market

Year USA Hair Regrowth Treatments Market (USD Million)
2025 1636.53
2026 1747.33
2027 1865.63
2028 1991.94
2029 2126.80
2030 2270.80
2031 2424.54
2032 2588.69
2033 2763.95
2034 2951.08
2035 3150.88

The Global Hair Regrowth Treatments Market in the United States is projected to grow at a CAGR of 5.3%, driven by the expansion of subscription-based telehealth platforms and sustained consumer reliance on topical minoxidil solutions. The USA market is highly competitive, with Rogaine, Hims, and Keeps leading in both retail and digital channels.

While minoxidil remains the backbone of treatment, oral nutraceuticals like Nutrafol and Viviscal are gaining strong traction among women and aging populations. Dermatology clinics are also expanding advanced regrowth services such as PRP (platelet-rich plasma) therapy and laser-based devices. However, dropout rates due to inconsistent results remain a challenge, prompting companies to bundle multiple modalities and offer long-term subscription care.

  • Telehealth subscription services are normalizing treatment adoption for men.
  • Oral nutraceuticals are increasingly adopted by women and age-related users.
  • Dermatology clinics are integrating PRP and laser therapy with minoxidil regimens.

Growth and Expansion Outlook for Hair Regrowth Treatments in the United Kingdom

The Global Hair Regrowth Treatments Market in the United Kingdom is expected to grow at a CAGR of 8.2%, supported by a blend of traditional pharmacy-based distribution and rising e-commerce penetration. Increasing social acceptance of cosmetic interventions, particularly among younger men and post-partum mothers, is fueling market demand.

The UK also shows strong interest in clean-label, natural, and herbal oils marketed as scalp nourishment products, often purchased online. Premium dermatology clinics in London and Manchester are offering integrated treatments, combining minoxidil, microneedling, and low-level laser therapy to appeal to consumers seeking faster results. Regulatory oversight, while strict, has improved consumer trust in clinically backed regimens, positioning the UK as one of Europe’s innovation-driven markets.

  • Younger men and post-partum mothers are driving demand for minoxidil and supplements.
  • Herbal oils and clean-label products are gaining popularity through e-commerce.
  • Dermatology clinics are offering combined regimens for faster cosmetic results.

Growth and Expansion Outlook for Hair Regrowth Treatments in India

India is witnessing rapid growth in the Global Hair Regrowth Treatments Market, which is forecast to expand at a CAGR of 14.2% through 2035. This strong momentum is underpinned by high consumer acceptance of herbal oils and ayurvedic formulations, alongside the rising availability of minoxidil solutions at pharmacies and online platforms.

Tier-2 and Tier-3 cities are becoming important growth centers due to cost reductions and increased awareness of preventive hair care. Younger demographics, especially men in urban areas, are early adopters of oral supplements and nutraceuticals.

Dermatology clinics are also recording strong uptake for affordable PRP and microneedling therapies, often marketed as cosmetic procedures. The combination of cultural familiarity with hair oils and modern clinical treatments creates a unique hybrid growth pathway in India.

  • Herbal and ayurvedic oils dominate traditional demand, complementing minoxidil usage.
  • E-commerce is driving minoxidil and supplement sales in Tier-2 and Tier-3 cities.
  • Dermatology clinics are making advanced treatments accessible at affordable costs.

Sales Outlook for Hair Regrowth Treatments in China

The Global Hair Regrowth Treatments Market in China is expected to grow at a CAGR of 12.6%, the second-highest among leading economies. Demand is driven by rapid adoption of advanced dermatology services, AI-powered scalp diagnostic tools, and smart laser therapy devices. Chinese consumers are highly receptive to premium, tech-enabled solutions that combine convenience with perceived efficacy.

Municipal healthcare programs and wellness platforms are also promoting preventive treatments among younger consumers, creating a broad demand base. Domestic brands are competing aggressively with global leaders by offering affordable minoxidil solutions and herbal alternatives tailored to local preferences.

With strong e-commerce penetration, live-streaming sales, and growing awareness around cosmetic wellness, China is positioned to become one of the most dynamic markets in the global landscape.

  • AI-powered scalp diagnostics and laser caps are seeing strong adoption in urban centers.
  • Domestic brands are offering competitively priced minoxidil and herbal regrowth oils.
  • E-commerce and live-streaming platforms are key distribution drivers for growth.
Country 2025 Share (%)
USA 21.0%
China 10.7%
Japan 6.2%
Germany 13.8%
UK 7.3%
India 4.4%
Europe 19.8%
Country 2035 Share (%)
USA 18.6%
China 11.6%
Japan 7.5%
Germany 12.0%
UK 6.5%
India 5.3%
Europe 18.1%

Growth Outlook for Hair Regrowth Treatments Market in USA

Usa Hair Regrowth Treatments Market

USA By Product Type Value Share % 2025
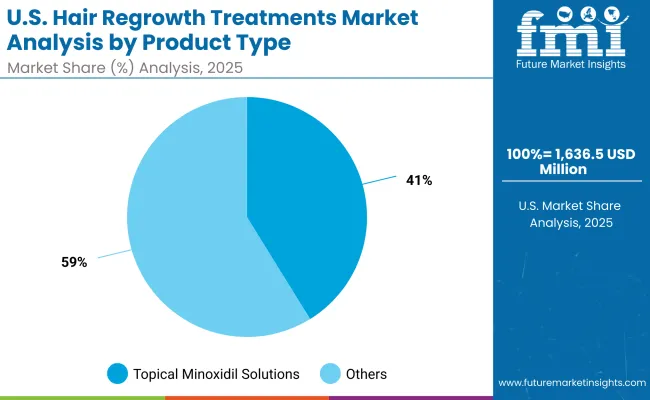
Topical minoxidil solutions 41.2%
Others 58.8%

The Global Hair Regrowth Treatments Market in the United States is valued at USD 1,636.53 million in 2025. Topical minoxidil contributes 41.2%, while other categories including supplements, laser devices, and herbal oils collectively account for 58.8%, which shows a clear transition toward diversified, multi-modal regrowth solutions.

This shift reflects the limitations of relying on minoxidil alone and the rising consumer demand for complementary or alternative treatments. Supplements like Nutrafol and Viviscal are strongly positioned, especially among women and aging consumers, while laser therapy devices are being promoted as convenient home-use solutions with non-invasive appeal.

The expansion of subscription-based telehealth platforms such as Hims and Keeps is a major catalyst, as they bundle minoxidil with finasteride, supplements, and dermatologist access, thereby creating integrated treatment pathways. The increasing popularity of preventive care, particularly among younger men in their 20s and 30s, is driving consistent year-on-year adoption.

Dermatology clinics are also strengthening demand by combining minoxidil with advanced procedures like PRP (platelet-rich plasma) injections and microneedling, appealing to consumers who seek faster and more visible results. As consumer awareness matures, the USA market is expected to maintain steady growth by aligning product innovation with convenience, personalization, and clinical credibility.
  • Market in the USA holds 21% share of the global market in 2025.
  • Topical minoxidil contributes 41.2%, while diversified solutions lead at 58.8%.
  • Growth is supported by telehealth subscriptions, preventive adoption, and clinic-based regimens.

Opportunity Analysis of China Hair Regrowth Treatments Market

China Hair Regrowth Treatments Market

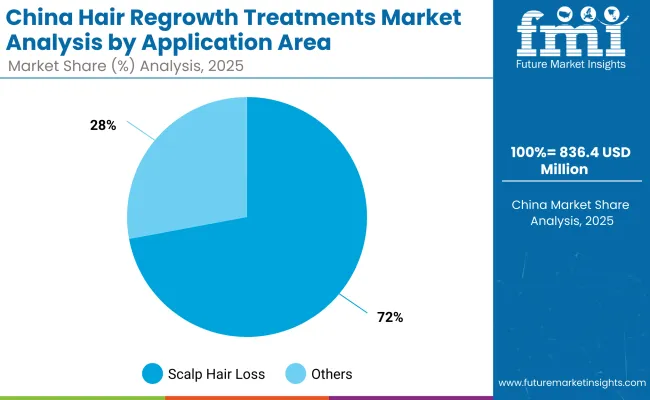
China By Application Area Value Share % 2025
Scalp hair loss 72.1%
Others 27.9%

The Global Hair Regrowth Treatments Market in China is valued at USD 836.45 million in 2025, with scalp hair loss treatments leading at 72.1%, followed by other cosmetic segments like eyebrow/eyelash regrowth and beard enhancement at 27.9%.

The dominance of scalp treatments is a direct reflection of consumer priorities in managing androgenetic alopecia, which affects both men and women in urban centers. China’s consumer base is increasingly favoring high-tech regimens, such as AI-powered scalp diagnostic tools and laser caps, which allow personalization and convenience at home. These solutions are often integrated with minoxidil or natural oils, creating a hybrid treatment model that blends tradition with modern science.

The strong role of e-commerce platforms like Tmall and JD.com in distributing hair regrowth products further accelerates adoption, aided by live-streaming sales channels that educate consumers about efficacy and routines.

Domestic companies are competing aggressively with international brands by offering cost-effective minoxidil formulations and herbal blends tailored to local preferences, while premium clinics in tier-1 cities are pushing procedures like PRP therapy and microneedling. As China deepens its investment in wellness and aesthetic healthcare, it is expected to outpace most developed markets and solidify its role as a global growth hub.
  • Market size for China in 2025 is USD 836.45 million.
  • Global market share is approximately 10.7% in 2025.
  • Scalp hair loss leads at 72.1% due to high prevalence and consumer priority.

Competitive Landscape of Global Hair Regrowth Treatments Market

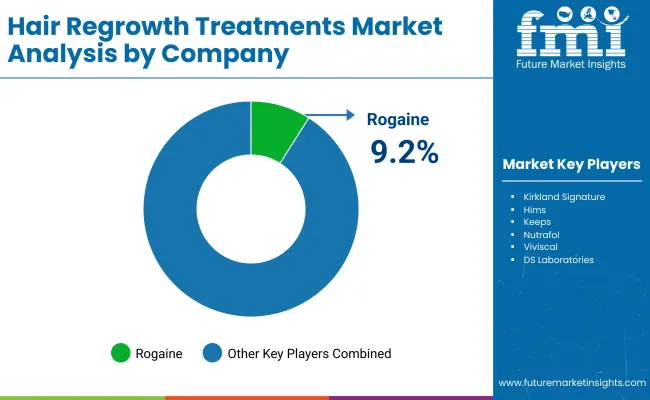
Hair Regrowth Treatments Market By Company

Company Global Value Share 2025
Rogaine 9.2%
Others 90.8%

The Global Hair Regrowth Treatments Market is moderately fragmented, with a mix of long-established pharmaceutical leaders, direct-to-consumer subscription brands, and natural/nutraceutical-focused players. Global leaders like Rogaine (J&J) dominate the topical minoxidil category, leveraging decades of clinical credibility and wide-scale distribution across pharmacies and e-commerce channels.

Their dominance is particularly strong in the USA and Europe, where minoxidil is considered the gold standard treatment. However, their market share is under pressure from emerging players diversifying the regrowth category.

Direct-to-consumer brands such as Hims, Keeps, and Shapiro MD are rapidly expanding by offering bundled regimens that include minoxidil, finasteride, oral supplements, and dermatologist support. Their model emphasizes convenience, privacy, and subscription-based retention, appealing strongly to younger men. Nutraceutical players like Nutrafol and Viviscal are capturing women’s and older consumers’ attention by positioning regrowth as part of holistic wellness, supported by influencer campaigns and clinical backing.

Meanwhile, niche-focused providers like DS Laboratories and Lipogaine differentiate through advanced formulations, herbal blends, and device integration. Competitive differentiation is shifting from single-product solutions toward integrated ecosystems combining topical, oral, device-based, and digital services into personalized packages.

The balance of power in this market is moving away from legacy minoxidil brands alone, toward companies capable of delivering convenience, personalization, and recurring revenue models through e-commerce and clinic partnerships.

Key Developments in Global Hair Regrowth Treatments Market

  • On October 29, 2024, Kintor Pharmaceutical’s topical androgen receptor antagonist Pyrilutamide (KX-826) was officially approved by China’s NMPA to begin a Phase Ib/III clinical trial in combination with minoxidil for treating male androgenetic alopecia, signalling an emerging strategy to blend new AR-antagonist agents with long-established treatments to improve efficacy.
  • On late 2023 (results announced November 27, 2023), Kintor published Phase II data from its China male AGA (androgenetic alopecia) trial showing that Pyrilutamide promoted statistically significant hair growth compared to baseline at all tested dose levels, laying the groundwork for later trials including in women.

Scope of the Report

Item Value
Quantitative Units USD Million
Product Type Topical minoxidil solutions, Oral supplements, Laser therapy devices, Natural/herbal oils
Application Area Scalp hair loss, Eyebrow/eyelash thinning, Beard enhancement
User Group Men, Women, Post-partum mothers, Age-related hair loss patients
Channel Pharmacies & drugstores, E-commerce, Dermatology clinics, Supermarkets
Regions Covered North America, Europe, East Asia, South Asia & Pacific, Latin America, Middle East & Africa
Country Covered United States, Canada, Germany, France, United Kingdom, China, Japan, India, Brazil, South Africa
Key Companies Profiled Rogaine, Kirkland Signature, Hims , Keeps, Nutrafol , Viviscal , DS Laboratories, Lipogaine , Regaine (J&J), Shapiro MD
Additional Attributes Dollar sales by product type and application area, adoption trends in telehealth and subscription-based models, rising demand for topical minoxidil and oral nutraceuticals, segment-specific growth in men and post-partum women, revenue share by e-commerce and dermatology clinics, integration of AI-based scalp diagnostics and laser therapy devices, regional trends shaped by cultural acceptance and affordability, and innovation in natural/herbal formulations alongside clinically validated treatments.

Key Segments

By Product Type:

  • Topical minoxidil solutions
  • Oral supplements
  • Laser therapy devices
  • Natural/herbal oils

By Application Area:

  • Scalp hair loss
  • Eyebrow/eyelash thinning
  • Beard enhancement

By Channel:

  • E-commerce
  • Dermatology clinics
  • Supermarkets
  • Pharmacies & drugstores

By User Group:

  • Men
  • Women
  • Post-partum mothers
  • Age-related hair loss patients

By Region:

  • North America
  • Latin America
  • Europe
  • East Asia
  • South Asia & Pacific
  • Middle East and Africa

Table of Content

  1. Executive Summary
    • Global Market Outlook
    • Demand-side Trends
    • Supply-side Trends
    • Technology Roadmap Analysis
    • Analysis and Recommendations
  2. Market Overview
    • Market Coverage / Taxonomy
    • Market Definition / Scope / Limitations
  3. Market Background
    • Market Dynamics
      • Drivers
      • Restraints
      • Opportunity
      • Trends
    • Scenario Forecast
      • Demand in Optimistic Scenario
      • Demand in Likely Scenario
      • Demand in Conservative Scenario
    • Opportunity Map Analysis
    • Product Life Cycle Analysis
    • Supply Chain Analysis
      • Supply Side Participants and their Roles
        • Producers
        • Mid-Level Participants (Traders/ Agents/ Brokers)
        • Wholesalers and Distributors
      • Value Added and Value Created at Node in the Supply Chain
      • List of Raw Material Suppliers
      • List of Existing and Potential Buyer’s
    • Investment Feasibility Matrix
    • Value Chain Analysis
      • Profit Margin Analysis
      • Wholesalers and Distributors
      • Retailers
    • PESTLE and Porter’s Analysis
    • Regulatory Landscape
      • By Key Regions
      • By Key Countries
    • Regional Parent Market Outlook
    • Production and Consumption Statistics
    • Import and Export Statistics
  4. Global Market Analysis 2020 to 2024 and Forecast, 2025 to 2035
    • Historical Market Size Value (USD Million) & Volume (Units) Analysis, 2020 to 2024
    • Current and Future Market Size Value (USD Million) & Volume (Units) Projections, 2025 to 2035
      • Y-o-Y Growth Trend Analysis
      • Absolute $ Opportunity Analysis
  5. Global Market Analysis 2020 to 2024 and Forecast 2025 to 2035, By Product Type
    • Introduction / Key Findings
    • Historical Market Size Value (USD Million) & Volume (Units) Analysis By Product Type, 2020 to 2024
    • Current and Future Market Size Value (USD Million) & Volume (Units) Analysis and Forecast By Product Type, 2025 to 2035
      • Topical minoxidil solutions
      • Oral supplements
      • Laser therapy devices
      • Natural/herbal oils
    • Y-o-Y Growth Trend Analysis By Product Type, 2020 to 2024
    • Absolute $ Opportunity Analysis By Product Type, 2025 to 2035
  6. Global Market Analysis 2020 to 2024 and Forecast 2025 to 2035, By Application Area
    • Introduction / Key Findings
    • Historical Market Size Value (USD Million) & Volume (Units) Analysis By Application Area, 2020 to 2024
    • Current and Future Market Size Value (USD Million) & Volume (Units) Analysis and Forecast By Application Area, 2025 to 2035
      • Scalp hair loss
      • Eyebrow/eyelash thinning
      • Beard enhancement
    • Y-o-Y Growth Trend Analysis By Application Area, 2020 to 2024
    • Absolute $ Opportunity Analysis By Application Area, 2025 to 2035
  7. Global Market Analysis 2020 to 2024 and Forecast 2025 to 2035, By Channel
    • Introduction / Key Findings
    • Historical Market Size Value (USD Million) & Volume (Units) Analysis By Channel, 2020 to 2024
    • Current and Future Market Size Value (USD Million) & Volume (Units) Analysis and Forecast By Channel, 2025 to 2035
      • E-commerce
      • Dermatology clinics
      • Supermarkets
      • Pharmacies & drugstores
    • Y-o-Y Growth Trend Analysis By Channel, 2020 to 2024
    • Absolute $ Opportunity Analysis By Channel, 2025 to 2035
  8. Global Market Analysis 2020 to 2024 and Forecast 2025 to 2035, By User Group
    • Introduction / Key Findings
    • Historical Market Size Value (USD Million) & Volume (Units) Analysis By User Group, 2020 to 2024
    • Current and Future Market Size Value (USD Million) & Volume (Units) Analysis and Forecast By User Group, 2025 to 2035
      • Men
      • Women
      • Post-partum mothers
      • Age-related hair loss patients
    • Y-o-Y Growth Trend Analysis By User Group, 2020 to 2024
    • Absolute $ Opportunity Analysis By User Group, 2025 to 2035
  9. Global Market Analysis 2020 to 2024 and Forecast 2025 to 2035, By Region
    • Introduction
    • Historical Market Size Value (USD Million) & Volume (Units) Analysis By Region, 2020 to 2024
    • Current Market Size Value (USD Million) & Volume (Units) Analysis and Forecast By Region, 2025 to 2035
      • North America
      • Latin America
      • Europe
      • East Asia
      • South Asia & Pacific
      • Middle East and Africa
    • Market Attractiveness Analysis By Region
  10. North America Market Analysis 2020 to 2024 and Forecast 2025 to 2035, By Country
    • Historical Market Size Value (USD Million) & Volume (Units) Trend Analysis By Market Taxonomy, 2020 to 2024
    • Market Size Value (USD Million) & Volume (Units) Forecast By Market Taxonomy, 2025 to 2035
      • By Country
        • USA
        • Canada
      • By Product Type
      • By Application Area
      • By Channel
      • By User Group
    • Market Attractiveness Analysis
      • By Country
      • By Product Type
      • By Application Area
      • By Channel
      • By User Group
    • Key Takeaways
  11. Latin America Market Analysis 2020 to 2024 and Forecast 2025 to 2035, By Country
    • Historical Market Size Value (USD Million) & Volume (Units) Trend Analysis By Market Taxonomy, 2020 to 2024
    • Market Size Value (USD Million) & Volume (Units) Forecast By Market Taxonomy, 2025 to 2035
      • By Country
        • Brazil
        • Mexico
        • Colombia
        • Rest of Latin America
      • By Product Type
      • By Application Area
      • By Channel
      • By User Group
    • Market Attractiveness Analysis
      • By Country
      • By Product Type
      • By Application Area
      • By Channel
      • By User Group
    • Key Takeaways
  12. Europe Market Analysis 2020 to 2024 and Forecast 2025 to 2035, By Country
    • Historical Market Size Value (USD Million) & Volume (Units) Trend Analysis By Market Taxonomy, 2020 to 2024
    • Market Size Value (USD Million) & Volume (Units) Forecast By Market Taxonomy, 2025 to 2035
      • By Country
        • Germany
        • UK
        • France
        • Italy
        • Spain
        • Belgium
        • Netherlands
        • Nordic
        • Switzerland
        • Russia
        • Poland
        • Rest of Europe
      • By Product Type
      • By Application Area
      • By Channel
      • By User Group
    • Market Attractiveness Analysis
      • By Country
      • By Product Type
      • By Application Area
      • By Channel
      • By User Group
    • Key Takeaways
  13. East Asia Market Analysis 2020 to 2024 and Forecast 2025 to 2035, By Country
    • Historical Market Size Value (USD Million) & Volume (Units) Trend Analysis By Market Taxonomy, 2020 to 2024
    • Market Size Value (USD Million) & Volume (Units) Forecast By Market Taxonomy, 2025 to 2035
      • By Country
        • China
        • Japan
        • South Korea
      • By Product Type
      • By Application Area
      • By Channel
      • By User Group
    • Market Attractiveness Analysis
      • By Country
      • By Product Type
      • By Application Area
      • By Channel
      • By User Group
    • Key Takeaways
  14. South Asia & Pacific Market Analysis 2020 to 2024 and Forecast 2025 to 2035, By Country
    • Historical Market Size Value (USD Million) & Volume (Units) Trend Analysis By Market Taxonomy, 2020 to 2024
    • Market Size Value (USD Million) & Volume (Units) Forecast By Market Taxonomy, 2025 to 2035
      • By Country
        • India
        • Thailand
        • Malaysia
        • Indonesia
        • Singapore
        • Vietnam
        • Australia
        • New Zealand
        • Rest of South Asia
      • By Product Type
      • By Application Area
      • By Channel
      • By User Group
    • Market Attractiveness Analysis
      • By Country
      • By Product Type
      • By Application Area
      • By Channel
      • By User Group
    • Key Takeaways
  15. Middle East and Africa Market Analysis 2020 to 2024 and Forecast 2025 to 2035, By Country
    • Historical Market Size Value (USD Million) & Volume (Units) Trend Analysis By Market Taxonomy, 2020 to 2024
    • Market Size Value (USD Million) & Volume (Units) Forecast By Market Taxonomy, 2025 to 2035
      • By Country
        • Turkey
        • UAE
        • Saudi Arabia
        • Israel
        • Other GCC Countries
        • North Africa
        • South Africa
      • By Product Type
      • By Application Area
      • By Channel
      • By User Group
    • Market Attractiveness Analysis
      • By Country
      • By Product Type
      • By Application Area
      • By Channel
      • By User Group
    • Key Takeaways
  16. Key Countries Market Analysis
    • USA
      • Pricing Analysis
      • Market Share Analysis, 2024
        • By Product Type
        • By Application Area
        • By Channel
        • By User Group
    • Canada
      • Pricing Analysis
      • Market Share Analysis, 2024
        • By Product Type
        • By Application Area
        • By Channel
        • By User Group
    • Brazil
      • Pricing Analysis
      • Market Share Analysis, 2024
        • By Product Type
        • By Application Area
        • By Channel
        • By User Group
    • Mexico
      • Pricing Analysis
      • Market Share Analysis, 2024
        • By Product Type
        • By Application Area
        • By Channel
        • By User Group
    • Colombia
      • Pricing Analysis
      • Market Share Analysis, 2024
        • By Product Type
        • By Application Area
        • By Channel
        • By User Group
    • Germany
      • Pricing Analysis
      • Market Share Analysis, 2024
        • By Product Type
        • By Application Area
        • By Channel
        • By User Group
    • UK
      • Pricing Analysis
      • Market Share Analysis, 2024
        • By Product Type
        • By Application Area
        • By Channel
        • By User Group
    • France
      • Pricing Analysis
      • Market Share Analysis, 2024
        • By Product Type
        • By Application Area
        • By Channel
        • By User Group
    • Italy
      • Pricing Analysis
      • Market Share Analysis, 2024
        • By Product Type
        • By Application Area
        • By Channel
        • By User Group
    • Spain
      • Pricing Analysis
      • Market Share Analysis, 2024
        • By Product Type
        • By Application Area
        • By Channel
        • By User Group
    • Belgium
      • Pricing Analysis
      • Market Share Analysis, 2024
        • By Product Type
        • By Application Area
        • By Channel
        • By User Group
    • Netherlands
      • Pricing Analysis
      • Market Share Analysis, 2024
        • By Product Type
        • By Application Area
        • By Channel
        • By User Group
    • Nordic
      • Pricing Analysis
      • Market Share Analysis, 2024
        • By Product Type
        • By Application Area
        • By Channel
        • By User Group
    • Switzerland
      • Pricing Analysis
      • Market Share Analysis, 2024
        • By Product Type
        • By Application Area
        • By Channel
        • By User Group
    • Russia
      • Pricing Analysis
      • Market Share Analysis, 2024
        • By Product Type
        • By Application Area
        • By Channel
        • By User Group
    • Poland
      • Pricing Analysis
      • Market Share Analysis, 2024
        • By Product Type
        • By Application Area
        • By Channel
        • By User Group
    • China
      • Pricing Analysis
      • Market Share Analysis, 2024
        • By Product Type
        • By Application Area
        • By Channel
        • By User Group
    • Japan
      • Pricing Analysis
      • Market Share Analysis, 2024
        • By Product Type
        • By Application Area
        • By Channel
        • By User Group
    • South Korea
      • Pricing Analysis
      • Market Share Analysis, 2024
        • By Product Type
        • By Application Area
        • By Channel
        • By User Group
    • India
      • Pricing Analysis
      • Market Share Analysis, 2024
        • By Product Type
        • By Application Area
        • By Channel
        • By User Group
    • Thailand
      • Pricing Analysis
      • Market Share Analysis, 2024
        • By Product Type
        • By Application Area
        • By Channel
        • By User Group
    • Indonesia
      • Pricing Analysis
      • Market Share Analysis, 2024
        • By Product Type
        • By Application Area
        • By Channel
        • By User Group
    • Australia
      • Pricing Analysis
      • Market Share Analysis, 2024
        • By Product Type
        • By Application Area
        • By Channel
        • By User Group
    • New Zealand
      • Pricing Analysis
      • Market Share Analysis, 2024
        • By Product Type
        • By Application Area
        • By Channel
        • By User Group
    • Turkey
      • Pricing Analysis
      • Market Share Analysis, 2024
        • By Product Type
        • By Application Area
        • By Channel
        • By User Group
    • UAE
      • Pricing Analysis
      • Market Share Analysis, 2024
        • By Product Type
        • By Application Area
        • By Channel
        • By User Group
    • Saudi Arabia
      • Pricing Analysis
      • Market Share Analysis, 2024
        • By Product Type
        • By Application Area
        • By Channel
        • By User Group
    • Israel
      • Pricing Analysis
      • Market Share Analysis, 2024
        • By Product Type
        • By Application Area
        • By Channel
        • By User Group
    • North Africa
      • Pricing Analysis
      • Market Share Analysis, 2024
        • By Product Type
        • By Application Area
        • By Channel
        • By User Group
    • South Africa
      • Pricing Analysis
      • Market Share Analysis, 2024
        • By Product Type
        • By Application Area
        • By Channel
        • By User Group
  17. Market Structure Analysis
    • Competition Dashboard
    • Competition Benchmarking
    • Market Share Analysis of Top Players
      • By Regional
      • By Product Type
      • By Application Area
      • By Channel
      • By User Group
  18. Competition Analysis
    • Competition Deep Dive
      • Rogaine
        • Overview
        • Product Portfolio
        • Profitability by Market Segments (Product/Age /Sales Channel/Region)
        • Sales Footprint
        • Strategy Overview
          • Marketing Strategy
          • Product Strategy
          • Channel Strategy
      • Kirkland Signature
        • Overview
        • Product Portfolio
        • Profitability by Market Segments (Product/Age /Sales Channel/Region)
        • Sales Footprint
        • Strategy Overview
          • Marketing Strategy
          • Product Strategy
          • Channel Strategy
      • Hims
        • Overview
        • Product Portfolio
        • Profitability by Market Segments (Product/Age /Sales Channel/Region)
        • Sales Footprint
        • Strategy Overview
          • Marketing Strategy
          • Product Strategy
          • Channel Strategy
      • Keeps
        • Overview
        • Product Portfolio
        • Profitability by Market Segments (Product/Age /Sales Channel/Region)
        • Sales Footprint
        • Strategy Overview
          • Marketing Strategy
          • Product Strategy
          • Channel Strategy
      • Nutrafol
        • Overview
        • Product Portfolio
        • Profitability by Market Segments (Product/Age /Sales Channel/Region)
        • Sales Footprint
        • Strategy Overview
          • Marketing Strategy
          • Product Strategy
          • Channel Strategy
      • Viviscal
        • Overview
        • Product Portfolio
        • Profitability by Market Segments (Product/Age /Sales Channel/Region)
        • Sales Footprint
        • Strategy Overview
          • Marketing Strategy
          • Product Strategy
          • Channel Strategy
      • DS Laboratories
        • Overview
        • Product Portfolio
        • Profitability by Market Segments (Product/Age /Sales Channel/Region)
        • Sales Footprint
        • Strategy Overview
          • Marketing Strategy
          • Product Strategy
          • Channel Strategy
      • Lipogaine
        • Overview
        • Product Portfolio
        • Profitability by Market Segments (Product/Age /Sales Channel/Region)
        • Sales Footprint
        • Strategy Overview
          • Marketing Strategy
          • Product Strategy
          • Channel Strategy
      • Regaine (J&J)
        • Overview
        • Product Portfolio
        • Profitability by Market Segments (Product/Age /Sales Channel/Region)
        • Sales Footprint
        • Strategy Overview
          • Marketing Strategy
          • Product Strategy
          • Channel Strategy
      • Shapiro MD
        • Overview
        • Product Portfolio
        • Profitability by Market Segments (Product/Age /Sales Channel/Region)
        • Sales Footprint
        • Strategy Overview
          • Marketing Strategy
          • Product Strategy
          • Channel Strategy
  19. Assumptions & Acronyms Used
  20. Research Methodology

List of Tables

  • Table 1: Global Market Value (USD Million) Forecast by Region, 2020-2035
  • Table 2: Global Market Volume (Units) Forecast by Region, 2020-2035
  • Table 3: Global Market Value (USD Million) Forecast by Product Type, 2020-2035
  • Table 4: Global Market Volume (Units) Forecast by Product Type, 2020-2035
  • Table 5: Global Market Value (USD Million) Forecast by Application Area, 2020-2035
  • Table 6: Global Market Volume (Units) Forecast by Application Area, 2020-2035
  • Table 7: Global Market Value (USD Million) Forecast by Channel, 2020-2035
  • Table 8: Global Market Volume (Units) Forecast by Channel, 2020-2035
  • Table 9: Global Market Value (USD Million) Forecast by User Group, 2020-2035
  • Table 10: Global Market Volume (Units) Forecast by User Group, 2020-2035
  • Table 11: North America Market Value (USD Million) Forecast by Country, 2020-2035
  • Table 12: North America Market Volume (Units) Forecast by Country, 2020-2035
  • Table 13: North America Market Value (USD Million) Forecast by Product Type, 2020-2035
  • Table 14: North America Market Volume (Units) Forecast by Product Type, 2020-2035
  • Table 15: North America Market Value (USD Million) Forecast by Application Area, 2020-2035
  • Table 16: North America Market Volume (Units) Forecast by Application Area, 2020-2035
  • Table 17: North America Market Value (USD Million) Forecast by Channel, 2020-2035
  • Table 18: North America Market Volume (Units) Forecast by Channel, 2020-2035
  • Table 19: North America Market Value (USD Million) Forecast by User Group, 2020-2035
  • Table 20: North America Market Volume (Units) Forecast by User Group, 2020-2035
  • Table 21: Latin America Market Value (USD Million) Forecast by Country, 2020-2035
  • Table 22: Latin America Market Volume (Units) Forecast by Country, 2020-2035
  • Table 23: Latin America Market Value (USD Million) Forecast by Product Type, 2020-2035
  • Table 24: Latin America Market Volume (Units) Forecast by Product Type, 2020-2035
  • Table 25: Latin America Market Value (USD Million) Forecast by Application Area, 2020-2035
  • Table 26: Latin America Market Volume (Units) Forecast by Application Area, 2020-2035
  • Table 27: Latin America Market Value (USD Million) Forecast by Channel, 2020-2035
  • Table 28: Latin America Market Volume (Units) Forecast by Channel, 2020-2035
  • Table 29: Latin America Market Value (USD Million) Forecast by User Group, 2020-2035
  • Table 30: Latin America Market Volume (Units) Forecast by User Group, 2020-2035
  • Table 31: Europe Market Value (USD Million) Forecast by Country, 2020-2035
  • Table 32: Europe Market Volume (Units) Forecast by Country, 2020-2035
  • Table 33: Europe Market Value (USD Million) Forecast by Product Type, 2020-2035
  • Table 34: Europe Market Volume (Units) Forecast by Product Type, 2020-2035
  • Table 35: Europe Market Value (USD Million) Forecast by Application Area, 2020-2035
  • Table 36: Europe Market Volume (Units) Forecast by Application Area, 2020-2035
  • Table 37: Europe Market Value (USD Million) Forecast by Channel, 2020-2035
  • Table 38: Europe Market Volume (Units) Forecast by Channel, 2020-2035
  • Table 39: Europe Market Value (USD Million) Forecast by User Group, 2020-2035
  • Table 40: Europe Market Volume (Units) Forecast by User Group, 2020-2035
  • Table 41: East Asia Market Value (USD Million) Forecast by Country, 2020-2035
  • Table 42: East Asia Market Volume (Units) Forecast by Country, 2020-2035
  • Table 43: East Asia Market Value (USD Million) Forecast by Product Type, 2020-2035
  • Table 44: East Asia Market Volume (Units) Forecast by Product Type, 2020-2035
  • Table 45: East Asia Market Value (USD Million) Forecast by Application Area, 2020-2035
  • Table 46: East Asia Market Volume (Units) Forecast by Application Area, 2020-2035
  • Table 47: East Asia Market Value (USD Million) Forecast by Channel, 2020-2035
  • Table 48: East Asia Market Volume (Units) Forecast by Channel, 2020-2035
  • Table 49: East Asia Market Value (USD Million) Forecast by User Group, 2020-2035
  • Table 50: East Asia Market Volume (Units) Forecast by User Group, 2020-2035
  • Table 51: South Asia & Pacific Market Value (USD Million) Forecast by Country, 2020-2035
  • Table 52: South Asia & Pacific Market Volume (Units) Forecast by Country, 2020-2035
  • Table 53: South Asia & Pacific Market Value (USD Million) Forecast by Product Type, 2020-2035
  • Table 54: South Asia & Pacific Market Volume (Units) Forecast by Product Type, 2020-2035
  • Table 55: South Asia & Pacific Market Value (USD Million) Forecast by Application Area, 2020-2035
  • Table 56: South Asia & Pacific Market Volume (Units) Forecast by Application Area, 2020-2035
  • Table 57: South Asia & Pacific Market Value (USD Million) Forecast by Channel, 2020-2035
  • Table 58: South Asia & Pacific Market Volume (Units) Forecast by Channel, 2020-2035
  • Table 59: South Asia & Pacific Market Value (USD Million) Forecast by User Group, 2020-2035
  • Table 60: South Asia & Pacific Market Volume (Units) Forecast by User Group, 2020-2035
  • Table 61: Middle East and Africa Market Value (USD Million) Forecast by Country, 2020-2035
  • Table 62: Middle East and Africa Market Volume (Units) Forecast by Country, 2020-2035
  • Table 63: Middle East and Africa Market Value (USD Million) Forecast by Product Type, 2020-2035
  • Table 64: Middle East and Africa Market Volume (Units) Forecast by Product Type, 2020-2035
  • Table 65: Middle East and Africa Market Value (USD Million) Forecast by Application Area, 2020-2035
  • Table 66: Middle East and Africa Market Volume (Units) Forecast by Application Area, 2020-2035
  • Table 67: Middle East and Africa Market Value (USD Million) Forecast by Channel, 2020-2035
  • Table 68: Middle East and Africa Market Volume (Units) Forecast by Channel, 2020-2035
  • Table 69: Middle East and Africa Market Value (USD Million) Forecast by User Group, 2020-2035
  • Table 70: Middle East and Africa Market Volume (Units) Forecast by User Group, 2020-2035

List of Figures

  • Figure 1: Global Market Value (USD Million) by Product Type, 2025-2035
  • Figure 2: Global Market Value (USD Million) by Application Area, 2025-2035
  • Figure 3: Global Market Value (USD Million) by Channel, 2025-2035
  • Figure 4: Global Market Value (USD Million) by User Group, 2025-2035
  • Figure 5: Global Market Value (USD Million) by Region, 2025-2035
  • Figure 6: Global Market Value (USD Million) Analysis by Region, 2020-2035
  • Figure 7: Global Market Volume (Units) Analysis by Region, 2020-2035
  • Figure 8: Global Market Value Share (%) and BPS Analysis by Region, 2025-2035
  • Figure 9: Global Market Y-o-Y Growth (%) Projections by Region, 2025-2035
  • Figure 10: Global Market Value (USD Million) Analysis by Product Type, 2020-2035
  • Figure 11: Global Market Volume (Units) Analysis by Product Type, 2020-2035
  • Figure 12: Global Market Value Share (%) and BPS Analysis by Product Type, 2025-2035
  • Figure 13: Global Market Y-o-Y Growth (%) Projections by Product Type, 2025-2035
  • Figure 14: Global Market Value (USD Million) Analysis by Application Area, 2020-2035
  • Figure 15: Global Market Volume (Units) Analysis by Application Area, 2020-2035
  • Figure 16: Global Market Value Share (%) and BPS Analysis by Application Area, 2025-2035
  • Figure 17: Global Market Y-o-Y Growth (%) Projections by Application Area, 2025-2035
  • Figure 18: Global Market Value (USD Million) Analysis by Channel, 2020-2035
  • Figure 19: Global Market Volume (Units) Analysis by Channel, 2020-2035
  • Figure 20: Global Market Value Share (%) and BPS Analysis by Channel, 2025-2035
  • Figure 21: Global Market Y-o-Y Growth (%) Projections by Channel, 2025-2035
  • Figure 22: Global Market Value (USD Million) Analysis by User Group, 2020-2035
  • Figure 23: Global Market Volume (Units) Analysis by User Group, 2020-2035
  • Figure 24: Global Market Value Share (%) and BPS Analysis by User Group, 2025-2035
  • Figure 25: Global Market Y-o-Y Growth (%) Projections by User Group, 2025-2035
  • Figure 26: Global Market Attractiveness by Product Type, 2025-2035
  • Figure 27: Global Market Attractiveness by Application Area, 2025-2035
  • Figure 28: Global Market Attractiveness by Channel, 2025-2035
  • Figure 29: Global Market Attractiveness by User Group, 2025-2035
  • Figure 30: Global Market Attractiveness by Region, 2025-2035
  • Figure 31: North America Market Value (USD Million) by Product Type, 2025-2035
  • Figure 32: North America Market Value (USD Million) by Application Area, 2025-2035
  • Figure 33: North America Market Value (USD Million) by Channel, 2025-2035
  • Figure 34: North America Market Value (USD Million) by User Group, 2025-2035
  • Figure 35: North America Market Value (USD Million) by Country, 2025-2035
  • Figure 36: North America Market Value (USD Million) Analysis by Country, 2020-2035
  • Figure 37: North America Market Volume (Units) Analysis by Country, 2020-2035
  • Figure 38: North America Market Value Share (%) and BPS Analysis by Country, 2025-2035
  • Figure 39: North America Market Y-o-Y Growth (%) Projections by Country, 2025-2035
  • Figure 40: North America Market Value (USD Million) Analysis by Product Type, 2020-2035
  • Figure 41: North America Market Volume (Units) Analysis by Product Type, 2020-2035
  • Figure 42: North America Market Value Share (%) and BPS Analysis by Product Type, 2025-2035
  • Figure 43: North America Market Y-o-Y Growth (%) Projections by Product Type, 2025-2035
  • Figure 44: North America Market Value (USD Million) Analysis by Application Area, 2020-2035
  • Figure 45: North America Market Volume (Units) Analysis by Application Area, 2020-2035
  • Figure 46: North America Market Value Share (%) and BPS Analysis by Application Area, 2025-2035
  • Figure 47: North America Market Y-o-Y Growth (%) Projections by Application Area, 2025-2035
  • Figure 48: North America Market Value (USD Million) Analysis by Channel, 2020-2035
  • Figure 49: North America Market Volume (Units) Analysis by Channel, 2020-2035
  • Figure 50: North America Market Value Share (%) and BPS Analysis by Channel, 2025-2035
  • Figure 51: North America Market Y-o-Y Growth (%) Projections by Channel, 2025-2035
  • Figure 52: North America Market Value (USD Million) Analysis by User Group, 2020-2035
  • Figure 53: North America Market Volume (Units) Analysis by User Group, 2020-2035
  • Figure 54: North America Market Value Share (%) and BPS Analysis by User Group, 2025-2035
  • Figure 55: North America Market Y-o-Y Growth (%) Projections by User Group, 2025-2035
  • Figure 56: North America Market Attractiveness by Product Type, 2025-2035
  • Figure 57: North America Market Attractiveness by Application Area, 2025-2035
  • Figure 58: North America Market Attractiveness by Channel, 2025-2035
  • Figure 59: North America Market Attractiveness by User Group, 2025-2035
  • Figure 60: North America Market Attractiveness by Country, 2025-2035
  • Figure 61: Latin America Market Value (USD Million) by Product Type, 2025-2035
  • Figure 62: Latin America Market Value (USD Million) by Application Area, 2025-2035
  • Figure 63: Latin America Market Value (USD Million) by Channel, 2025-2035
  • Figure 64: Latin America Market Value (USD Million) by User Group, 2025-2035
  • Figure 65: Latin America Market Value (USD Million) by Country, 2025-2035
  • Figure 66: Latin America Market Value (USD Million) Analysis by Country, 2020-2035
  • Figure 67: Latin America Market Volume (Units) Analysis by Country, 2020-2035
  • Figure 68: Latin America Market Value Share (%) and BPS Analysis by Country, 2025-2035
  • Figure 69: Latin America Market Y-o-Y Growth (%) Projections by Country, 2025-2035
  • Figure 70: Latin America Market Value (USD Million) Analysis by Product Type, 2020-2035
  • Figure 71: Latin America Market Volume (Units) Analysis by Product Type, 2020-2035
  • Figure 72: Latin America Market Value Share (%) and BPS Analysis by Product Type, 2025-2035
  • Figure 73: Latin America Market Y-o-Y Growth (%) Projections by Product Type, 2025-2035
  • Figure 74: Latin America Market Value (USD Million) Analysis by Application Area, 2020-2035
  • Figure 75: Latin America Market Volume (Units) Analysis by Application Area, 2020-2035
  • Figure 76: Latin America Market Value Share (%) and BPS Analysis by Application Area, 2025-2035
  • Figure 77: Latin America Market Y-o-Y Growth (%) Projections by Application Area, 2025-2035
  • Figure 78: Latin America Market Value (USD Million) Analysis by Channel, 2020-2035
  • Figure 79: Latin America Market Volume (Units) Analysis by Channel, 2020-2035
  • Figure 80: Latin America Market Value Share (%) and BPS Analysis by Channel, 2025-2035
  • Figure 81: Latin America Market Y-o-Y Growth (%) Projections by Channel, 2025-2035
  • Figure 82: Latin America Market Value (USD Million) Analysis by User Group, 2020-2035
  • Figure 83: Latin America Market Volume (Units) Analysis by User Group, 2020-2035
  • Figure 84: Latin America Market Value Share (%) and BPS Analysis by User Group, 2025-2035
  • Figure 85: Latin America Market Y-o-Y Growth (%) Projections by User Group, 2025-2035
  • Figure 86: Latin America Market Attractiveness by Product Type, 2025-2035
  • Figure 87: Latin America Market Attractiveness by Application Area, 2025-2035
  • Figure 88: Latin America Market Attractiveness by Channel, 2025-2035
  • Figure 89: Latin America Market Attractiveness by User Group, 2025-2035
  • Figure 90: Latin America Market Attractiveness by Country, 2025-2035
  • Figure 91: Europe Market Value (USD Million) by Product Type, 2025-2035
  • Figure 92: Europe Market Value (USD Million) by Application Area, 2025-2035
  • Figure 93: Europe Market Value (USD Million) by Channel, 2025-2035
  • Figure 94: Europe Market Value (USD Million) by User Group, 2025-2035
  • Figure 95: Europe Market Value (USD Million) by Country, 2025-2035
  • Figure 96: Europe Market Value (USD Million) Analysis by Country, 2020-2035
  • Figure 97: Europe Market Volume (Units) Analysis by Country, 2020-2035
  • Figure 98: Europe Market Value Share (%) and BPS Analysis by Country, 2025-2035
  • Figure 99: Europe Market Y-o-Y Growth (%) Projections by Country, 2025-2035
  • Figure 100: Europe Market Value (USD Million) Analysis by Product Type, 2020-2035
  • Figure 101: Europe Market Volume (Units) Analysis by Product Type, 2020-2035
  • Figure 102: Europe Market Value Share (%) and BPS Analysis by Product Type, 2025-2035
  • Figure 103: Europe Market Y-o-Y Growth (%) Projections by Product Type, 2025-2035
  • Figure 104: Europe Market Value (USD Million) Analysis by Application Area, 2020-2035
  • Figure 105: Europe Market Volume (Units) Analysis by Application Area, 2020-2035
  • Figure 106: Europe Market Value Share (%) and BPS Analysis by Application Area, 2025-2035
  • Figure 107: Europe Market Y-o-Y Growth (%) Projections by Application Area, 2025-2035
  • Figure 108: Europe Market Value (USD Million) Analysis by Channel, 2020-2035
  • Figure 109: Europe Market Volume (Units) Analysis by Channel, 2020-2035
  • Figure 110: Europe Market Value Share (%) and BPS Analysis by Channel, 2025-2035
  • Figure 111: Europe Market Y-o-Y Growth (%) Projections by Channel, 2025-2035
  • Figure 112: Europe Market Value (USD Million) Analysis by User Group, 2020-2035
  • Figure 113: Europe Market Volume (Units) Analysis by User Group, 2020-2035
  • Figure 114: Europe Market Value Share (%) and BPS Analysis by User Group, 2025-2035
  • Figure 115: Europe Market Y-o-Y Growth (%) Projections by User Group, 2025-2035
  • Figure 116: Europe Market Attractiveness by Product Type, 2025-2035
  • Figure 117: Europe Market Attractiveness by Application Area, 2025-2035
  • Figure 118: Europe Market Attractiveness by Channel, 2025-2035
  • Figure 119: Europe Market Attractiveness by User Group, 2025-2035
  • Figure 120: Europe Market Attractiveness by Country, 2025-2035
  • Figure 121: East Asia Market Value (USD Million) by Product Type, 2025-2035
  • Figure 122: East Asia Market Value (USD Million) by Application Area, 2025-2035
  • Figure 123: East Asia Market Value (USD Million) by Channel, 2025-2035
  • Figure 124: East Asia Market Value (USD Million) by User Group, 2025-2035
  • Figure 125: East Asia Market Value (USD Million) by Country, 2025-2035
  • Figure 126: East Asia Market Value (USD Million) Analysis by Country, 2020-2035
  • Figure 127: East Asia Market Volume (Units) Analysis by Country, 2020-2035
  • Figure 128: East Asia Market Value Share (%) and BPS Analysis by Country, 2025-2035
  • Figure 129: East Asia Market Y-o-Y Growth (%) Projections by Country, 2025-2035
  • Figure 130: East Asia Market Value (USD Million) Analysis by Product Type, 2020-2035
  • Figure 131: East Asia Market Volume (Units) Analysis by Product Type, 2020-2035
  • Figure 132: East Asia Market Value Share (%) and BPS Analysis by Product Type, 2025-2035
  • Figure 133: East Asia Market Y-o-Y Growth (%) Projections by Product Type, 2025-2035
  • Figure 134: East Asia Market Value (USD Million) Analysis by Application Area, 2020-2035
  • Figure 135: East Asia Market Volume (Units) Analysis by Application Area, 2020-2035
  • Figure 136: East Asia Market Value Share (%) and BPS Analysis by Application Area, 2025-2035
  • Figure 137: East Asia Market Y-o-Y Growth (%) Projections by Application Area, 2025-2035
  • Figure 138: East Asia Market Value (USD Million) Analysis by Channel, 2020-2035
  • Figure 139: East Asia Market Volume (Units) Analysis by Channel, 2020-2035
  • Figure 140: East Asia Market Value Share (%) and BPS Analysis by Channel, 2025-2035
  • Figure 141: East Asia Market Y-o-Y Growth (%) Projections by Channel, 2025-2035
  • Figure 142: East Asia Market Value (USD Million) Analysis by User Group, 2020-2035
  • Figure 143: East Asia Market Volume (Units) Analysis by User Group, 2020-2035
  • Figure 144: East Asia Market Value Share (%) and BPS Analysis by User Group, 2025-2035
  • Figure 145: East Asia Market Y-o-Y Growth (%) Projections by User Group, 2025-2035
  • Figure 146: East Asia Market Attractiveness by Product Type, 2025-2035
  • Figure 147: East Asia Market Attractiveness by Application Area, 2025-2035
  • Figure 148: East Asia Market Attractiveness by Channel, 2025-2035
  • Figure 149: East Asia Market Attractiveness by User Group, 2025-2035
  • Figure 150: East Asia Market Attractiveness by Country, 2025-2035
  • Figure 151: South Asia & Pacific Market Value (USD Million) by Product Type, 2025-2035
  • Figure 152: South Asia & Pacific Market Value (USD Million) by Application Area, 2025-2035
  • Figure 153: South Asia & Pacific Market Value (USD Million) by Channel, 2025-2035
  • Figure 154: South Asia & Pacific Market Value (USD Million) by User Group, 2025-2035
  • Figure 155: South Asia & Pacific Market Value (USD Million) by Country, 2025-2035
  • Figure 156: South Asia & Pacific Market Value (USD Million) Analysis by Country, 2020-2035
  • Figure 157: South Asia & Pacific Market Volume (Units) Analysis by Country, 2020-2035
  • Figure 158: South Asia & Pacific Market Value Share (%) and BPS Analysis by Country, 2025-2035
  • Figure 159: South Asia & Pacific Market Y-o-Y Growth (%) Projections by Country, 2025-2035
  • Figure 160: South Asia & Pacific Market Value (USD Million) Analysis by Product Type, 2020-2035
  • Figure 161: South Asia & Pacific Market Volume (Units) Analysis by Product Type, 2020-2035
  • Figure 162: South Asia & Pacific Market Value Share (%) and BPS Analysis by Product Type, 2025-2035
  • Figure 163: South Asia & Pacific Market Y-o-Y Growth (%) Projections by Product Type, 2025-2035
  • Figure 164: South Asia & Pacific Market Value (USD Million) Analysis by Application Area, 2020-2035
  • Figure 165: South Asia & Pacific Market Volume (Units) Analysis by Application Area, 2020-2035
  • Figure 166: South Asia & Pacific Market Value Share (%) and BPS Analysis by Application Area, 2025-2035
  • Figure 167: South Asia & Pacific Market Y-o-Y Growth (%) Projections by Application Area, 2025-2035
  • Figure 168: South Asia & Pacific Market Value (USD Million) Analysis by Channel, 2020-2035
  • Figure 169: South Asia & Pacific Market Volume (Units) Analysis by Channel, 2020-2035
  • Figure 170: South Asia & Pacific Market Value Share (%) and BPS Analysis by Channel, 2025-2035
  • Figure 171: South Asia & Pacific Market Y-o-Y Growth (%) Projections by Channel, 2025-2035
  • Figure 172: South Asia & Pacific Market Value (USD Million) Analysis by User Group, 2020-2035
  • Figure 173: South Asia & Pacific Market Volume (Units) Analysis by User Group, 2020-2035
  • Figure 174: South Asia & Pacific Market Value Share (%) and BPS Analysis by User Group, 2025-2035
  • Figure 175: South Asia & Pacific Market Y-o-Y Growth (%) Projections by User Group, 2025-2035
  • Figure 176: South Asia & Pacific Market Attractiveness by Product Type, 2025-2035
  • Figure 177: South Asia & Pacific Market Attractiveness by Application Area, 2025-2035
  • Figure 178: South Asia & Pacific Market Attractiveness by Channel, 2025-2035
  • Figure 179: South Asia & Pacific Market Attractiveness by User Group, 2025-2035
  • Figure 180: South Asia & Pacific Market Attractiveness by Country, 2025-2035
  • Figure 181: Middle East and Africa Market Value (USD Million) by Product Type, 2025-2035
  • Figure 182: Middle East and Africa Market Value (USD Million) by Application Area, 2025-2035
  • Figure 183: Middle East and Africa Market Value (USD Million) by Channel, 2025-2035
  • Figure 184: Middle East and Africa Market Value (USD Million) by User Group, 2025-2035
  • Figure 185: Middle East and Africa Market Value (USD Million) by Country, 2025-2035
  • Figure 186: Middle East and Africa Market Value (USD Million) Analysis by Country, 2020-2035
  • Figure 187: Middle East and Africa Market Volume (Units) Analysis by Country, 2020-2035
  • Figure 188: Middle East and Africa Market Value Share (%) and BPS Analysis by Country, 2025-2035
  • Figure 189: Middle East and Africa Market Y-o-Y Growth (%) Projections by Country, 2025-2035
  • Figure 190: Middle East and Africa Market Value (USD Million) Analysis by Product Type, 2020-2035
  • Figure 191: Middle East and Africa Market Volume (Units) Analysis by Product Type, 2020-2035
  • Figure 192: Middle East and Africa Market Value Share (%) and BPS Analysis by Product Type, 2025-2035
  • Figure 193: Middle East and Africa Market Y-o-Y Growth (%) Projections by Product Type, 2025-2035
  • Figure 194: Middle East and Africa Market Value (USD Million) Analysis by Application Area, 2020-2035
  • Figure 195: Middle East and Africa Market Volume (Units) Analysis by Application Area, 2020-2035
  • Figure 196: Middle East and Africa Market Value Share (%) and BPS Analysis by Application Area, 2025-2035
  • Figure 197: Middle East and Africa Market Y-o-Y Growth (%) Projections by Application Area, 2025-2035
  • Figure 198: Middle East and Africa Market Value (USD Million) Analysis by Channel, 2020-2035
  • Figure 199: Middle East and Africa Market Volume (Units) Analysis by Channel, 2020-2035
  • Figure 200: Middle East and Africa Market Value Share (%) and BPS Analysis by Channel, 2025-2035
  • Figure 201: Middle East and Africa Market Y-o-Y Growth (%) Projections by Channel, 2025-2035
  • Figure 202: Middle East and Africa Market Value (USD Million) Analysis by User Group, 2020-2035
  • Figure 203: Middle East and Africa Market Volume (Units) Analysis by User Group, 2020-2035
  • Figure 204: Middle East and Africa Market Value Share (%) and BPS Analysis by User Group, 2025-2035
  • Figure 205: Middle East and Africa Market Y-o-Y Growth (%) Projections by User Group, 2025-2035
  • Figure 206: Middle East and Africa Market Attractiveness by Product Type, 2025-2035
  • Figure 207: Middle East and Africa Market Attractiveness by Application Area, 2025-2035
  • Figure 208: Middle East and Africa Market Attractiveness by Channel, 2025-2035
  • Figure 209: Middle East and Africa Market Attractiveness by User Group, 2025-2035
  • Figure 210: Middle East and Africa Market Attractiveness by Country, 2025-2035

Frequently Asked Questions

How big is the Global Hair Regrowth Treatments Market in 2025?

The Global Hair Regrowth Treatments Market is estimated to be valued at USD 7,803.6 million in 2025.

What will be the size of the Global Hair Regrowth Treatments Market in 2035?

The market size for the Global Hair Regrowth Treatments Market is projected to reach USD 16,902.7 million by 2035.

How much will be the Global Hair Regrowth Treatments Market growth between 2025 and 2035?

The Global Hair Regrowth Treatments Market is expected to grow at a 8.0% CAGR between 2025 and 2035.

What are the key product types in the Global Hair Regrowth Treatments Market?

The key product types in the Global Hair Regrowth Treatments Market are topical minoxidil solutions, oral supplements, laser therapy devices, and natural/herbal oils.

Which application area segment will contribute significant share in the Global Hair Regrowth Treatments Market in 2025?

In terms of application area, the scalp hair loss segment is projected to command 72.1% share in the Global Hair Regrowth Treatments Market in 2025.

Explore Similar Insights

Future Market Insights

Hair Regrowth Treatments Market

Chat With

MaRIA

Hi There, I am MaRIA, Your Market Research Intelligence Assistant. How may I help you?