

- Market Size (2026)
- USD 380.6 Mn
- Forecast (2036)
- USD 675.2 Mn
- CAGR (2026 to 2036)
- 5.9%
How big is the Dust Deposition Gauge Market in 2026?
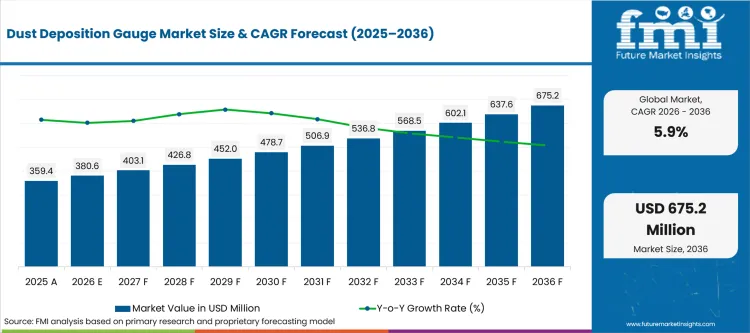
USD 380.6 million in 2026 and USD 675.2 million by 2036 at a 5.9% CAGR.
Demand for dust deposition gauges stood at USD 380.6 million in 2026, with the market reaching USD 675.2 million by 2036 at a 5.9% CAGR. Growth is driven by plant engineers, project owners, and maintenance teams treating dustfall monitoring as a lead indicator for equipment wear and outage risk, since particulate buildup on machinery and infrastructure raises maintenance frequency and can shorten equipment life when it goes untracked. Mining sites, cement plants, construction projects, and industrial facilities near sensitive boundaries use these gauges to catch deposition trends early enough to schedule cleaning or maintenance before it turns into unplanned downtime.
Gauge reliability under harsh field conditions, the labor cost of manual sample collection and analysis, and inconsistent calibration across sites work against faster adoption, and a gauge that fails or drifts in the field creates exactly the kind of surprise maintenance event operators are trying to avoid. Infrastructure and environmental-safety standards help frame where deposition monitoring is required, but individual buyers still weigh field performance data and local service coverage before standardizing on a supplier. The clearer opportunities lie in automated and remote-reporting gauges that cut manual sample handling, ruggedized designs for extreme climates, and service models that bundle field maintenance with the hardware itself. By gauge type, monitoring method, and end-use industry, reliability requirements and service expectations differ enough to warrant separate treatment. Regionally, mining and heavy-industry regions drive volume demand for ruggedized units, while regions with stricter environmental-compliance monitoring push adoption of automated, continuously reporting gauges.
Key Takeaways of Dust Deposition Gauge Market
- Demand for dust deposition gauges is driven by industrial operators prioritizing dustfall measurement reliability, equipment uptime, and regulatory compliance for environmental monitoring programs.
- By sales channel, direct OEM is expected to lead with 57.6% share in 2026, supported by stronger service response and supplier accountability.
- Directional dustfall monitoring is the dominant technology segment, projected to hold 41.3% share in 2026, driven by reliable measurement performance and application suitability.
- Mining is estimated to lead the application category with 35.7% share in 2026, supported by continuous environmental monitoring and dust management requirements.
- Product consistency and technical documentation remain critical to supplier evaluation, as organizations expand procurement when gauges reduce maintenance effort and improve process control.
- India and China are expected to form the higher-growth country tier, advancing at 8.15% and 7.15% CAGR respectively through 2036, supported by expanding industrial activity and infrastructure development.
- Competition centers on SDEC France, DustScanAQ, Casella, SKC, Gradko, ENVEA, Turnkey Instruments, Tisch Environmental, Ecotech, and Aeroqual, with vendors differentiating through measurement accuracy, technical documentation, and field support.
Analyst Perspective
"Demand for dust deposition gauges is being shaped by the growing need for dependable environmental monitoring across industrial facilities, mining sites, and infrastructure projects. End users are selecting solutions that deliver consistent measurement accuracy under varying field conditions while supporting environmental reporting and regulatory compliance. Manufacturers that provide durable instruments, clear calibration guidance, and reliable field service are expected to strengthen customer trust and secure long-term monitoring programs."
- Nikhil Kaitwade, Principal Consultant for Industrial Products at Future Market Insights
How is the Dust Deposition Gauge Market segmented?
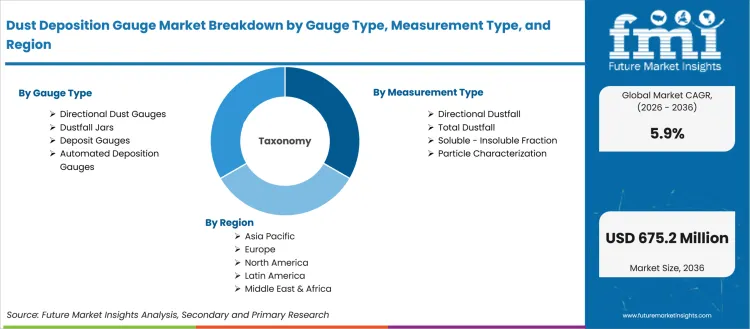
The dust deposition gauge industry is segmented by Gauge Type, Measurement Type and Application; End Use and Sales Channel complete the forecast structure.
Gauge type distinguishes the physical instrument design used to collect dustfall, since directional and non-directional gauge configurations capture particulate differently depending on site wind conditions. Measurement Type separates the specific data output the gauge is built to capture, because directional versus total dustfall readings serve different diagnostic purposes for a site operator. Application identifies the industrial setting the gauge is deployed into, since mining, construction, and other sites carry different dust-load intensities and regulatory reporting burdens. End Use shows which organization operates or analyzes the collected data, because a lab's data-processing needs differ from a site's own monitoring team. Sales Channel captures the buying route through which the gauge reaches the end user, each carrying different service and calibration support expectations.
How does Direct OEM influence Dust Deposition Gauge Market buying within By Sales Channel?
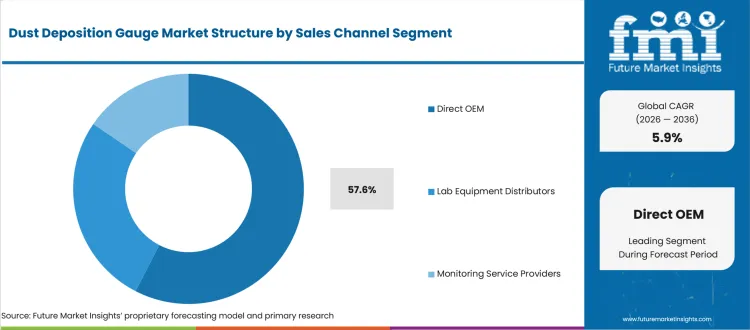
Instrument manufacturers selling direct to end users bypass the distributor layer, which matters for environmental compliance teams that need calibration records and field support tied to a single accountable source rather than a reseller relationship. Mining and environmental monitoring operators are the primary buyers through this channel, and the deciding factor is whether the manufacturer can maintain dustfall measurement reliability and respond quickly when field maintenance is needed at a remote site.
- Direct OEM represents 57.6% of Sales Channel in 2026, equal to USD 219.3 million, rising from USD 207.0 million in 2025 to USD 388.9 million by 2036, reflecting how compliance-driven buyers favor a direct manufacturer relationship over a distributor when calibration traceability matters.
- Field maintenance response time shapes repeat orders here, since a gauge deployed at a remote mining or industrial site that fails without quick support disrupts a facility's regulatory monitoring record. Manufacturers offering fast field service retain accounts through renewal cycles.
Where does Directional Dustfall create value in the By Measurement Type category?
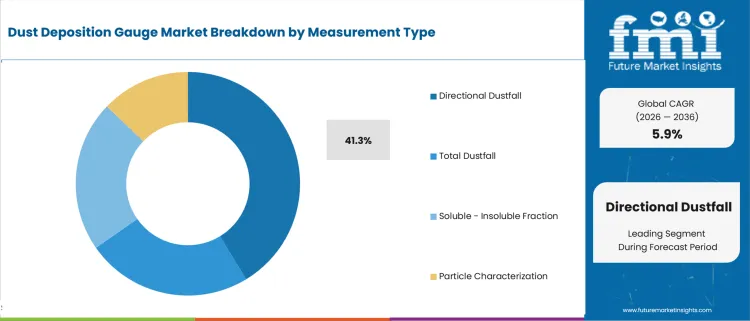
Directional dustfall measurement gives site operators wind-direction context a total dustfall reading can't provide, which matters when a facility needs to trace particulate back to a specific source for a regulatory dispute or community complaint. Mining and industrial site monitoring teams are the primary users, and the deciding factor is whether the gauge's directional accuracy holds steady across variable wind conditions in the field.
- Directional dustfall holds 41.3% share of Measurement Type in 2026 at USD 157.2 million, growing from USD 148.4 million in 2025 to USD 278.9 million by 2036, reflecting the added diagnostic value directional data offers over a simple total dustfall count.
- Repeat purchasing depends on measurement consistency across changing field conditions, since a gauge whose directional readings drift during high wind undermines the source-tracing case operators rely on it for. Suppliers demonstrating stable field performance retain site-monitoring contracts.
What keeps Mining relevant within By Application?
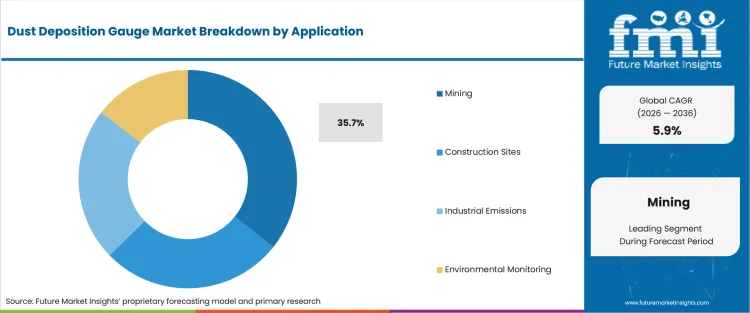
Mining sites generate dust loads intense and continuous enough that regulatory monitoring becomes a standing operational requirement rather than a periodic check, unlike lower-dust applications where monitoring can be more occasional. Site environmental teams are the primary buyers, and the deciding factor is whether dustfall measurement reliability holds up under the harsh field conditions a mine site presents, including vibration, dust accumulation on the instrument itself, and extreme temperature swings.
- Mining contributes 35.7% share of Application in 2026 at USD 135.9 million, growing from USD 128.3 million in 2025 to USD 241.0 million by 2036, reflecting the application's need for continuous rather than periodic dust monitoring relative to lighter-duty industrial sites.
- Field durability determines whether a gauge earns repeat orders at a mining site, since an instrument that fails or fouls quickly under harsh conditions creates monitoring gaps a compliance program can't tolerate. Suppliers building for that environment see stronger renewal rates than general-purpose gauge makers.
How should buyers read Directional Dust Gauges demand within By Gauge Type?
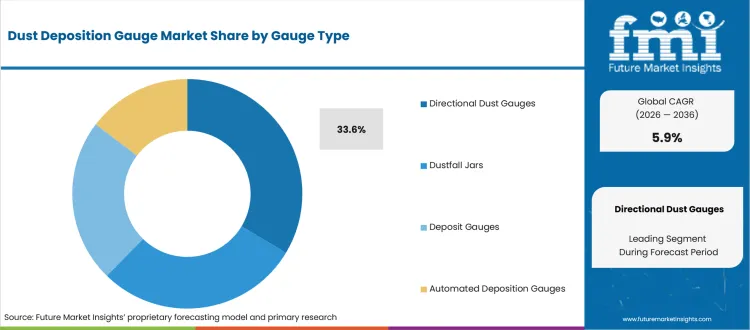
Directional dust gauges are built around a physical design that captures wind-direction data alongside particulate volume, which matters for facilities needing to identify a specific emission source rather than just confirm a dust problem exists. Environmental compliance teams and industrial site operators are the primary buyers, and the deciding factor is whether the gauge's mechanical design holds its directional accuracy over extended outdoor deployment.
- Directional dust gauges account for 33.6% share of Gauge Type in 2026, rising from USD 120.8 million in 2025 to USD 127.9 million in 2026 and reaching USD 226.9 million by 2036, reflecting demand for source-attribution data over simple total dustfall counts.
- Field maintenance needs shape long-term account retention, since a directional gauge exposed to weather and dust accumulation needs periodic cleaning and recalibration to hold its accuracy. Suppliers with accessible field-service support keep operators from switching to a competing gauge design.
Why is Environmental Labs still important in By End Use?
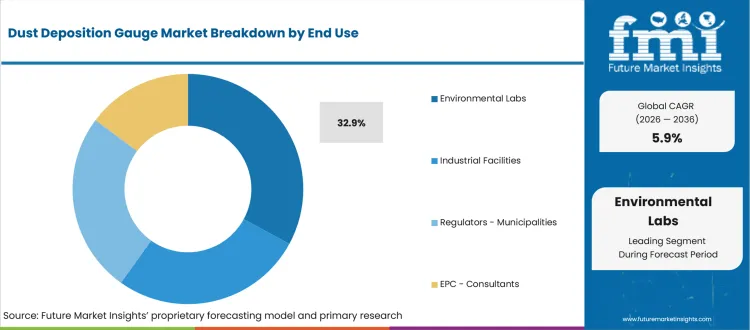
Environmental labs process and interpret the raw dustfall data a site gauge collects, which puts them in a different operating role than the site team managing the instrument itself, one focused on data accuracy and regulatory reporting rather than field deployment. Lab technicians and compliance analysts are the primary users of this end-use category, and the deciding factor is whether the data coming off the gauge is reliable enough to support a defensible regulatory report without requiring extensive manual correction.
- Environmental labs stand at 32.9% share of End Use in 2026, equal to USD 125.2 million, moving from USD 118.2 million in 2025 to USD 222.1 million by 2036, reflecting the lab's distinct role in data interpretation rather than direct field instrument operation.
- Data reliability drives repeat business for labs working with gauge manufacturers, since inconsistent or unreliable dustfall readings create rework and undermine the lab's own regulatory reporting credibility. Manufacturers supplying consistent, well-calibrated data retain lab partnerships over time.
What factors shape the Dust Deposition Gauge Market?
Dust deposition gauge market purchases are being shaped by uptime risk, compliance pressure, lifecycle cost; and integration burden.
- Driver: dustfall measurement reliability and field maintenance. Demand strengthens when buyers can connect the purchase to a measurable operating, formulation, compliance; or cost outcome in Dust Deposition Gauge Market.
- Restraint: proof burden and implementation risk. Adoption slows when Dust Deposition Gauge Market buyers cannot validate dustfall measurement reliability and field maintenance under their own operating conditions.
- Opportunity: supplier programs built around dustfall measurement reliability and field maintenance. The better opening is with vendors that make approval easier through field support, clear proof, and repeatable execution.
Dust deposition gauge market demand is strongest where the product reduces an operating risk that buyers can measure. Engineering and procurement teams need proof that the system improves uptime, compliance, inspection; data accuracy; or service cost before it becomes a standard purchase.
Supplier pressure is strongest where Dust Deposition Gauge Market buyers need proof before changing an approved route. Evidence quality and service response decide whether the first order becomes recurring spend.
Adoption can still slow when Dust Deposition Gauge Market buyers do not know who owns rollout support. Vendors that define responsibility early have a cleaner path to repeat orders.
Which country CAGRs are profiled in the Dust Deposition Gauge Market?
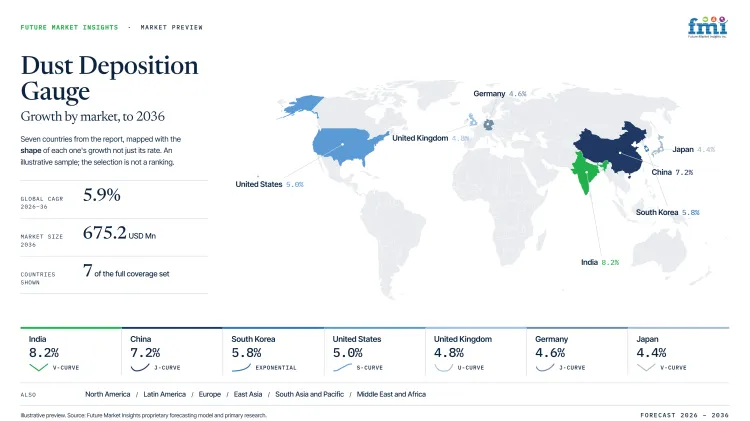
| Country | CAGR |
|---|---|
| United States | 4.95% |
| China | 7.15% |
| India | 8.15% |
| Germany | 4.55% |
| United Kingdom | 4.75% |
| Japan | 4.35% |
| South Korea | 5.75% |
| Rest of World | 6.15% |
How do country-level CAGRs compare in the Dust Deposition Gauge Market?
The country comparison spans 3.8 percentage points and forms four recognizable growth bands across the dust deposition gauge market. India and China occupy the highest tier with a 1.0-point difference between them. Rest of World and South Korea create the next group, separated by 0.4 percentage points. The United States, the United Kingdom and Germany remain closely aligned within a 0.4-point range, while Japan sits just 0.2 percentage points below Germany. The variation reflects differences in environmental monitoring requirements, industrial dust surveillance and long-term particulate deposition measurement programs.
- India leads the comparison with a CAGR of 8.15%. Greater emphasis on ambient dust monitoring around mining operations, construction activity and industrial clusters is encouraging wider deployment of dust deposition gauges for long-term environmental assessment.
- China follows at 7.15%, remaining 1.0 percentage point below India. Continued expansion of environmental monitoring networks and routine dustfall measurement around manufacturing facilities and urban development projects reinforces demand for deposition gauges.
- Rest of World records a CAGR of 6.15%, standing 1.0 percentage point behind China. Growth reflects increasing adoption of dust deposition monitoring across emerging economies where environmental compliance and air quality observation are receiving greater attention.
- South Korea reaches 5.75%, only 0.4 percentage points below Rest of World. Demand is associated with industrial environmental monitoring and the use of dust deposition gauges to evaluate particulate accumulation over extended observation periods.
- The United States posts a CAGR of 4.95%, trailing South Korea by 0.8 percentage points. Market activity is linked to environmental monitoring around industrial facilities, infrastructure projects and research programs that require consistent dustfall measurement.
- At 4.75%, the United Kingdom sits just 0.2 percentage points behind the United States. Continued monitoring of particulate deposition in urban and industrial environments supports the use of standardized dust collection equipment for environmental reporting.
- Germany records a CAGR of 4.55%, leaving only a 0.2-point difference from the United Kingdom. The market benefits from established environmental monitoring practices and ongoing use of dust deposition gauges for industrial site assessment and regulatory observation.
- Japan completes the comparison with a CAGR of 4.35%, only 0.2 percentage points below Germany. Demand reflects continued application of precision environmental monitoring equipment for measuring long-term particulate deposition across industrial and research settings.
Comparable CAGRs can still produce different market entry conditions. Differences in environmental regulations, industrial emission monitoring practices, monitoring network coverage and investment in air quality infrastructure influence adoption patterns and long-term commercial opportunities. The full report provides country-level CAGR analysis across North America, Latin America, Europe, East Asia, South Asia, Oceania and the Middle East and Africa.
Country-wise Analysis
- United States rises from USD 89.85 million in 2025 to USD 95.15 million in 2026. By 2036, it reaches USD 154.3 million at a 4.95% CAGR. United States buyers treat the Dust Deposition Gauge Market as a dustfall measurement reliability and field maintenance decision. Approval usually needs measurable operating proof before volume moves from existing suppliers.
- China moves from USD 57.50 million in 2025 to USD 60.90 million in 2026. The 2036 value stands at USD 121.5 million, supported by a 7.15% CAGR. China's buying condition is scale plus execution discipline in the Dust Deposition Gauge Market. Suppliers need availability, channel control, and proof that dustfall measurement reliability and field maintenance can hold across fast-ramping accounts.
- India is estimated at USD 35.94 million in 2025 and USD 38.06 million in 2026. It reaches USD 83.29 million by 2036, with an 8.15% CAGR. India demand is tied to formal buyer evaluation and wider production activity in the Dust Deposition Gauge Market. Cost remains a hard filter, so suppliers need a price case that still supports dustfall measurement reliability and field maintenance.
- Germany stands at USD 32.35 million in 2025 and USD 34.25 million in 2026. By 2036, the value climbs to USD 53.46 million at a 4.55% CAGR. Germany is qualification-led for the Dust Deposition Gauge Market. Technical review focuses on whether dustfall measurement reliability and field maintenance can be proven before commercial negotiation.
- United Kingdom rises from USD 21.56 million in 2025 to USD 22.84 million in 2026. By 2036, it reaches USD 36.33 million at a 4.75% CAGR. United Kingdom buyers in the Dust Deposition Gauge Market place more weight on vendor accountability and delivery reliability. Switching costs rise when dustfall measurement reliability and field maintenance is not supported after purchase.
- Japan moves from USD 25.16 million in 2025 to USD 26.64 million in 2026. The 2036 value stands at USD 40.79 million, supported by a 4.35% CAGR. Japan's approval cycle for the Dust Deposition Gauge Market favors suppliers that reduce inspection work and keep dustfall measurement reliability and field maintenance consistent across repeat orders.
- South Korea is estimated at USD 14.38 million in 2025 and USD 15.22 million in 2026. It reaches USD 26.63 million by 2036, with a 5.75% CAGR. South Korea's compact supply chains make Dust Deposition Gauge Market feedback fast. Suppliers need responsive support because weak execution on dustfall measurement reliability and field maintenance can affect production schedules.
- Rest of World stands at USD 82.66 million in 2025 and USD 87.54 million in 2026. By 2036, the value climbs to USD 159.0 million at a 6.15% CAGR. Rest of World demand for the Dust Deposition Gauge Market is uneven. Local service access and import reliability matter where buyers need help proving dustfall measurement reliability and field maintenance without mature support networks.
Who are the notable companies in the Dust Deposition Gauge Market?
SDEC France; DustScanAQ; Casella; SKC; Gradko; ENVEA; Turnkey Instruments; Tisch Environmental; Ecotech and Aeroqual are the notable companies assessed in this market.
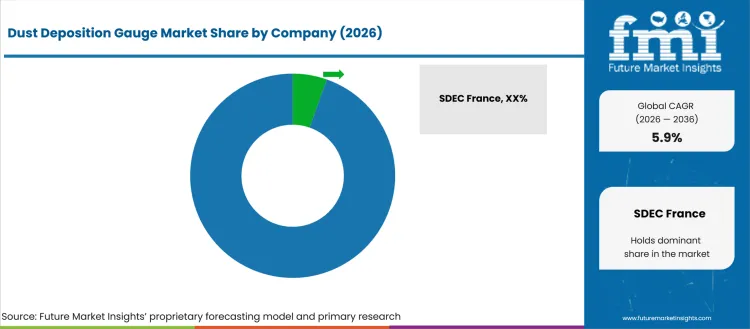
Dust Deposition Gauge Market competition is strongest where suppliers can connect technical performance with operating accountability. Buyers compare who can reduce downtime, compliance exposure, inspection burden; or integration risk after purchase.
- Dust monitoring and gauge suppliers such as SDEC France, DustScanAQ, Casella and SKC matter when buyers compare supplier fit against the approval burden. Their value depends on evidence quality and service response after selection.
- Environmental monitoring suppliers such as Gradko, ENVEA, Turnkey Instruments and Tisch Environmental are useful where procurement needs a supplier role that is clear before volume expands. Buyers check whether the group can support the use case after approval.
- Air-quality instrument companies such as Ecotech and Aeroqual matter when buyers compare supplier fit against the approval burden. Their value depends on evidence quality and service response after selection.
Competitive Benchmarking: Dust Deposition Gauge Market
| Company | Specification Fit | Service Capability | Project Support | Geographic Footprint |
|---|---|---|---|---|
| SDEC France | High | High | Strong | Global |
| DustScanAQ | High | Medium | Strong | Global |
| Casella | Strong | High | Medium | Global or regional |
| SKC | Medium | High | Medium | Regional |
| Gradko | Strong | Medium | Medium | Regional or global |
| ENVEA | High | High | Strong | Global |
| Turnkey Instruments | High | Medium | Strong | Global |
| Tisch Environmental | Strong | High | Medium | Global or regional |
| Ecotech | Medium | High | Medium | Regional |
| Aeroqual | Strong | Medium | Medium | Regional or global |
Source: Future Market Insights competitive analysis, 2026. Ratings for Dust Deposition Gauge Market reflect specification fit, implementation support, lifecycle service capability; channel reach; and relevance to operating-risk reduction.
Key Players in the Dust Deposition Gauge Market
Dust monitoring and gauge suppliers
- SDEC France
- DustScanAQ
- Casella
- SKC
Environmental monitoring suppliers
- Gradko
- ENVEA
- Turnkey Instruments
- Tisch Environmental
Air-quality instrument companies
- Ecotech
- Aeroqual
Dust Deposition Gauge Market - Report Scope
| Coverage field | Report scope |
|---|---|
| Market breakdown | Dust Deposition Gauge Market Breakdown By Gauge Type, By Measurement Type and By Application; End Use and By Sales Channel |
| Market Definition | Commercial demand for products; services covered under Dust Deposition Gauge Market; including country demand; segment demand; and supplier-selection context |
| Regions Covered | North America; Latin America; Europe; East Asia; South Asia and Pacific; Middle East and Africa |
| Countries Covered | United States; United Kingdom; Germany; France; Japan; China; South Korea; India; and 30+ countries |
| Key Companies Profiled | SDEC France; DustScanAQ; Casella; SKC; Gradko; ENVEA; Turnkey Instruments; Tisch Environmental; Ecotech; and Aeroqual |
| Forecast Period | 2026 to 2036 |
| Approach | Dust Deposition Gauge Market: Installed-base demand, project and replacement cycles, country infrastructure context; segment shares; and supplier relevance were used to build the sizing approach. |
Dust Deposition Gauge Market - Research Methodology
| Method | Approach |
|---|---|
| Primary Research | FMI analysts gathered input from manufacturers, service providers, technology developers, distributors, end users, procurement teams, and subject-matter experts. Interviews examined purchasing decisions, product or service evaluation, adoption barriers, approval requirements, pricing considerations, and expectations for technical or commercial support. Respondents were also asked what evidence is required before a trial, pilot, or initial order develops into regular purchasing. |
| Desk Research | Desk research covered government statistics, regulatory publications, trade data, industry associations, technical literature, standards, company filings, product information, and official corporate announcements. Sources were reviewed for relevance, publication date, geographic coverage, and consistency with the defined market scope. Claims relating to performance, applications, approvals, capacity, investment, and commercial activity were retained only when supported by credible public evidence. |
| Market Sizing and Forecasting | The market model combined the baseline value with historical performance, segment structure, pricing and volume indicators, adoption levels, company participation, and country-level demand conditions. Forecast assumptions considered economic activity, investment trends, regulatory developments, technology adoption, purchasing cycles, supply availability, and barriers to wider market use. Segment and regional estimates were reconciled before the final market total was calculated. |
| Data Validation | Estimates were checked against multiple independent indicators, including public data, company activity, trade patterns, industry developments, and findings from primary interviews. Validation also tested whether products, services, applications, and company revenues fell within the defined market boundaries. Adjacent categories, unsupported claims, overlapping revenues, and activities without direct market relevance were excluded to reduce double counting and maintain consistency across segments and countries. |
Dust Deposition Gauge Market by Segments
Dust Deposition Gauge Market segmented by Gauge Type:
- Deposit Gauges
- Dustfall Jars
- Directional Dust Gauges
- Automated Deposition Gauges
Dust Deposition Gauge Market segmented by Measurement Type:
- Total Dustfall
- Directional Dustfall
- Soluble / Insoluble Fraction
- Particle Characterization
Dust Deposition Gauge Market segmented by Application:
- Mining
- Construction Sites
- Industrial Emissions
- Environmental Monitoring
Dust Deposition Gauge Market segmented by End Use:
- Environmental Labs
- Industrial Facilities
- Regulators / Municipalities
- EPC / Consultants
Dust Deposition Gauge Market segmented by Sales Channel:
- Direct OEM
- Lab Equipment Distributors
- Monitoring Service Providers
Research Sources and Bibliography
Secondary validation for Dust Deposition Gauge Market uses air-quality evidence, environmental monitoring, mining exposure and trade references together. WHO, EPA and EEA sources explain why monitoring matters. World Bank and trade data help test where industrial exposure can support demand.
- 1. WHO Air Pollution. https://www.who.int/health-topics/air-pollution. Public-health context used to frame air-quality monitoring need.
- 2. USA EPA AirData. https://www.epa.gov/outdoor-air-quality-data. Monitoring data context used to ground pollutant and measurement references.
- 3. European Environment Agency Air Quality. https://www.eea.europa.eu/en/topics/in-depth/air-pollution. Regional air-quality evidence used to compare monitoring pressure.
- 4. UNEP Pollution Action. https://www.unep.org/explore-topics/chemicals-waste/what-we-do/pollution-action. Environmental policy context used to avoid narrow equipment-only framing.
- 5. World Bank Data. https://data.worldbank.org/. Industrial and urban indicators used to test country exposure.
- 6. UN Comtrade. https://comtradeplus.un.org/. Trade flows used to test monitoring-equipment and industrial-demand exposure.
- 7. SDEC France. https://www.sdec-france.com/. Official company and product portfolio information used for competitive context.
- 8. DustScanAQ. https://www.dustscan.co.uk/. Official company and product portfolio information used for competitive context.
- 9. Casella. https://www.casellasolutions.com/. Official company and product portfolio information used for competitive context.
- 10. SKC. https://www.skcinc.com/. Official company and product portfolio information used for competitive context.
- 11. Gradko. https://www.gradko.com/. Official company and product portfolio information used for competitive context.
- 12. ENVEA. https://www.envea.global/. Official company and product portfolio information used for competitive context.
- 13. Turnkey Instruments. https://www.turnkey-instruments.com/. Official company and product portfolio information used for competitive context.
This Report Answers
- What value is forecast for the Dust Deposition Gauge Market in 2026 and by 2036?
- What CAGR is forecast for the Dust Deposition Gauge Market during the 2026 to 2036 period?
- Which segment groups are used to assess demand across Dust Deposition Gauge Market?
- Which buyer problems are creating procurement interest in Dust Deposition Gauge Market?
- How do the main segment shares shape Dust Deposition Gauge Market decisions in the 2026 base?
- Which countries are profiled in the Dust Deposition Gauge Market forecast and how do their CAGRs differ?
- Which companies are assessed in this market?
- What should Dust Deposition Gauge Market buyers evaluate before changing suppliers?
- How does FMI size and validate Dust Deposition Gauge Market country and segment demand?
- What risks could delay Dust Deposition Gauge Market adoption, qualification, or repeat purchasing?
Frequently Asked Questions
Why should executives track the Dust Deposition Gauge Market?
Executives should track Dust Deposition Gauge Market because dustfall measurement reliability and field maintenance affects procurement risk and operating performance. The value is in knowing where the purchase can reduce cost, avoid disruption, or improve buyer confidence.
What business problem does the Dust Deposition Gauge Market address?
The market addresses downtime, equipment reliability, safety; and lifecycle cost. Buyers use the category when routine procurement is no longer enough to manage performance and documentation. Service and continuity expectations also shape the decision.
What should Dust Deposition Gauge Market procurement leaders evaluate before selecting suppliers?
Dust Deposition Gauge Market procurement leaders should test specification fit, installation burden, service coverage; lifecycle cost; and integration risk. A lower unit price is weak if downtime, commissioning, or maintenance cost rises after purchase.
What can limit return on investment for buyers?
Dust Deposition Gauge Market payback depends on whether the product lowers downtime, inspection effort, compliance exposure; rework; or lifecycle cost. Buyers reduce risk by setting acceptance tests and service responsibilities before rollout.
How can suppliers build executive confidence?
Dust Deposition Gauge Market suppliers build confidence when they can support specification review, installation, commissioning; and service response after approval. Buyers value partners that keep the system usable in the field.
Preview the report firsthand - request a free sample
Get SampleGet the brochure for pricing and purchase details.
Get PDFTable of Content
- Key Takeaways
- Market Size and CAGR
- Top Growth Driver
- Fastest Growing Segment
- Leading Region
- Key Companies
- Emerging Opportunities
- Executive Summary
- Global Market Outlook
- Demand-side Trends
- Supply-side Trends
- Technology Roadmap Analysis
- Analysis and Recommendations
- Analyst Perspective (What is happening? Why now? What should investors know?)
- Key Questions Answered
- How large is the market?
- What is the CAGR?
- What are key trends?
- Which region dominates?
- Who are the leaders?
- Market Overview
- Market Coverage / Taxonomy
- Market Definition / Scope / Limitations
- Research Methodology
- Chapter Orientation
- Analytical Lens and Working Hypotheses
- Market Structure, Signals, and Trend Drivers
- Benchmarking and Cross-market Comparability
- Market Sizing, Forecasting, and Opportunity Mapping
- Research Design and Evidence Framework
- Desk Research Programme (Secondary Evidence)
- Expert Input and Fieldwork (Primary Evidence)
- Tooling, Models, and Reference Databases
- Data Engineering and Model Build
- Quality Assurance and Audit Trail
- Market Background
- Market Dynamics (Drivers, Restraints, Opportunity, Trends)
- Scenario Forecast (Optimistic, Likely, Conservative)
- Impact Analysis
- AI Impact
- Sustainability Impact
- Regulatory Impact
- Technology Impact
- Consumer / Buyer Analysis
- Purchase Drivers
- Adoption Barriers
- Buyer Journey
- Opportunity Map Analysis
- Product Life Cycle Analysis
- Supply Chain Analysis
- Investment Feasibility Matrix
- Value Chain Analysis
- PESTLE and Porter's Analysis
- Regulatory Landscape
- Regional Parent Market Outlook
- Production and Consumption Statistics
- Import and Export Statistics
- Global Market Analysis and Forecast, 2021 to 2036
- Historical Market Size Value (USD Million) Analysis, 2021 to 2025
- Current and Future Market Size Value (USD Million) Projections, 2026 to 2036
- Y-o-Y Growth Trend Analysis
- Absolute $ Opportunity Analysis
- Global Market Pricing Analysis, 2021 to 2036
- Global Market Analysis and Forecast, By Gauge Type, 2021 to 2036
- Introduction / Key Findings
- Historical Market Size Value (USD Million) Analysis By Gauge Type, 2021 to 2025
- Current and Future Market Size Value (USD Million) Analysis and Forecast By Gauge Type, 2026 to 2036
- Directional Dust Gauges
- Dustfall Jars
- Deposit Gauges
- Automated Deposition Gauges
- Directional Dust Gauges
- Y-o-Y Growth Trend Analysis By Gauge Type, 2021 to 2025
- Absolute $ Opportunity Analysis By Gauge Type, 2026 to 2036
- Global Market Analysis and Forecast, By Measurement Type, 2021 to 2036
- Introduction / Key Findings
- Historical Market Size Value (USD Million) Analysis By Measurement Type, 2021 to 2025
- Current and Future Market Size Value (USD Million) Analysis and Forecast By Measurement Type, 2026 to 2036
- Directional Dustfall
- Total Dustfall
- Soluble - Insoluble Fraction
- Particle Characterization
- Directional Dustfall
- Y-o-Y Growth Trend Analysis By Measurement Type, 2021 to 2025
- Absolute $ Opportunity Analysis By Measurement Type, 2026 to 2036
- Global Market Analysis and Forecast, By Application, 2021 to 2036
- Introduction / Key Findings
- Historical Market Size Value (USD Million) Analysis By Application, 2021 to 2025
- Current and Future Market Size Value (USD Million) Analysis and Forecast By Application, 2026 to 2036
- Mining
- Construction Sites
- Industrial Emissions
- Environmental Monitoring
- Mining
- Y-o-Y Growth Trend Analysis By Application, 2021 to 2025
- Absolute $ Opportunity Analysis By Application, 2026 to 2036
- Global Market Analysis and Forecast, By End Use, 2021 to 2036
- Introduction / Key Findings
- Historical Market Size Value (USD Million) Analysis By End Use, 2021 to 2025
- Current and Future Market Size Value (USD Million) Analysis and Forecast By End Use, 2026 to 2036
- Environmental Labs
- Industrial Facilities
- Regulators - Municipalities
- EPC - Consultants
- Environmental Labs
- Y-o-Y Growth Trend Analysis By End Use, 2021 to 2025
- Absolute $ Opportunity Analysis By End Use, 2026 to 2036
- Global Market Analysis and Forecast, By Sales Channel, 2021 to 2036
- Introduction / Key Findings
- Historical Market Size Value (USD Million) Analysis By Sales Channel, 2021 to 2025
- Current and Future Market Size Value (USD Million) Analysis and Forecast By Sales Channel, 2026 to 2036
- Direct OEM
- Lab Equipment Distributors
- Monitoring Service Providers
- Direct OEM
- Y-o-Y Growth Trend Analysis By Sales Channel, 2021 to 2025
- Absolute $ Opportunity Analysis By Sales Channel, 2026 to 2036
- Global Market Analysis and Forecast, By Region, 2021 to 2036
- Introduction
- Historical Market Size Value (USD Million) Analysis By Region, 2021 to 2025
- Current Market Size Value (USD Million) Analysis and Forecast By Region, 2026 to 2036
- North America
- Latin America
- Western Europe
- Eastern Europe
- East Asia
- South Asia and Pacific
- Middle East & Africa
- Market Attractiveness Analysis By Region
- North America Market Analysis and Forecast, By Country, 2021 to 2036
- Historical Market Size Value (USD Million) Trend Analysis By Market Taxonomy, 2021 to 2025
- Market Size Value (USD Million) Forecast By Market Taxonomy, 2026 to 2036
- By Country
- USA
- Canada
- By Gauge Type
- By Measurement Type
- By Application
- By End Use
- By Sales Channel
- By Country
- Market Attractiveness Analysis
- By Country
- By Gauge Type
- By Measurement Type
- By Application
- By End Use
- By Sales Channel
- Key Takeaways
- Latin America Market Analysis and Forecast, By Country
- Historical Market Size Value (USD Million) Trend Analysis By Market Taxonomy, 2021 to 2025
- Market Size Value (USD Million) Forecast By Market Taxonomy, 2026 to 2036
- By Country
- Brazil
- Mexico
- Chile
- Rest of Latin America
- By Gauge Type
- By Measurement Type
- By Application
- By End Use
- By Sales Channel
- By Country
- Market Attractiveness Analysis
- By Country
- By Gauge Type
- By Measurement Type
- By Application
- By End Use
- By Sales Channel
- Key Takeaways
- Western Europe Market Analysis and Forecast, By Country
- Historical Market Size Value (USD Million) Trend Analysis By Market Taxonomy, 2021 to 2025
- Market Size Value (USD Million) Forecast By Market Taxonomy, 2026 to 2036
- By Country
- Germany
- UK
- Italy
- Spain
- France
- Nordic
- BENELUX
- Rest of Western Europe
- By Gauge Type
- By Measurement Type
- By Application
- By End Use
- By Sales Channel
- By Country
- Market Attractiveness Analysis
- By Country
- By Gauge Type
- By Measurement Type
- By Application
- By End Use
- By Sales Channel
- Key Takeaways
- Eastern Europe Market Analysis and Forecast, By Country
- Historical Market Size Value (USD Million) Trend Analysis By Market Taxonomy, 2021 to 2025
- Market Size Value (USD Million) Forecast By Market Taxonomy, 2026 to 2036
- By Country
- Russia
- Poland
- Hungary
- Balkan & Baltic
- Rest of Eastern Europe
- By Gauge Type
- By Measurement Type
- By Application
- By End Use
- By Sales Channel
- By Country
- Market Attractiveness Analysis
- By Country
- By Gauge Type
- By Measurement Type
- By Application
- By End Use
- By Sales Channel
- Key Takeaways
- East Asia Market Analysis and Forecast, By Country
- Historical Market Size Value (USD Million) Trend Analysis By Market Taxonomy, 2021 to 2025
- Market Size Value (USD Million) Forecast By Market Taxonomy, 2026 to 2036
- By Country
- China
- Japan
- South Korea
- By Gauge Type
- By Measurement Type
- By Application
- By End Use
- By Sales Channel
- By Country
- Market Attractiveness Analysis
- By Country
- By Gauge Type
- By Measurement Type
- By Application
- By End Use
- By Sales Channel
- Key Takeaways
- South Asia and Pacific Market Analysis and Forecast, By Country
- Historical Market Size Value (USD Million) Trend Analysis By Market Taxonomy, 2021 to 2025
- Market Size Value (USD Million) Forecast By Market Taxonomy, 2026 to 2036
- By Country
- India
- ASEAN
- Australia & New Zealand
- Rest of South Asia and Pacific
- By Gauge Type
- By Measurement Type
- By Application
- By End Use
- By Sales Channel
- By Country
- Market Attractiveness Analysis
- By Country
- By Gauge Type
- By Measurement Type
- By Application
- By End Use
- By Sales Channel
- Key Takeaways
- Middle East & Africa Market Analysis and Forecast, By Country
- Historical Market Size Value (USD Million) Trend Analysis By Market Taxonomy, 2021 to 2025
- Market Size Value (USD Million) Forecast By Market Taxonomy, 2026 to 2036
- By Country
- Kingdom of Saudi Arabia
- Other GCC Countries
- Türkiye
- South Africa
- Other African Union
- Rest of Middle East & Africa
- By Gauge Type
- By Measurement Type
- By Application
- By End Use
- By Sales Channel
- By Country
- Market Attractiveness Analysis
- By Country
- By Gauge Type
- By Measurement Type
- By Application
- By End Use
- By Sales Channel
- Key Takeaways
- Key Countries Market Analysis
- USA
- Pricing Analysis
- Market Share Analysis, 2025
- By Gauge Type
- By Measurement Type
- By Application
- By End Use
- By Sales Channel
- Canada
- Pricing Analysis
- Market Share Analysis, 2025
- By Gauge Type
- By Measurement Type
- By Application
- By End Use
- By Sales Channel
- Mexico
- Pricing Analysis
- Market Share Analysis, 2025
- By Gauge Type
- By Measurement Type
- By Application
- By End Use
- By Sales Channel
- Brazil
- Pricing Analysis
- Market Share Analysis, 2025
- By Gauge Type
- By Measurement Type
- By Application
- By End Use
- By Sales Channel
- Chile
- Pricing Analysis
- Market Share Analysis, 2025
- By Gauge Type
- By Measurement Type
- By Application
- By End Use
- By Sales Channel
- Germany
- Pricing Analysis
- Market Share Analysis, 2025
- By Gauge Type
- By Measurement Type
- By Application
- By End Use
- By Sales Channel
- UK
- Pricing Analysis
- Market Share Analysis, 2025
- By Gauge Type
- By Measurement Type
- By Application
- By End Use
- By Sales Channel
- Italy
- Pricing Analysis
- Market Share Analysis, 2025
- By Gauge Type
- By Measurement Type
- By Application
- By End Use
- By Sales Channel
- Spain
- Pricing Analysis
- Market Share Analysis, 2025
- By Gauge Type
- By Measurement Type
- By Application
- By End Use
- By Sales Channel
- France
- Pricing Analysis
- Market Share Analysis, 2025
- By Gauge Type
- By Measurement Type
- By Application
- By End Use
- By Sales Channel
- India
- Pricing Analysis
- Market Share Analysis, 2025
- By Gauge Type
- By Measurement Type
- By Application
- By End Use
- By Sales Channel
- ASEAN
- Pricing Analysis
- Market Share Analysis, 2025
- By Gauge Type
- By Measurement Type
- By Application
- By End Use
- By Sales Channel
- Australia & New Zealand
- Pricing Analysis
- Market Share Analysis, 2025
- By Gauge Type
- By Measurement Type
- By Application
- By End Use
- By Sales Channel
- China
- Pricing Analysis
- Market Share Analysis, 2025
- By Gauge Type
- By Measurement Type
- By Application
- By End Use
- By Sales Channel
- Japan
- Pricing Analysis
- Market Share Analysis, 2025
- By Gauge Type
- By Measurement Type
- By Application
- By End Use
- By Sales Channel
- South Korea
- Pricing Analysis
- Market Share Analysis, 2025
- By Gauge Type
- By Measurement Type
- By Application
- By End Use
- By Sales Channel
- Russia
- Pricing Analysis
- Market Share Analysis, 2025
- By Gauge Type
- By Measurement Type
- By Application
- By End Use
- By Sales Channel
- Poland
- Pricing Analysis
- Market Share Analysis, 2025
- By Gauge Type
- By Measurement Type
- By Application
- By End Use
- By Sales Channel
- Hungary
- Pricing Analysis
- Market Share Analysis, 2025
- By Gauge Type
- By Measurement Type
- By Application
- By End Use
- By Sales Channel
- Kingdom of Saudi Arabia
- Pricing Analysis
- Market Share Analysis, 2025
- By Gauge Type
- By Measurement Type
- By Application
- By End Use
- By Sales Channel
- Türkiye
- Pricing Analysis
- Market Share Analysis, 2025
- By Gauge Type
- By Measurement Type
- By Application
- By End Use
- By Sales Channel
- South Africa
- Pricing Analysis
- Market Share Analysis, 2025
- By Gauge Type
- By Measurement Type
- By Application
- By End Use
- By Sales Channel
- USA
- Market Structure Analysis
- Competition Dashboard
- Competition Benchmarking
- Market Share Analysis of Top Players
- By Regional
- By Gauge Type
- By Measurement Type
- By Application
- By End Use
- By Sales Channel
- Emerging Startups
- Innovation Benchmarking
- Competition Analysis
- Competition Deep Dive
- SDEC France
- Overview
- Product Portfolio
- Profitability by Market Segments
- Sales Footprint
- Strategy Overview
- Marketing Strategy
- Product Strategy
- Channel Strategy
- DustScanAQ
- Casella
- SKC
- Gradko
- ENVEA
- Turnkey Instruments
- Tisch Environmental
- Ecotech
- Aeroqual
- SDEC France
- Case Studies
- Success Stories
- Recent Developments
- Competition Deep Dive
- Assumptions & Acronyms Used


