Reports

- Global Locations -

Headquarters

Future Market Insights, Inc.

Christiana Corporate, 200
Continental Drive, Suite 401,
Newark, Delaware - 19713,
United States

T: +1-845-579-5705

Americas

Future Market Insights, Inc.

616 Corporate Way, Suite 2-9018,
Valley Cottage, NY 10989, United States

T: +1-347-918-3531

MEA

Future Market Insights

1602-6 Jumeirah Bay X2 Tower, Plot No: JLT-PH2-X2A,
Jumeirah Lakes Towers, Dubai,
United Arab Emirates

Europe

Future Market Insights

3rd Floor, 207 Regent Street,
W1B 3HH London
United Kingdom

T: + 44 (0) 20 8123 9659
D: +44 (0) 20 3287 4268

Asia Pacific

Future Market Insights

IndiaLand Global Tech Park, Unit UG-1, Behind Grand HighStreet, Phase 1, Hinjawadi, MH, Pune – 411057, India

Global Fluoroelastomer Market Outlook (2022 to 2032)

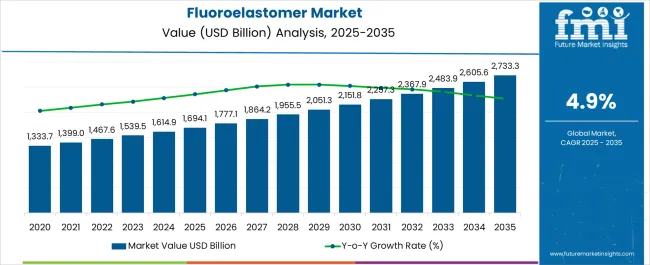
The global fluoroelastomer market was valued at around US$1,467.6 million in 2022 and it is forecast to expand at a steady CAGR of 4.9% during the forecast period of 2022 and 2032. Overall fluoroelastomer sales are anticipated to total a market valuation of US$ 2,374.8 million by 2032.

Robust growth of end-use industries such as aerospace, automotive, consumer electronics, and oil & gas is a key factor providing impetus to the global fluoroelastomer industry.

Fluoroelastomers also known as fluorinated elastomers are a type of synthetic rubber that is widely used for very high-temperature operations across diverse industries, owing to its exceptional resistance to heat, oil, and chemicals.

Fluoroelastomers are extremely heat, high-temperature, and chemical change resistant. These fluoro rubber materials (fluoroelastomers) are manufactured by copolymerizing numerous combinations of vinylidene fluoride, hexafluoropropylene, tetrafluoroethylene, and chlorotrifluoroethylene.

In recent years, fluoroelastomers have emerged as ideal alternatives to conventional rubbers due to their superior mechanical and chemical properties. They are being increasingly used in applications such as sealing.

The global fluoroelastomer market is predicted to grow considerably over the projection period as a result of fluoroelastomers’ widespread utilization in the automobile industry owing to their superior mechanical, sealing, and heat resistance characteristics.

The aircraft industry is expected to witness high demand for specialist fluoroelastomer products during the forecast period, including hoses and gaskets. Similarly, market development is anticipated to be fueled by growing demand for products with outstanding mechanical properties, such as resistance to high temperatures and degradation, and great electrical insulating properties.

Thanks to their outstanding chemical resistance, including resistance to aromatic and aliphatic hydrocarbons, fluoroelastomers have become the most widely used materials across industries such as automotive and aerospace.

Fluorocarbon elastomers are widely utilized in applications to withstand ozone attacks and harsh chemicals. Specialty-grade fluorocarbons, on the other hand, can offer high fluorine content with low-temperature characteristics.

Right from making highly efficient seals and envelope for cables to preventing corrosion, the application area of fluoroelastomers keeps widening, and this in turn is accelerating growth in the global market.

Viton Extreme ETP-600S is one of the popular fluoroelastomers which possess great resistance to bases, hydrocarbons, alcohol, esters, ketones, and other solvents. It also exhibits compression sets and physical qualities and is very resistant to high temperature, steam, and difficult process conditions.

Attribute Key Insights
Fluoroelastomer Market Base Value (2021A) US$ 1,408.2 million
Estimated Market Value (2022E) US$ 1,467.6 million
Projected Market Value (2032F) US$ 2,374.8 million
Value-based CAGR (2022 to 2032) 4.9%
Collective Value Share: Top 3 Countries (2022E) 47.6%

Don't pay for what you don't need

Customize your report by selecting specific countries or regions and save 30%!

2017 to 2021 Fluoroelastomer Market Outlook Compared to 2022 to 2032 Forecast

Fluoroelastomer sales increased at a CAGR of 2.4% between 2017 and 2021. During the historical period, the fluoroelastomer business was significantly impacted due to the shutdown of the aviation and electronics sectors and constrained supply chains caused by the pandemic.

However, with the resumption of functioning of industries such as aerospace, electrical & electronics, oil & gas, energy, and others, fluoroelastomers demand is anticipated to expand at a CAGR of 4.9% over the forecast period.

Growing usage of fluoroelastomers in a variety of commercial processes, including gaskets, and O-ring seals in the petroleum, automobile, and food production sectors will boost the market during the assessment period.

Similarly, novel uses for perfluorocarbon elastomers are anticipated to open up a lot of market prospects over the next several years.

A significant factor positively influencing fluoroelastomer sales is the surging demand for fuel-efficient automobiles. Numerous automakers are altering their design strategies and emphasizing lightweight through material substitution to satisfy the growing demand for more fuel-efficient vehicles which will spur demand for materials such as fluorinated elastomers during the forecast period.

What are the Key Trends Shaping the Global Market for Fluoroelastomers?

Increasing Automotive Production and Rising Demand for fuel-efficient Vehicles to Boost Market

Globally, the production of automobiles has increased dramatically during the past several years and the trend is expected to further escalate during the assessment period. Polymer composites will be more in demand due to their key characteristics, such as low weight, high strength, and elasticity.

To minimize fuel consumption, leading automakers are focusing on practical ways to shrink powertrains, engines, and engine compartments. These firms are also concentrating on different types of materials to fulfill the requirements of electric car parts.

Products from fluoroelastomers used in automotive components, such as seals, hoses, high-voltage cables, gaskets, and O-rings offer high flexibility and elasticity in higher temperatures compared to products made from other rubbers. Fluoroelastomer-based products maintain their significant properties when exposed to synthetic lubricants and harsh chemicals as well as to powertrain fluids and fuels.

Government requirements on automobile fuel economy are becoming more stringent, which is pressuring OEMs to create lightweight cars. This is increasing demand for composite materials such as fluoroelastomers. Hence, the rapid growth of the automobile industry worldwide coupled with growing demand for lightweight and fuel-efficient vehicles will play a key role in fostering fluoroelastomer sales over the projection period.

Nikhil Kaitwade
Nikhil Kaitwade

Principal Consultant

Talk to Analyst

Find your sweet spots for generating winning opportunities in this market.

What are the Factors Limiting Development of Fluoroelastomer Industry?

Complete Dependency on Petrochemical Feed Stocks to Constraint Market Development

Vital raw materials for the production of fluoroelastomers are petroleum-based feedstock products. Volatility in the prices of feedstock will result in price fluctuations in polymers, which, to a large extent, will directly impact the final price of the product. These raw materials, which are extensively used by end-use industries, are often generated from refinery processes and petrochemical feedstock. The production of fluoroelastomers requires a significant amount of both petrochemical and non-petrochemical feedstock.

In Europe, owing to fluctuations in crude oil & gas prices, a rise in raw material costs has been witnessed in the polymer sector in the last couple of years. This may act as a restraint for petrochemical feedstock, thereby hampering the growth of the fluoroelastomer market. Key manufacturers are facing price adjustments and restructuring to maintain profit margins and strengthen their market position.

To reduce emissions and effluents generated by the chemical industry, many governments have imposed closures and production regulations, thereby limiting the availability of pigment intermediates. This will affect the supply chain, leading to price escalations.
Country-wise Insights

What is the Growth Projection for the USA Fluoroelastomer Market?

Robust Growth of Automotive and Aerospace Industries Propelling Fluoroelastomers Demand in the USA

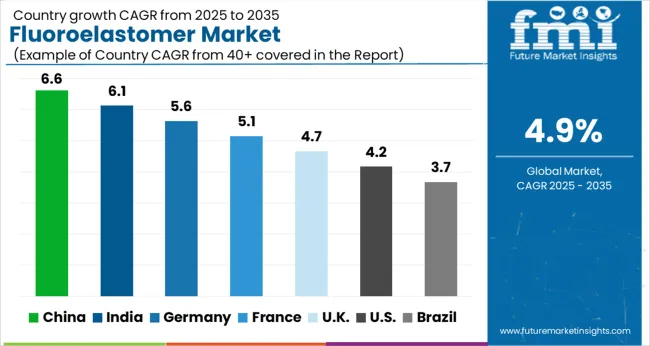
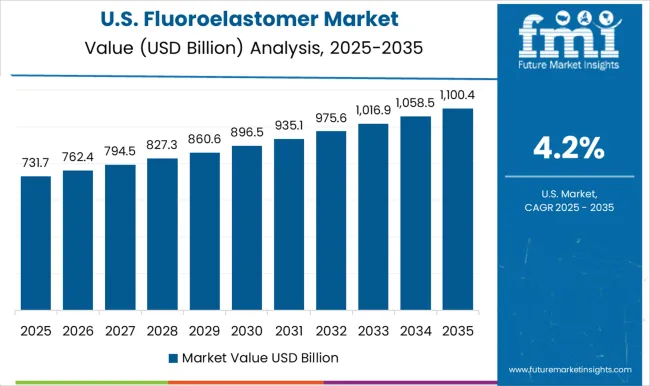
According to Future Market Insights (FMI’s) latest analysis, the USA fluoroelastomer market is projected to expand at 4.4% CAGR during the forecast period (2022 to 2032). Currently, the USA holds around 21.5% of the total value share in the global market.

Increased investment in enhancing fluoroelastomer manufacturing capacity, implementation of stringent fuel emissions rules and regulations, and robust growth of automobile and aerospace sectors are key factors driving fluoroelastomer demand in the United States.

Over the years, rising carbon emission levels and enforcement of strict regulations have prompted the USA automotive manufacturers to shift their preference from heavy materials towards lighter ones possessing excellent heat and chemical resistance such as fluoroelastomers.

The addition of these materials has significantly reduced the overall weight of vehicles, thereby improving their fuel efficiency and reducing emission levels. Driven by this, fluoroelastomer sales across the country will continue to grow at a steady pace throughout the projection period.

How Will Growth Unfold in China’s Fluoroelastomer Market?

Growing Popularity of Electric Vehicles Fostering Fluoroelastomer Sales in China

Currently, China accounts for a sizable value share of 20.4% of the global fluoroelastomer industry and it is expected to accelerate at around 5.8% CAGR over the next ten years. The rapid expansion of industries such as oil & gas, energy & power, pharmaceutical & food, etc. is a key factor driving demand for fluoroelastomers across China.

Similarly, due to considerable capital investments made in the coatings industry, sales of fluoroelastomers across China are expected to grow at a robust pace over the projection period.

Consequently, increasing production and sales of electric vehicles will create a conducive environment for the development of the fluoroelastomer industry in China during the projection period.

Get the data you need at a Fraction of the cost

Personalize your report by choosing insights you need
and save 40%!

Category-wise Insights

Which is the Most Popular Product Type in the Market?

Fluorocarbon Elastomers Remain the Most Sought After Product Type in the Market

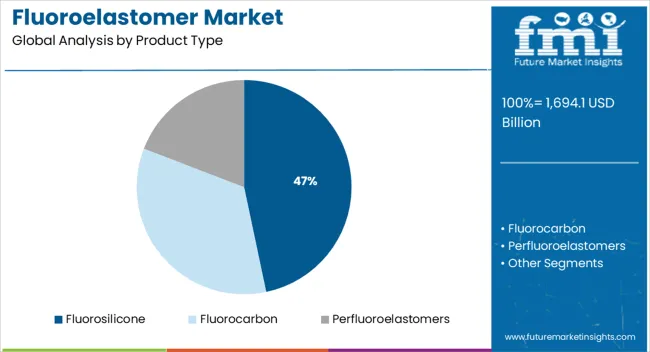
Based on product type, the market is segmented into fluorosilicone, fluorocarbon, and perfluoroelastomers. Among these, the fluorocarbon segment holds the dominating share of 73.7% of the global fluoroelastomers industry. This is attributed to the rising usage of fluorocarbons across several industries owing to their specific properties including enhanced stability, non-flammability, and hydrophobicity.

Fluorocarbon or fluorocarbon elastomer provides the highest cross-link production for a particular product. The thermal stability and mechanical properties of optimum compounds formed from fluorocarbon elastomers that are irradiated under perfect conditions are much better than those of chemical curing procedures.

Fluorocarbons are widely used in vehicle and airplane parts, which explains their domination in the market. They have become key components in the creation of seals because of their qualities, which include resistance to chemicals and heat, low compression set, and excellent aging characteristics.

Which is the Leading End-use Industry for Fluoroelastomers?

Most of the Fluoroelastomer Demand Emerged from the Automotive Industry

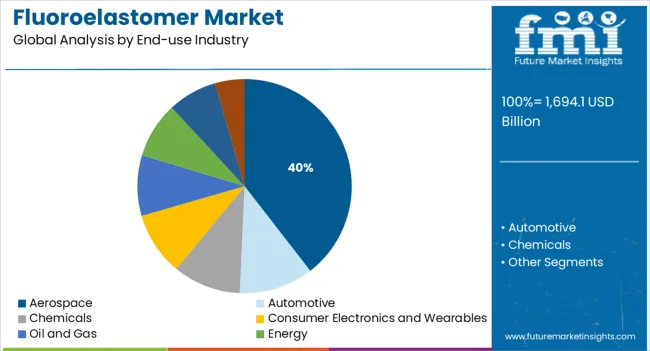
Based on the end-use industry, the automotive segment currently dominates the global fluoroelastomers market with an impeccable market value share of 46.8%. This is attributed to the rising demand for lightweight and fuel-efficient vehicles and the growing adoption of fluoroelastomers across the thriving automotive industry worldwide.

Fluoroelastomers are frequently used in the automotive sector because of their remarkable heat resistance, sealing ability, and mechanical characteristics. Fluoroelastomer is integrated into vehicle parts including drive trains and fuel handling systems to increase fuel economy and cut pollution.

A rapid spike in growth in regions like the Asia Pacific is predicted to expand automotive manufacturing, which will elevate the demand for fluoroelastomers because they offer valuable properties.
Competitive Landscape

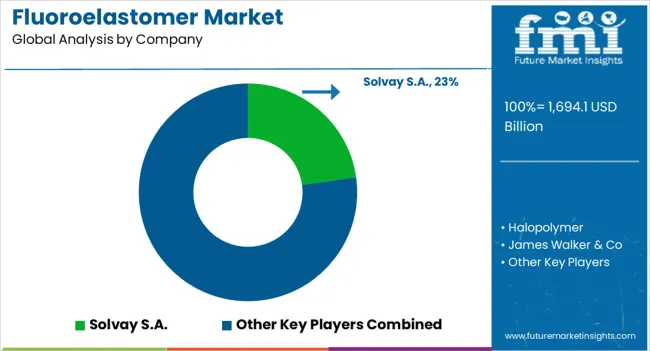
Key fluoroelastomer manufacturers are focusing on increasing their production capabilities to meet the rising demand for fluoroelastomers from several end-use industries. New product launches, heavy investments in research and development activities, partnerships, acquisitions, and facility expansion are some of the frequent strategies adopted by leading fluoroelastomer manufacturing companies.

For instance,

  • In October 2019, to meet the growing demand for high-performance sealing applications in several industries, Solvay significantly increased its Tecnoflon® FKM peroxide curable fluoroelastomer production at its facility in Spinetta Marengo, Italy.
  • In May 2022, for producing Advanced Polymer Architecture (APA) grade Viton™ fluoroelastomers, a sustainable process innovation was announced by The Chemours Company.

Scope of Report

Attribute Details
Current Market Size (2022) US$ 1,467.6 million
Projected Market Size (2032) US$ 2,374.8 million
Anticipated Growth Rate (2022 to 2032) 4.9% CAGR
Forecast Period 2022 to 2032
Historical Data Available for 2017 to 2021
Market Analysis US$ million for Value and Tons for Volume
Key Countries Covered USA, Canada, Brazil, Mexico, Germany, Italy, France, UK, Spain, BENELUX, Russia, China, Japan, South Korea, India, ASEAN, ANZ, GCC Countries, Turkey, Northern Africa, South Africa
Key Segments Covered Product Type, End-use Industry, and Region
Key Companies Profiled
  • The Chemours Company
  • 3M
  • Daikin Industries
  • Gujarat Fluorochemicals Limited
  • Zhejiang Fluorine Chemical New Materials Co., Ltd
  • Halopolymer OJSC
  • James Walker & Co
  • Shin-Etsu chemicals
  • AGC Chemical Inc.
  • Solvay SA
Report Coverage Market Forecast, Company Share Analysis, Competition Intelligence, Drivers, Restraints, Opportunity, and Threat Analysis, Market Dynamics and Challenges, and Strategic Growth Initiatives

Fluoroelastomer Industry Segmentation

By Product Type:

  • Fluorosilicone
  • Fluorocarbon
  • Perfluoroelastomers

By End-use Industry:

  • Aerospace
  • Automotive
  • Chemicals
  • Consumer Electronics and Wearables
  • Oil and Gas
  • Energy
  • Pharmaceutical and Food
  • Others

By Region:

  • North America
  • Latin America
  • Europe
  • East Asia
  • South Asia & Pacific
  • Middle East & Africa (MEA)

Frequently Asked Questions

What is the Global Fluoroelastomer Market Growth Projection?

The global fluoroelastomer market is expected to progress at 4.9% CAGR until 2033.

What is the Projected Market Value by 2033 End?

The overall fluoroelastomer market is projected to reach around US$ 2,374.8 mllion by 2033.

Which Type of Product Forms Lucrative Fluoroelastomer Market Segment?

Based on product types, the fluorocarbon fluoroelastomer sales are poised to remain lucrative at 73.7% market share.

Which is the Prominent Market for Supplying Fluoroelastomer in Asia Pacific?

China dominates the Asia Pacific market and is projected to advance at 5.8% through 2033.

Which is the Leading Market Segment Based on End Use of Fluoroelastomer?

Automotive segment constitutes the leading segment with 46.8% market share.

Table of Content

1. Executive Summary | Fluoroelastomer Market

    1.1. Global Market Outlook

    1.2. Demand Side Trends

    1.3. Supply Side Trends

    1.4. Technology Roadmap

    1.5. Analysis and Recommendations

2. Market Overview

    2.1. Market Coverage / Taxonomy

    2.2. Market Definition / Scope / Limitations

3. Key Market Trends

    3.1. Key Trends Impacting the Market

    3.2. Material Innovation / Development Trends

4. Key Success Factors

    4.1. Material Adoption / Usage Analysis

    4.2. Material USPs / Features

    4.3. Strategic Promotional Strategies

5. Global Market Demand Analysis 2017 to 2021 and Forecast, 2022 to 2032

    5.1. Historical Market Volume (Tons) Analysis, 2017 to 2021

    5.2. Current and Future Market Volume (Tons) Projections, 2022 to 2032

    5.3. Y to o to Y Growth Trend Analysis

6. Global Market to Pricing Analysis

    6.1. Regional Pricing Analysis By Product Type

    6.2. Global Average Pricing Analysis Benchmark

7. Global Market Demand (in Value or Size in US$ Million) Analysis 2017 to 2021 and Forecast, 2022 to 2032

    7.1. Historical Market Value (US$ Million) Analysis, 2017 to 2021

    7.2. Current and Future Market Value (US$ Million) Projections, 2022 to 2032

        7.2.1. Y to o to Y Growth Trend Analysis

        7.2.2. Absolute $ Opportunity Analysis

8. Market Background

    8.1. Macro to Economic Factors

        8.1.1. Global GDP Growth Outlook

        8.1.2. Global Urbanization Growth Outlook

        8.1.3. Global Chemical Industry Outlook

        8.1.4. Global Construction Industry Outlook

        8.1.5. Global Aerospace Industry Overview

        8.1.6. Global Automotive Production by Region

        8.1.7. Global Electronic Industry Overview

        8.1.8. Other Key Macro-to-Economic Factors

    8.2. Forecast Factors to Relevance & Impact

        8.2.1. Top Companies Historical Growth

        8.2.2. GDP Growth forecast

        8.2.3. Demand from Chemical Industry

        8.2.4. Demand for Manufacturing Sector

        8.2.5. Other Forecast Factors

    8.3. Value Chain Analysis

        8.3.1. Material Manufacturers

        8.3.2. Distributors

        8.3.3. Probable end to users

    8.4. COVID to 19 Crisis to Impact Assessment

        8.4.1. Current Statistics

        8.4.2. Short to Mid to Long Term Outlook

        8.4.3. Likely Rebound

    8.5. Market Dynamics

        8.5.1. Drivers

        8.5.2. Restraints

        8.5.3. Opportunity Analysis

    8.6. Global Supply Demand Analysis

9. Global Market Analysis 2017 to 2021 and Forecast 2022 to 2032, By Product Type

    9.1. Introduction / Key Findings

    9.2. Historical Market Size (US$ Million) and Volume Analysis By Product Type, 2017 to 2021

    9.3. Current and Future Market Size (US$ Million) and Volume Analysis and Forecast By Product Type, 2022 to 2032

        9.3.1. Fluorosilicone

        9.3.2. Fluorocarbon

        9.3.3. Perfluoroelastomers

    9.4. Market Attractiveness Analysis By Product Type

10. Global Market Analysis 2017 to 2021 and Forecast 2022 to 2032, By End to use Industry

    10.1. Introduction / Key Findings

    10.2. Historical Market Size (US$ Million) and Volume Analysis By End to use Industry, 2017 to 2021

    10.3. Current and Future Market Size (US$ Million) and Volume Analysis and Forecast By End to use Industry, 2022 to 2032

        10.3.1. Aerospace

        10.3.2. Automotive

        10.3.3. Chemicals

        10.3.4. Consumer Electronics and Wearable

        10.3.5. Oil & Gas

        10.3.6. Energy

        10.3.7. Pharmaceutical & Food

        10.3.8. Others

    10.4. Market Attractiveness Analysis By End-use Industry

11. Global Market Analysis 2017 to 2021 and Forecast 2022 to 2032, by Region

    11.1. Introduction

    11.2. Historical Market Size (US$ Million) and Volume Analysis By Region, 2017 to 2021

    11.3. Current Market Size (US$ Million) and Volume Analysis and Forecast By Region, 2022 to 2032

        11.3.1. North America

        11.3.2. Latin America

        11.3.3. Europe

        11.3.4. East Asia

        11.3.5. South Asia and Pacific

        11.3.6. Middle East and Africa (MEA)

    11.4. Market Attractiveness Analysis By Region

12. North America Market Analysis 2017 to 2021 and Forecast 2022 to 2032

    12.1. Introduction

    12.2. Pricing Analysis

    12.3. Historical Market Size (US$ Million) and Volume Trend Analysis By Market Taxonomy, 2017 to 2021

    12.4. Market Size (US$ Million) and Volume Forecast By Market Taxonomy, 2022 to 2032

        12.4.1. By Country

            12.4.1.1. USA

            12.4.1.2. Canada

        12.4.2. By Product Type

        12.4.3. By End to use Industry

    12.5. Market Attractiveness Analysis

        12.5.1. By Country

        12.5.2. By Product Type

        12.5.3. By End to use Industry

    12.6. Market Trends

    12.7. Key Market Participants to Intensity Mapping

    12.8. Drivers and Restraints to Impact Analysis

13. Latin America Market Analysis 2017 to 2021 and Forecast 2022 to 2032

    13.1. Introduction

    13.2. Pricing Analysis

    13.3. Historical Market Size (US$ Million) and Volume Trend Analysis By Market Taxonomy, 2017 to 2021

    13.4. Market Size (US$ Million) and Volume Forecast By Market Taxonomy, 2022 to 2032

        13.4.1. By Country

            13.4.1.1. Brazil

            13.4.1.2. Mexico

            13.4.1.3. Rest of Latin America

        13.4.2. By Product Type

        13.4.3. By End to use Industry

    13.5. Market Attractiveness Analysis

        13.5.1. By Country

        13.5.2. By Product Type

        13.5.3. By End to use Industry

    13.6. Market Trends

    13.7. Key Market Participants to Intensity Mapping

    13.8. Drivers and Restraints to Impact Analysis

14. Europe Market Analysis 2017 to 2021 and Forecast 2022 to 2032

    14.1. Introduction

    14.2. Pricing Analysis

    14.3. Historical Market Size (US$ Million) and Volume Trend Analysis By Market Taxonomy, 2017 to 2021

    14.4. Market Size (US$ Million) and Volume Forecast By Market Taxonomy, 2022 to 2032

        14.4.1. By Country

            14.4.1.1. Germany

            14.4.1.2. Italy

            14.4.1.3. France

            14.4.1.4. UK

            14.4.1.5. Spain

            14.4.1.6. BENELUX

            14.4.1.7. Russia

            14.4.1.8. Rest of Europe

        14.4.2. By Product Type

        14.4.3. By End to use Industry

    14.5. Market Attractiveness Analysis

        14.5.1. By Country

        14.5.2. By Product Type

        14.5.3. By End to use Industry

    14.6. Market Trends

    14.7. Key Market Participants to Intensity Mapping

    14.8. Drivers and Restraints to Impact Analysis

15. South Asia and Pacific Market Analysis 2017 to 2021 and Forecast 2022 to 2032

    15.1. Introduction

    15.2. Pricing Analysis

    15.3. Historical Market Size (US$ Million) and Volume Trend Analysis By Market Taxonomy, 2017 to 2021

    15.4. Market Size (US$ Million) and Volume Forecast By Market Taxonomy, 2022 to 2032

        15.4.1. By Country

            15.4.1.1. India

            15.4.1.2. Association of Southeast Asian Nations (ASEAN)

            15.4.1.3. Oceania

            15.4.1.4. Rest of South Asia & Pacific

        15.4.2. By Product Type

        15.4.3. By End to use Industry

    15.5. Market Attractiveness Analysis

        15.5.1. By Country

        15.5.2. By Product Type

        15.5.3. By End to use Industry

    15.6. Market Trends

    15.7. Key Market Participants to Intensity Mapping

    15.8. Drivers and Restraints to Impact Analysis

16. East Asia Market Analysis 2017 to 2021 and Forecast 2022 to 2032

    16.1. Introduction

    16.2. Pricing Analysis

    16.3. Historical Market Size (US$ Million) and Volume Trend Analysis By Market Taxonomy, 2017 to 2021

    16.4. Market Size (US$ Million) and Volume Forecast By Market Taxonomy, 2022 to 2032

        16.4.1. By Country

            16.4.1.1. China

            16.4.1.2. Japan

            16.4.1.3. South Korea

        16.4.2. By Product Type

        16.4.3. By End to use Industry

    16.5. Market Attractiveness Analysis

        16.5.1. By Country

        16.5.2. By Product Type

        16.5.3. By End to use Industry

    16.6. Market Trends

    16.7. Key Market Participants to Intensity Mapping

    16.8. Drivers and Restraints to Impact Analysis

17. Middle East and Africa Market Analysis 2017 to 2021 and Forecast 2022 to 2032

    17.1. Introduction

    17.2. Pricing Analysis

    17.3. Historical Market Size (US$ Million) and Volume Trend Analysis By Market Taxonomy, 2017 to 2021

    17.4. Market Size (US$ Million) and Volume Forecast By Market Taxonomy, 2022 to 2032

        17.4.1. By Country

            17.4.1.1. GCC Countries

            17.4.1.2. Turkey

            17.4.1.3. Northern Africa

            17.4.1.4. South Africa

            17.4.1.5. Rest of Middle East and Africa

        17.4.2. By Product Type

        17.4.3. By End to use Industry

    17.5. Market Attractiveness Analysis

        17.5.1. By Country

        17.5.2. By Product Type

        17.5.3. By End to use Industry

    17.6. Market Trends

    17.7. Key Market Participants to Intensity Mapping

    17.8. Drivers and Restraints to Impact Analysis

18. Country to wise Market Analysis

    18.1. USA Market Analysis

        18.1.1. By Product Type

        18.1.2. By End to use Industry

    18.2. Canada Market Analysis

        18.2.1. By Product Type

        18.2.2. By End to use Industry

    18.3. Mexico Market Analysis

        18.3.1. By Product Type

        18.3.2. By End to use Industry

    18.4. Brazil Market Analysis

        18.4.1. By Product Type

        18.4.2. By End to use Industry

    18.5. Germany Market Analysis

        18.5.1. By Product Type

        18.5.2. By End to use Industry

    18.6. Italy Market Analysis

        18.6.1. By Product Type

        18.6.2. By End to use Industry

    18.7. France Market Analysis

        18.7.1. By Product Type

        18.7.2. By End to use Industry

    18.8. UK Market Analysis

        18.8.1. By Product Type

        18.8.2. By End to use Industry

    18.9. Spain Market Analysis

        18.9.1. By Product Type

        18.9.2. By End to use Industry

    18.10. Russia Market Analysis

        18.10.1. By Product Type

        18.10.2. By End to use Industry

    18.11. China Market Analysis

        18.11.1. By Product Type

        18.11.2. By End to use Industry

    18.12. Japan Market Analysis

        18.12.1. By Product Type

        18.12.2. By End to use Industry

    18.13. South Korea Market Analysis

        18.13.1. By Product Type

        18.13.2. By End to use Industry

    18.14. India Market Analysis

        18.14.1. By Product Type

        18.14.2. By End to use Industry

    18.15. ASEAN Market Analysis

        18.15.1. By Product Type

        18.15.2. By End to use Industry

    18.16. Australia and New Zealand Market Analysis

        18.16.1. By Product Type

        18.16.2. By End to use Industry

    18.17. Turkey Market Analysis

        18.17.1. By Product Type

        18.17.2. By End to use Industry

    18.18. South Africa Market Analysis

        18.18.1. By Product Type

        18.18.2. By End to use Industry

19. Market Structure Analysis

    19.1. Market Analysis by Tier of Companies

    19.2. Market Concentration

    19.3. Market Share Analysis of Top Players

    19.4. Market Presence Analysis

        19.4.1. By End to Use Footprint

        19.4.2. By Regional Footprint

        19.4.3. By Channel Footprint

20. Competition Analysis

    20.1. Competition Dashboard

    20.2. Competition Benchmarking

    20.3. Competition Deep Dive

        20.3.1. Solvay S.A.

            20.3.1.1. Overview

            20.3.1.2. Material Portfolio

            20.3.1.3. Profitability by Market Segments (Product Type/End to use Industry/Region)

            20.3.1.4. Sales Footprint

            20.3.1.5. Strategy Overview

        20.3.2. Halopolymer

            20.3.2.1. Overview

            20.3.2.2. Material Portfolio

            20.3.2.3. Profitability by Market Segments (Product Type/End to use Industry/Region)

            20.3.2.4. Sales Footprint

            20.3.2.5. Strategy Overview

        20.3.3. James Walker & Co

            20.3.3.1. Overview

            20.3.3.2. Material Portfolio

            20.3.3.3. Profitability by Market Segments (Product Type / End to use Industry / Region)

            20.3.3.4. Sales Footprint

            20.3.3.5. Strategy Overview

        20.3.4. Shin to Etsu chemicals

            20.3.4.1. Overview

            20.3.4.2. Material Portfolio

            20.3.4.3. Profitability by Market Segments (Product Type / End to use Industry / Region)

            20.3.4.4. Sales Footprint

            20.3.4.5. Strategy Overview

        20.3.5. AGC Chemicals Inc.

            20.3.5.1. Overview

            20.3.5.2. Material Portfolio

            20.3.5.3. Profitability by Market Segments (Product Type / End to use Industry / Region)

            20.3.5.4. Sales Footprint

            20.3.5.5. Strategy Overview

        20.3.6. Zhejiang Fluorine Chemical New Materials Co., Ltd

            20.3.6.1. Overview

            20.3.6.2. Material Portfolio

            20.3.6.3. Profitability by Market Segments (Product Type / End to use Industry / Region)

            20.3.6.4. Sales Footprint

            20.3.6.5. Strategy Overview

        20.3.7. The Chemours Company

            20.3.7.1. Overview

            20.3.7.2. Material Portfolio

            20.3.7.3. Profitability by Market Segments (Product Type / End to use Industry / Region)

            20.3.7.4. Sales Footprint

            20.3.7.5. Strategy Overview

        20.3.8. Daikin Industries

            20.3.8.1. Overview

            20.3.8.2. Material Portfolio

            20.3.8.3. Profitability by Market Segments (Product Type / End to use Industry / Region)

            20.3.8.4. Sales Footprint

            20.3.8.5. Strategy Overview

        20.3.9. 3M

            20.3.9.1. Overview

            20.3.9.2. Material Portfolio

            20.3.9.3. Profitability by Market Segments (Product Type / End to use Industry / Region)

            20.3.9.4. Sales Footprint

            20.3.9.5. Strategy Overview

        20.3.10. Gujarat Fluorochemicals Limited

            20.3.10.1. Overview

            20.3.10.2. Material Portfolio

            20.3.10.3. Profitability by Market Segments (Product Type / End to use Industry / Region)

            20.3.10.4. Sales Footprint

            20.3.10.5. Strategy Overview

21. Assumptions and Acronyms Used

22. Research Methodology

Don't pay for what you don't need

Customize your report by selecting specific countries or regions and save 30%!

List of Tables

Table 01: Global Market Size (US$ Million) and Volume (Tons) Analysis and Forecast By Product Type, 2017 to 2032

Table 02: Global Market Size (US$ Million) and Volume (Tons) Analysis and Forecast By End to Use Industry, 2017 to 2032

Table 03: Global Market Size (US$ Million) and Volume (Tons) Analysis and Forecast By Region, 2017 to 2032

Table 04: North America Market Size (US$ Million) and Volume (Tons) Analysis and Forecast By Country, 2017 to 2032

Table 05: North America Market Size (US$ Million) and Volume (Tons) Analysis and Forecast By Product Type, 2017 to 2032

Table 06: North America Market Size (US$ Million) and Volume (Tons) Analysis and Forecast By End to Use Industry, 2017 to 2032

Table 07: Latin America Market Size (US$ Million) and Volume (Tons) Analysis and Forecast By Country, 2017 to 2032

Table 08: Latin America Market Size (US$ Million) and Volume (Tons) Analysis and Forecast By Product Type, 2017 to 2032

Table 09: Latin America Market Size (US$ Million) and Volume (Tons) Analysis and Forecast By End to Use Industry, 2017 to 2032

Table 10: Europe Market Size (US$ Million) and Volume (Tons) Analysis and Forecast By Country, 2017 to 2032

Table 11: Europe Market Size (US$ Million) and Volume (Tons) Analysis and Forecast By Product Type, 2017 to 2032

Table 12: Europe Market Size (US$ Million) and Volume (Tons) Analysis and Forecast By End to Use Industry, 2017 to 2032

Table 13: East Asia Market Size (US$ Million) and Volume (Tons) Analysis and Forecast By Country, 2017 to 2032

Table 14: East Asia Market Size (US$ Million) and Volume (Tons) Analysis and Forecast By Product Type, 2017 to 2032

Table 15: East Asia Market Size (US$ Million) and Volume (Tons) Analysis and Forecast By End to Use Industry, 2017 to 2032

Table 16: South Asia Pacific Market Size (US$ Million) and Volume (Tons) Analysis and Forecast By Country, 2017 to 2032

Table 17: South Asia Pacific Market Size (US$ Million) and Volume (Tons) Analysis and Forecast By Product Type, 2017 to 2032

Table 18: South Asia Pacific Market Size (US$ Million) and Volume (Tons) Analysis and Forecast By End to Use Industry, 2017 to 2032

Table 19: MEA Market Size (US$ Million) and Volume (Tons) Analysis and Forecast By Country, 2017 to 2032

Table 20: MEA Market Size (US$ Million) and Volume (Tons) Analysis and Forecast By Product Type, 2017 to 2032

Table 21: MEA Market Size (US$ Million) and Volume (Tons) Analysis and Forecast By End to Use Industry, 2017 to 2032
Nikhil Kaitwade
Nikhil Kaitwade

Principal Consultant

Talk to Analyst

Find your sweet spots for generating winning opportunities in this market.

List of Charts

Figure 01: Global Market Historical Volume (Tons), 2017 to 2021

Figure 02: Global Market Current and Forecast Volume (Tons), 2022 to 2032

Figure 03: Global Market Historical Value (US$ Million), 2017 to 2021

Figure 04: Global Market Current and Forecast Value (US$ Million), 2022 to 2032

Figure 05: Global Market Incremental $ Opportunity (US$ Million), 2022 to 2032

Figure 06: Global Market Share and BPS Analysis By Product Type, 2022 & 2032

Figure 07: Global Market Y to o Y Growth Projections By Product Type, 2022 to 2032

Figure 08: Global Market Attractiveness Analysis By Product Type, 2022 to 2032

Figure 09: Global Market Absolute $ Opportunity by Fluorosilicone Segment, 2017 to 2032

Figure 10: Global Market Absolute $ Opportunity by Fluorocarbon Segment, 2017 to 2032

Figure 11: Global Market Absolute $ Opportunity by PerSegment, 2017 to 2032

Figure 12: Global Market Share and BPS Analysis By End to Use Industry, 2022 & 2032

Figure 13: Global Market Y to o Y Growth Projections By End to Use Industry, 2022 to 2032

Figure 14: Global Market Attractiveness Analysis By End to Use Industry, 2022 to 2032

Figure 15: Global Market Absolute $ Opportunity by Aerospace Segment, 2017 to 2032

Figure 16: Global Market Absolute $ Opportunity by Automotive Segment, 2017 to 2032

Figure 17: Global Market Absolute $ Opportunity by Chemicals Segment, 2017 to 2032

Figure 18: Global Market Absolute $ Opportunity by Electronics Consumer and Wearables Segment, 2017 to 2032

Figure 19: Global Market Absolute $ Opportunity by Oil & Gas Energy Segment, 2017 to 2032

Figure 20: Global Market Absolute $ Opportunity by Pharmaceutical & Food Segment, 2017 to 2032

Figure 21: Global Market Absolute $ Opportunity by Others Segment, 2017 to 2032

Figure 22: Global Market Share and BPS Analysis By Region, 2022 & 2032

Figure 23: Global Market Y to o Y Growth Projections By Region, 2022 to 2032

Figure 24: Global Market Attractiveness Analysis By Region, 2022 to 2032

Figure 25: Global Market Absolute $ Opportunity by North America Segment, 2017 to 2032

Figure 26: Global Market Absolute $ Opportunity by Latin America Segment, 2017 to 2032

Figure 27: Global Market Absolute $ Opportunity by Europe Segment, 2017 to 2032

Figure 28: Global Market Absolute $ Opportunity by East Asia Segment, 2017 to 2032

Figure 29: Global Market Absolute $ Opportunity by South Asia Pacific Segment, 2017 to 2032

Figure 30: Global Market Absolute $ Opportunity by MEA Segment, 2017 to 2032

Figure 31: North America Market Share and BPS Analysis By Country, 2022 & 2032

Figure 32: North America Market Y to o Y Growth Projections By Country, 2022 to 2032

Figure 33: North America Market Attractiveness Analysis By Country, 2022 to 2032

Figure 34: North America Market Share and BPS Analysis By Product Type, 2022 & 2032

Figure 35: North America Market Y to o Y Growth Projections By Product Type, 2022 to 2032

Figure 36: North America Market Attractiveness Analysis By Product Type, 2022 to 2032

Figure 37: North America Market Share and BPS Analysis By End to Use Industry, 2022 & 2032

Figure 38: North America Market Y to o Y Growth Projections By End-to Use Industry, 2022 to 2032

Figure 39: North America Market Attractiveness Analysis By End to Use Industry, 2022 to 2032

Figure 40: Latin America Market Share and BPS Analysis By Country, 2022 & 2032

Figure 41: Latin America Market Y to o Y Growth Projections By Country, 2022 to 2032

Figure 42: Latin America Market Attractiveness Analysis By Country, 2022 to 2032

Figure 43: Latin America Market Share and BPS Analysis By Product Type, 2022 & 2032

Figure 45: Latin America Market Y to o Y Growth Projections By Product Type, 2022 to 2032

Figure 46: Latin America Market Attractiveness Analysis By Product Type, 2022 to 2032

Figure 47: Latin America Market Share and BPS Analysis By End to Use Industry, 2022 & 2032

Figure 48: Latin America Market Y to o Y Growth Projections By End-to Use Industry, 2022 to 2032

Figure 49: Latin America Market Attractiveness Analysis By End to Use Industry, 2022 to 2032

Figure 50: Europe Market Share and BPS Analysis By Country, 2022 & 2032

Figure 51: Europe Market Y to o Y Growth Projections By Country, 2022 to 2032

Figure 52: Europe Market Attractiveness Analysis By Country, 2022 to 2032

Figure 53: Europe Market Share and BPS Analysis By Product Type, 2022 & 2032

Figure 54: Europe Market Y to o Y Growth Projections By Product Type, 2022 to 2032

Figure 55: Europe Market Attractiveness Analysis By Product Type, 2022 to 2032

Figure 56: Europe Market Share and BPS Analysis By End to Use Industry, 2022 & 2032

Figure 57: Europe Market Y to o Y Growth Projections By End-to-Use Industry, 2022 to 2032

Figure 58: Europe Market Attractiveness Analysis By End to Use Industry, 2022 to 2032

Figure 59: East Asia Market Share and BPS Analysis By Country, 2022 & 2032

Figure 60: East Asia Market Y to o to Y Growth Projections By Country, 2022 to 2032

Figure 61: East Asia Market Attractiveness Analysis By Country, 2022 to 2032

Figure 62: East Asia Market Share and BPS Analysis By Product Type, 2022 & 2032

Figure 63: East Asia Market Y to o Y Growth Projections By Product Type, 2022 to 2032

Figure 64: East Asia Market Attractiveness Analysis By Product Type, 2022 to 2032

Figure 65: East Asia Market Share and BPS Analysis By End to Use Industry, 2022 & 2032

Figure 66: East Asia Market Y to o to Y Growth Projections By End to Use Industry, 2022 to 2032

Figure 67: East Asia Market Attractiveness Analysis By End to Use Industry, 2022 to 2032

Figure 68: South Asia Pacific Market Share and BPS Analysis By Country, 2022 & 2032

Figure 69: South Asia Pacific Market Y to o to Y Growth Projections By Country, 2022 to 2032

Figure 70: South Asia Pacific Market Attractiveness Analysis By Country, 2022 to 2032

Figure 71: South Asia Pacific Market Share and BPS Analysis By Product Type, 2022 & 2032

Figure 72: South Asia Pacific Market Y to o Y Growth Projections By Product Type, 2022 to 2032

Figure 73: South Asia Pacific Market Attractiveness Analysis By Product Type, 2022 to 2032

Figure 74: South Asia Pacific Market Share and BPS Analysis By End to Use Industry, 2022 & 2032

Figure 75: South Asia Pacific Market Y to o to Y Growth Projections By End to Use Industry, 2022 to 2032

Figure 76: South Asia Pacific Market Attractiveness Analysis By End to Use Industry, 2022 to 2032

Figure 77: MEA Market Share and BPS Analysis By Country, 2022 & 2032

Figure 78: MEA Market Y to o Y Growth Projections By Country, 2022 to 2032

Figure 79: MEA Market Attractiveness Analysis By Country, 2022 to 2032

Figure 80: MEA Market Share and BPS Analysis By Product Type, 2022 & 2032

Figure 81: MEA Market Y to o Y Growth Projections By Product Type, 2022 to 2032

Figure 82: MEA Market Attractiveness Analysis By Product Type, 2022 to 2032

Figure 83: MEA Market Share and BPS Analysis By End to Use Industry, 2022 & 2032

Figure 84: MEA Market Y to o Y Growth Projections By End to Use Industry, 2022 to 2032

Figure 85: MEA Market Attractiveness Analysis By End to Use Industry, 2022 to 2032

Recommendations

Automotive

Industry Analysis of Automotive Plastic in BRIC Countries

Published : February 2024

Chemicals & Materials

Fluoropolymer Market

Published : May 2023

Chemicals & Materials

APAC Fluoroelastomer Market

Published : November 2022

Explore Chemicals & Materials Insights

View Reports