Biomedical Refrigerator and Freezer Market Outlook (2024 to 2034)

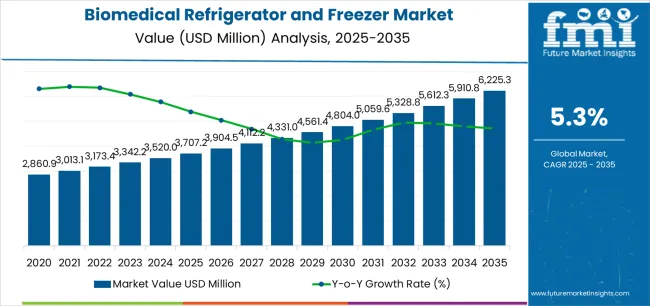
The global biomedical refrigerator and freezer market is anticipated to be worth USD 6,053.8 million by 2034. According to the estimates, the market is projected to clock a 5.60% CAGR until 2034. In 2024, the biomedical refrigerator and freezer market size is valued at USD 3,510.65 million.

Attributes Details
Biomedical Refrigerator and Freezer Market Size, 2023 USD 3,305.7 million
Biomedical Refrigerator and Freezer Market Size, 2024 USD 3,510.65 million
Biomedical Refrigerator and Freezer Market Size, 2034 USD 6,053.78 million
Value CAGR (2024 to 2034) 5.60%

Key Market Highlights

Rise of Biobanking and Cryopreservation Creates Opportunities in the Market

Businesses have the chance to develop cutting-edge medical cold storage equipment for the long-term preservation of biological materials due to the growth of biobanking operations and the growing interest in cryopreservation. This comprises cryogenic storage devices, ultra-low temperature freezers, and specific containers for holding onto priceless specimens like tissues and cells.

By meeting the particular requirements of biobanks, research centers, and pharmaceutical firms engaged in cryopreservation, businesses can capitalize on a developing market niche and position themselves as industry leaders in cryogenic storage technologies, propelling revenue development and market expansion.

Demand for Hybrid Storage Solutions Surges in the Market

The trend toward hybrid biomedical cold storage systems is gaining traction to satisfy the various temperature storage needs of various biological materials. These systems combine several temperature-controlled sections into one unit, giving customers the freedom to store different samples with different requirements for temperature.

This innovation solves the difficulty of handling a range of samples in a laboratory or healthcare environment while optimizing space use and streamlining procedures. Businesses that use hybrid storage solutions are suppliers of adaptable and effective storage choices, attracting a broad spectrum of clients with different storage requirements.

Companies Aim to Leverage the Burgeoning Field of Cell and Gene Therapy

The rapidly expanding arena of gene and cell therapy research has great potential to heal previously incurable diseases. However, biological materials employed in these therapies are sensitive, they need to be stored under particular circumstances, sometimes at extremely low temperatures.

The preservation of cell and gene therapy products' integrity and viability during the research and development phase greatly depends on biomedical cold storage units that can meet the rigorous temperature requirements.

By investing in state-of-the-art freezer technology specifically designed to meet the demands of cell and gene therapy research demands, businesses can establish themselves as key contributors to innovative medical breakthroughs, cultivate strategic alliances, and increase their market share in this rapidly expanding industry.

Historical Performance of the Biomedical Refrigerator and Freezer Market (2019 to 2023) Vs. Forecast Outlook (2024 to 2034)

Attributes Details
Biomedical Refrigerator and Freezer Market CAGR (2019 to 2023) 4.60%

The global biomedical refrigerator and freezer market size expanded at a 4.60% CAGR from 2019 to 2023. The growing prevalence of chronic illnesses has increased research activity in the healthcare industry.

This has resulted in a growing demand for storage solutions to preserve biological samples required for research and clinical trials, which has contributed to the growth of the biomedical refrigerator freezer market.

The increased emphasis on vaccine research for numerous infectious illnesses has driven growth in the biomedical refrigerator freezer industry. The necessity to store vaccines at extremely low temperatures has prompted a rise in investments in cutting-edge freezing and refrigeration technology, which has accelerated market growth.

Technological developments in the pharmaceutical freezer market, including IoT integration, smart monitoring, and energy-efficient features, have improved the functionality and economy of biomedical freezers and refrigerators. This has encouraged companies and academic institutions to modernize their storage infrastructure, which is propelling the market's growth even more.

In the coming years, the continued emphasis on vaccination programs, including routine immunizations and reactions to new infectious illnesses, is going to keep the demand for specialized biomedical refrigeration systems high. With the prospect of novel vaccinations and booster doses, the market for biomedical cold storage and distribution is expected to develop steadily.

The continuing improvements in biopharmaceuticals, gene treatments, and customized medicine are expected to increase the demand for precise and specialized storage conditions. Biomedical refrigerators and freezers can anticipate playing an important role in preserving the integrity of innovative medicines, hence driving market development.

Biomedical Refrigerator and Freezer Market Trends Analysis

Trends
  • In biomedical refrigeration, the use of blockchain technology is starting to gain traction, particularly in terms of guaranteeing the confidentiality and integrity of information attached to sample storage.
  • In addition to eco-friendly refrigerants, biomedical refrigeration systems with higher energy efficiency are increasingly popular.
  • An increasing focus is being placed on creating biomedical freezers and refrigerators with ergonomic features and user-friendly interfaces.
  • Biomedical cold storage units are getting progressively more secure with the use of biometric access control features like fingerprint or retina scanning.
  • Augmented reality integration is becoming increasingly popular for user training and maintenance protocols.
Opportunities
  • Companies have a chance to provide automated solutions, lowering manual handling mistakes and increasing overall operational efficiency by integrating robotic systems for sample handling into biomedical refrigeration units.
  • Providing pay-per-use or subscription-based structures for biomedical refrigeration services can be an innovative strategy.
  • Businesses can benefit by providing hybrid cloud solutions for analytics and data storage associated with equipment performance and temperature monitoring.
  • The intricacy of contemporary biomedical cold storage systems presents opportunities to offer educational and training services to end users, researchers, and lab staff.
  • Companies can create complex software and RFID/barcode-based systems in response to the growing need for sophisticated sample tracking and inventory management solutions.
Challenges
  • The appropriate recycling and disposal of medical-grade refrigeration that have reached the end of their useful lives can be difficult, particularly if they include components that are environmentally hazardous or outdated refrigerants.
  • Cybersecurity threats arise when IoT and connection capabilities are integrated into biomedical refrigeration systems. Risks like compromised data or unapproved entry into vital systems can jeopardize confidential data and cause disturbances in business processes.

Category-wise Insights

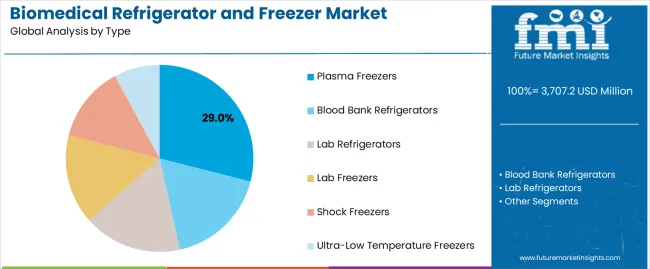
Plasma Freezers Dominate as the Leading Product in the Market

Segment Plasma Freezers (Product)
Value Share (2024) 29%

Based on product, the plasma freezer segment holds 29% of biomedical refrigerator and freezer market shares in 2024.

  • Demand for plasma freezers is expected to remain high due to the increasing incidence of chronic illnesses such as immunological disorders and hemophilia that need plasma-derived therapy. The plasma components required to treat various disorders are stored in these freezers, which is helpful.
  • Pharmaceutical businesses and research institutes are constantly laboring to create novel medications and cures made from plasma. The need for specialized plasma freezers is driven by preserving the viability and stability of plasma samples stored for research and development.

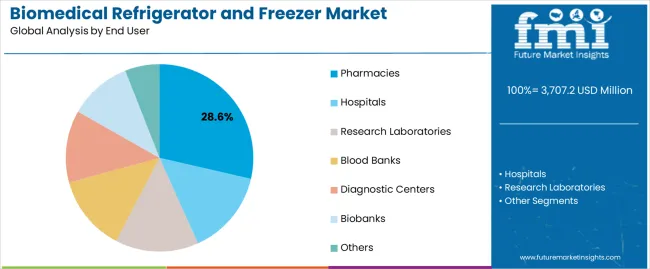
Pharmacies to Continue to be Leading End User

Segment Pharmacies (End User)
Value Share (2024) 28.60%

Based on end user, the pharmacies segment captured 28.60% of biomedical refrigerator and freezer market shares in 2024.

  • Biomedical refrigeration technology has advanced to the point that pharmacies find these units more appealing due to features like energy-efficient designs, real-time monitoring, and the incorporation of smart capabilities. The overall allure of biomedical cold storage units for pharmaceutical applications is increased by these technical advantages, improving efficiency and saving operating costs.
  • The growing prevalence of specialty pharmacies, which concentrate on dispensing drugs for difficult-to-treat and long-term illnesses, increases the necessity for biomedical preservation equipment, including biomedical refrigerators and freezers. These pharmacies frequently deal in expensive specialty medications that must be precisely regulated in temperature to remain effective.

Country-wise Insights

Countries Value CAGR (2024 to 2034)
India 7.60%
Germany 7.00%
China 7.80%
Japan 4.60%
Australia 2.90%

Government Initiatives and Investments Catapult Growth in India

The demand for biomedical refrigerators and freezers in India is projected to surge at a 7.60% CAGR through 2034.

  • The Indian government has made considerable investments in the healthcare industry, notably the National Health Mission (NHM) and Ayushman Bharat. These programs promote the modernization of healthcare infrastructure, creating a favorable atmosphere for acquiring and implementing innovative biomedical refrigeration systems.
  • In India, there is a rising emphasis on maintaining an effective cold chain for vaccine storage and shipping and other temperature-sensitive medications. Biomedical refrigeration and freezing systems support the country's cold chain infrastructure, meeting the growing need for dependable storage in the pharmaceutical industry.

Growing Biobanking Activities Foster Market Growth in Germany

The sales of biomedical refrigerators and freezers in Germany are anticipated to rise at a 7.00% CAGR through 2034.

  • Germany has an abundance of biobanks dedicated to collecting, preserving, and maintaining biological specimens for research purposes. The growth of biobanking operations increases the demand for medical-grade refrigeration systems capable of storing a wide range of sample types under regulated circumstances, including tissues, cells, and DNA.
  • Germany has one of the most strict regulatory frameworks for healthcare and pharmaceuticals in the world. Compliance with regulatory requirements, such as Good Manufacturing Practice (GMP) and Good Distribution Practice (GDP), generates demand for biomedical refrigeration systems that assure product safety, effectiveness, and traceability across the supply chain.

Healthcare Reform and Modernization Initiatives Aid Market Expansion in China

The biomedical refrigerator and freezer market growth in China is estimated at a 7.80% CAGR through 2034.

  • China's ongoing healthcare reform and modernization programs, which aim to improve accessibility, cost, and quality of healthcare services, are driving significant investment in healthcare infrastructure. This flood of funds creates a strong need for cutting-edge biomedical refrigeration systems to improve storage capacity in hospitals, clinics, and research organizations.
  • China is prioritizing precision medicine and genomic research to customize healthcare solutions to specific patient profiles. The need to store and preserve genetic materials, biomarkers, and tailored pharmaceuticals drives demand for specialized biomedical refrigeration and freezing systems, contributing to market growth in this niche segment.

Regenerative Medicine Advancements Fuel Sales in Japan

The demand for biomedical refrigerators and freezers in Japan is expected to increase at a 4.60% CAGR through 2034.

  • Japan continues to be at the vanguard of regenerative medicine research and applications. The advancement of regenerative medicine, such as cell treatments and tissue engineering, necessitates the development of specialized biological cold storage technologies. Biomedical refrigerators and freezers are critical in maintaining the viability and efficacy of regenerative medicine products, which drives market growth.
  • Japan's adoption of Industry 4.0 technologies, which include automation, networking, and data-driven operations, has an impact on the biomedical cold storage environment. The adoption of biomedical refrigerators in healthcare settings is fueled by their smart feature set, predictive maintenance capabilities, and real-time monitoring, all of which are in line with Japan's Industry 4.0 vision.

Strategic Focus on Digital Health Amplifies Market Growth in Australia

The sales of biomedical refrigerators and freezers in Australia are predicted to rise at a 2.90% CAGR through 2034.

  • Biomedical refrigerator and freezer manufacturers have the opportunity to offer solutions that interface with digital health platforms due to Australia's ongoing emphasis on telemedicine and digital health initiatives. This alignment puts businesses in a competitive position in a market that is embracing digitization and supports the changing healthcare environment.
  • Buying decisions are influenced by Australia's cultural emphasis on environmental sustainability and eco-friendly methods. Australian sustainability principles are reflected in the increased market appeal of biomedical refrigerators and freezer manufacturers that integrate eco-friendly technology, energy-efficient designs, and environmentally friendly refrigerants.

Competitive Landscape

The biomedical freezer and refrigerator market is marked by an active rivalry between existing industry leaders, emerging competitors, and innovators with a specific focus on a specialty. Important players in the market employ strict tactics to get a competitive edge in a field characterized by regulatory compliance, technical innovation, and changing consumer needs.

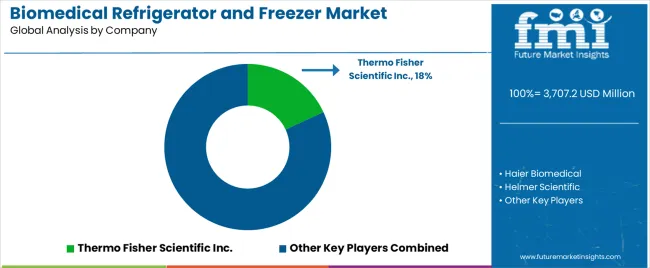
Using their vast R&D resources and global reach, industry leaders, including Helmer Scientific, Haier Biomedical, and Thermo Fisher Scientific Inc., control a significant portion of the market.

Recent Developments

  • In October 2023, Haier Biomedical introduced a new range of energy-saving TwinCool frequency conversion ULT freezers for pharmaceutical, clinical research, and public health laboratories. This sample storage system includes numerous unique technologies, including frequency conversion compressors for low power consumption and a dual refrigeration system, to keep samples safe and secure while minimizing environmental effects.
  • In February 2023, PHC Corporation of North America, a supplier of the PHCbi brand of cell preservation and growth products in North and Latin American markets, released the PHCbi brand VIP ECO® SMART ultra-low temperature freezer series for use in medical institutions, universities, and pharmaceutical businesses.

Key Players in the Biomedical Refrigerator and Freezer Market

  • Thermo Fisher Scientific Inc.
  • Haier Biomedical
  • Helmer Scientific
  • Eppendorf AG
  • Panasonic Healthcare Co., Ltd.
  • PHC Holdings Corporation
  • B Medical Systems S.à r.l.
  • Liebherr Group
  • Terumo Corporation
  • Labcold Ltd.
  • ARCTIKO A/S
  • Follett LLC
  • Vestfrost Solutions
  • EVERmed S.r.l.
  • Accucold by Summit Appliance
  • LEC Medical
  • Stirling Ultracold
  • Froilabo
  • Bionics Scientific Technologies (P) Ltd.
  • Fiocchetti

Biomedical Refrigerator and Freezer Market Segmentation

By Product:

  • Blood Bank Refrigerators
  • Lab Refrigerators
  • Lab Freezers
  • Plasma Freezers
  • Shock Freezers
  • Ultra-low Temperature Freezers

By End User:

  • Hospitals
  • Research Laboratories
  • Pharmaceutical and Biotechnology Companies
  • Blood Banks
  • Diagnostic Centers
  • Pharmacies
  • Biobanks
  • Academic and Research Institutes

By Region:

  • North America
  • Latin America
  • Western Europe
  • Eastern Europe
  • Asia Pacific (APAC)
  • Middle East & Africa (MEA)
  • Japan

Table of Content

  • 1. Executive Summary
  • 2. Market Overview
  • 3. Market Background
  • 4. Global Market Analysis 2019 to 2023 and Forecast, 2024 to 2034
  • 5. Global Market Analysis 2019 to 2023 and Forecast 2024 to 2034, By Product
    • 5.1. Plasma Freezers
    • 5.2. Blood Bank Refrigerators
    • 5.3. Ultra-Low Temperature Freezers
    • 5.4. Shock Freezers
    • 5.5. Pharmacy Refrigerators
    • 5.6. Medical Refrigerators
    • 5.7. Laboratory Refrigerators
    • 5.8. Cryogenic Storage Systems
  • 6. Global Market Analysis 2019 to 2023 and Forecast 2024 to 2034, By End User
    • 6.1. Hospitals
    • 6.2. Research Laboratories
    • 6.3. Pharmacies
    • 6.4. Diagnostic Centres
    • 6.5. Blood Banks
  • 7. Global Market Analysis 2019 to 2023 and Forecast 2024 to 2034, By Region
    • 7.1. North America
    • 7.2. Latin America
    • 7.3. Western Europe
    • 7.4. Eastern Europe
    • 7.5. South Asia and Pacific
    • 7.6. East Asia
    • 7.7. Middle East and Africa
  • 8. North America Market Analysis 2019 to 2023 and Forecast 2024 to 2034, By Country
  • 9. Latin America Market Analysis 2019 to 2023 and Forecast 2024 to 2034, By Country
  • 10. Western Europe Market Analysis 2019 to 2023 and Forecast 2024 to 2034, By Country
  • 11. Eastern Europe Market Analysis 2019 to 2023 and Forecast 2024 to 2034, By Country
  • 12. South Asia and Pacific Market Analysis 2019 to 2023 and Forecast 2024 to 2034, By Country
  • 13. East Asia Market Analysis 2019 to 2023 and Forecast 2024 to 2034, By Country
  • 14. Middle East and Africa Market Analysis 2019 to 2023 and Forecast 2024 to 2034, By Country
  • 15. Key Countries Market Analysis
  • 16. Market Structure Analysis
  • 17. Competition Analysis
    • 17.1. Aegis Scientific Inc.
    • 17.2. Helmer Inc.
    • 17.3. Binder GmbH
    • 17.4. Biomedical Solutions Inc.
    • 17.5. Bionics Scientific Technologies Co. Ltd.
    • 17.6. Coldway SA
    • 17.7. Desmon S.p.A
    • 17.8. Eppendorf AG
    • 17.9. Froilabo SAS
    • 17.10. Gram Commercial SAS
    • 17.11. Arctiko A/S
  • 18. Assumptions & Acronyms Used
  • 19. Research Methodology

List of Tables

Table 1: Global Market Value (US$ Million) Forecast by Region, 2019 to 2034

Table 2: Global Market Volume (Units) Forecast by Region, 2019 to 2034

Table 3: Global Market Value (US$ Million) Forecast by Product, 2019 to 2034

Table 4: Global Market Volume (Units) Forecast by Product, 2019 to 2034

Table 5: Global Market Value (US$ Million) Forecast by End User, 2019 to 2034

Table 6: Global Market Volume (Units) Forecast by End User, 2019 to 2034

Table 7: North America Market Value (US$ Million) Forecast by Country, 2019 to 2034

Table 8: North America Market Volume (Units) Forecast by Country, 2019 to 2034

Table 9: North America Market Value (US$ Million) Forecast by Product, 2019 to 2034

Table 10: North America Market Volume (Units) Forecast by Product, 2019 to 2034

Table 11: North America Market Value (US$ Million) Forecast by End User, 2019 to 2034

Table 12: North America Market Volume (Units) Forecast by End User, 2019 to 2034

Table 13: Latin America Market Value (US$ Million) Forecast by Country, 2019 to 2034

Table 14: Latin America Market Volume (Units) Forecast by Country, 2019 to 2034

Table 15: Latin America Market Value (US$ Million) Forecast by Product, 2019 to 2034

Table 16: Latin America Market Volume (Units) Forecast by Product, 2019 to 2034

Table 17: Latin America Market Value (US$ Million) Forecast by End User, 2019 to 2034

Table 18: Latin America Market Volume (Units) Forecast by End User, 2019 to 2034

Table 19: Western Europe Market Value (US$ Million) Forecast by Country, 2019 to 2034

Table 20: Western Europe Market Volume (Units) Forecast by Country, 2019 to 2034

Table 21: Western Europe Market Value (US$ Million) Forecast by Product, 2019 to 2034

Table 22: Western Europe Market Volume (Units) Forecast by Product, 2019 to 2034

Table 23: Western Europe Market Value (US$ Million) Forecast by End User, 2019 to 2034

Table 24: Western Europe Market Volume (Units) Forecast by End User, 2019 to 2034

Table 25: Eastern Europe Market Value (US$ Million) Forecast by Country, 2019 to 2034

Table 26: Eastern Europe Market Volume (Units) Forecast by Country, 2019 to 2034

Table 27: Eastern Europe Market Value (US$ Million) Forecast by Product, 2019 to 2034

Table 28: Eastern Europe Market Volume (Units) Forecast by Product, 2019 to 2034

Table 29: Eastern Europe Market Value (US$ Million) Forecast by End User, 2019 to 2034

Table 30: Eastern Europe Market Volume (Units) Forecast by End User, 2019 to 2034

Table 31: South Asia and Pacific Market Value (US$ Million) Forecast by Country, 2019 to 2034

Table 32: South Asia and Pacific Market Volume (Units) Forecast by Country, 2019 to 2034

Table 33: South Asia and Pacific Market Value (US$ Million) Forecast by Product, 2019 to 2034

Table 34: South Asia and Pacific Market Volume (Units) Forecast by Product, 2019 to 2034

Table 35: South Asia and Pacific Market Value (US$ Million) Forecast by End User, 2019 to 2034

Table 36: South Asia and Pacific Market Volume (Units) Forecast by End User, 2019 to 2034

Table 37: East Asia Market Value (US$ Million) Forecast by Country, 2019 to 2034

Table 38: East Asia Market Volume (Units) Forecast by Country, 2019 to 2034

Table 39: East Asia Market Value (US$ Million) Forecast by Product, 2019 to 2034

Table 40: East Asia Market Volume (Units) Forecast by Product, 2019 to 2034

Table 41: East Asia Market Value (US$ Million) Forecast by End User, 2019 to 2034

Table 42: East Asia Market Volume (Units) Forecast by End User, 2019 to 2034

Table 43: Middle East and Africa Market Value (US$ Million) Forecast by Country, 2019 to 2034

Table 44: Middle East and Africa Market Volume (Units) Forecast by Country, 2019 to 2034

Table 45: Middle East and Africa Market Value (US$ Million) Forecast by Product, 2019 to 2034

Table 46: Middle East and Africa Market Volume (Units) Forecast by Product, 2019 to 2034

Table 47: Middle East and Africa Market Value (US$ Million) Forecast by End User, 2019 to 2034

Table 48: Middle East and Africa Market Volume (Units) Forecast by End User, 2019 to 2034

List of Figures

Figure 1: Global Market Value (US$ Million) by Product, 2024 to 2034

Figure 2: Global Market Value (US$ Million) by End User, 2024 to 2034

Figure 3: Global Market Value (US$ Million) by Region, 2024 to 2034

Figure 4: Global Market Value (US$ Million) Analysis by Region, 2019 to 2034

Figure 5: Global Market Volume (Units) Analysis by Region, 2019 to 2034

Figure 6: Global Market Value Share (%) and BPS Analysis by Region, 2024 to 2034

Figure 7: Global Market Y-o-Y Growth (%) Projections by Region, 2024 to 2034

Figure 8: Global Market Value (US$ Million) Analysis by Product, 2019 to 2034

Figure 9: Global Market Volume (Units) Analysis by Product, 2019 to 2034

Figure 10: Global Market Value Share (%) and BPS Analysis by Product, 2024 to 2034

Figure 11: Global Market Y-o-Y Growth (%) Projections by Product, 2024 to 2034

Figure 12: Global Market Value (US$ Million) Analysis by End User, 2019 to 2034

Figure 13: Global Market Volume (Units) Analysis by End User, 2019 to 2034

Figure 14: Global Market Value Share (%) and BPS Analysis by End User, 2024 to 2034

Figure 15: Global Market Y-o-Y Growth (%) Projections by End User, 2024 to 2034

Figure 16: Global Market Attractiveness by Product, 2024 to 2034

Figure 17: Global Market Attractiveness by End User, 2024 to 2034

Figure 18: Global Market Attractiveness by Region, 2024 to 2034

Figure 19: North America Market Value (US$ Million) by Product, 2024 to 2034

Figure 20: North America Market Value (US$ Million) by End User, 2024 to 2034

Figure 21: North America Market Value (US$ Million) by Country, 2024 to 2034

Figure 22: North America Market Value (US$ Million) Analysis by Country, 2019 to 2034

Figure 23: North America Market Volume (Units) Analysis by Country, 2019 to 2034

Figure 24: North America Market Value Share (%) and BPS Analysis by Country, 2024 to 2034

Figure 25: North America Market Y-o-Y Growth (%) Projections by Country, 2024 to 2034

Figure 26: North America Market Value (US$ Million) Analysis by Product, 2019 to 2034

Figure 27: North America Market Volume (Units) Analysis by Product, 2019 to 2034

Figure 28: North America Market Value Share (%) and BPS Analysis by Product, 2024 to 2034

Figure 29: North America Market Y-o-Y Growth (%) Projections by Product, 2024 to 2034

Figure 30: North America Market Value (US$ Million) Analysis by End User, 2019 to 2034

Figure 31: North America Market Volume (Units) Analysis by End User, 2019 to 2034

Figure 32: North America Market Value Share (%) and BPS Analysis by End User, 2024 to 2034

Figure 33: North America Market Y-o-Y Growth (%) Projections by End User, 2024 to 2034

Figure 34: North America Market Attractiveness by Product, 2024 to 2034

Figure 35: North America Market Attractiveness by End User, 2024 to 2034

Figure 36: North America Market Attractiveness by Country, 2024 to 2034

Figure 37: Latin America Market Value (US$ Million) by Product, 2024 to 2034

Figure 38: Latin America Market Value (US$ Million) by End User, 2024 to 2034

Figure 39: Latin America Market Value (US$ Million) by Country, 2024 to 2034

Figure 40: Latin America Market Value (US$ Million) Analysis by Country, 2019 to 2034

Figure 41: Latin America Market Volume (Units) Analysis by Country, 2019 to 2034

Figure 42: Latin America Market Value Share (%) and BPS Analysis by Country, 2024 to 2034

Figure 43: Latin America Market Y-o-Y Growth (%) Projections by Country, 2024 to 2034

Figure 44: Latin America Market Value (US$ Million) Analysis by Product, 2019 to 2034

Figure 45: Latin America Market Volume (Units) Analysis by Product, 2019 to 2034

Figure 46: Latin America Market Value Share (%) and BPS Analysis by Product, 2024 to 2034

Figure 47: Latin America Market Y-o-Y Growth (%) Projections by Product, 2024 to 2034

Figure 48: Latin America Market Value (US$ Million) Analysis by End User, 2019 to 2034

Figure 49: Latin America Market Volume (Units) Analysis by End User, 2019 to 2034

Figure 50: Latin America Market Value Share (%) and BPS Analysis by End User, 2024 to 2034

Figure 51: Latin America Market Y-o-Y Growth (%) Projections by End User, 2024 to 2034

Figure 52: Latin America Market Attractiveness by Product, 2024 to 2034

Figure 53: Latin America Market Attractiveness by End User, 2024 to 2034

Figure 54: Latin America Market Attractiveness by Country, 2024 to 2034

Figure 55: Western Europe Market Value (US$ Million) by Product, 2024 to 2034

Figure 56: Western Europe Market Value (US$ Million) by End User, 2024 to 2034

Figure 57: Western Europe Market Value (US$ Million) by Country, 2024 to 2034

Figure 58: Western Europe Market Value (US$ Million) Analysis by Country, 2019 to 2034

Figure 59: Western Europe Market Volume (Units) Analysis by Country, 2019 to 2034

Figure 60: Western Europe Market Value Share (%) and BPS Analysis by Country, 2024 to 2034

Figure 61: Western Europe Market Y-o-Y Growth (%) Projections by Country, 2024 to 2034

Figure 62: Western Europe Market Value (US$ Million) Analysis by Product, 2019 to 2034

Figure 63: Western Europe Market Volume (Units) Analysis by Product, 2019 to 2034

Figure 64: Western Europe Market Value Share (%) and BPS Analysis by Product, 2024 to 2034

Figure 65: Western Europe Market Y-o-Y Growth (%) Projections by Product, 2024 to 2034

Figure 66: Western Europe Market Value (US$ Million) Analysis by End User, 2019 to 2034

Figure 67: Western Europe Market Volume (Units) Analysis by End User, 2019 to 2034

Figure 68: Western Europe Market Value Share (%) and BPS Analysis by End User, 2024 to 2034

Figure 69: Western Europe Market Y-o-Y Growth (%) Projections by End User, 2024 to 2034

Figure 70: Western Europe Market Attractiveness by Product, 2024 to 2034

Figure 71: Western Europe Market Attractiveness by End User, 2024 to 2034

Figure 72: Western Europe Market Attractiveness by Country, 2024 to 2034

Figure 73: Eastern Europe Market Value (US$ Million) by Product, 2024 to 2034

Figure 74: Eastern Europe Market Value (US$ Million) by End User, 2024 to 2034

Figure 75: Eastern Europe Market Value (US$ Million) by Country, 2024 to 2034

Figure 76: Eastern Europe Market Value (US$ Million) Analysis by Country, 2019 to 2034

Figure 77: Eastern Europe Market Volume (Units) Analysis by Country, 2019 to 2034

Figure 78: Eastern Europe Market Value Share (%) and BPS Analysis by Country, 2024 to 2034

Figure 79: Eastern Europe Market Y-o-Y Growth (%) Projections by Country, 2024 to 2034

Figure 80: Eastern Europe Market Value (US$ Million) Analysis by Product, 2019 to 2034

Figure 81: Eastern Europe Market Volume (Units) Analysis by Product, 2019 to 2034

Figure 82: Eastern Europe Market Value Share (%) and BPS Analysis by Product, 2024 to 2034

Figure 83: Eastern Europe Market Y-o-Y Growth (%) Projections by Product, 2024 to 2034

Figure 84: Eastern Europe Market Value (US$ Million) Analysis by End User, 2019 to 2034

Figure 85: Eastern Europe Market Volume (Units) Analysis by End User, 2019 to 2034

Figure 86: Eastern Europe Market Value Share (%) and BPS Analysis by End User, 2024 to 2034

Figure 87: Eastern Europe Market Y-o-Y Growth (%) Projections by End User, 2024 to 2034

Figure 88: Eastern Europe Market Attractiveness by Product, 2024 to 2034

Figure 89: Eastern Europe Market Attractiveness by End User, 2024 to 2034

Figure 90: Eastern Europe Market Attractiveness by Country, 2024 to 2034

Figure 91: South Asia and Pacific Market Value (US$ Million) by Product, 2024 to 2034

Figure 92: South Asia and Pacific Market Value (US$ Million) by End User, 2024 to 2034

Figure 93: South Asia and Pacific Market Value (US$ Million) by Country, 2024 to 2034

Figure 94: South Asia and Pacific Market Value (US$ Million) Analysis by Country, 2019 to 2034

Figure 95: South Asia and Pacific Market Volume (Units) Analysis by Country, 2019 to 2034

Figure 96: South Asia and Pacific Market Value Share (%) and BPS Analysis by Country, 2024 to 2034

Figure 97: South Asia and Pacific Market Y-o-Y Growth (%) Projections by Country, 2024 to 2034

Figure 98: South Asia and Pacific Market Value (US$ Million) Analysis by Product, 2019 to 2034

Figure 99: South Asia and Pacific Market Volume (Units) Analysis by Product, 2019 to 2034

Figure 100: South Asia and Pacific Market Value Share (%) and BPS Analysis by Product, 2024 to 2034

Figure 101: South Asia and Pacific Market Y-o-Y Growth (%) Projections by Product, 2024 to 2034

Figure 102: South Asia and Pacific Market Value (US$ Million) Analysis by End User, 2019 to 2034

Figure 103: South Asia and Pacific Market Volume (Units) Analysis by End User, 2019 to 2034

Figure 104: South Asia and Pacific Market Value Share (%) and BPS Analysis by End User, 2024 to 2034

Figure 105: South Asia and Pacific Market Y-o-Y Growth (%) Projections by End User, 2024 to 2034

Figure 106: South Asia and Pacific Market Attractiveness by Product, 2024 to 2034

Figure 107: South Asia and Pacific Market Attractiveness by End User, 2024 to 2034

Figure 108: South Asia and Pacific Market Attractiveness by Country, 2024 to 2034

Figure 109: East Asia Market Value (US$ Million) by Product, 2024 to 2034

Figure 110: East Asia Market Value (US$ Million) by End User, 2024 to 2034

Figure 111: East Asia Market Value (US$ Million) by Country, 2024 to 2034

Figure 112: East Asia Market Value (US$ Million) Analysis by Country, 2019 to 2034

Figure 113: East Asia Market Volume (Units) Analysis by Country, 2019 to 2034

Figure 114: East Asia Market Value Share (%) and BPS Analysis by Country, 2024 to 2034

Figure 115: East Asia Market Y-o-Y Growth (%) Projections by Country, 2024 to 2034

Figure 116: East Asia Market Value (US$ Million) Analysis by Product, 2019 to 2034

Figure 117: East Asia Market Volume (Units) Analysis by Product, 2019 to 2034

Figure 118: East Asia Market Value Share (%) and BPS Analysis by Product, 2024 to 2034

Figure 119: East Asia Market Y-o-Y Growth (%) Projections by Product, 2024 to 2034

Figure 120: East Asia Market Value (US$ Million) Analysis by End User, 2019 to 2034

Figure 121: East Asia Market Volume (Units) Analysis by End User, 2019 to 2034

Figure 122: East Asia Market Value Share (%) and BPS Analysis by End User, 2024 to 2034

Figure 123: East Asia Market Y-o-Y Growth (%) Projections by End User, 2024 to 2034

Figure 124: East Asia Market Attractiveness by Product, 2024 to 2034

Figure 125: East Asia Market Attractiveness by End User, 2024 to 2034

Figure 126: East Asia Market Attractiveness by Country, 2024 to 2034

Figure 127: Middle East and Africa Market Value (US$ Million) by Product, 2024 to 2034

Figure 128: Middle East and Africa Market Value (US$ Million) by End User, 2024 to 2034

Figure 129: Middle East and Africa Market Value (US$ Million) by Country, 2024 to 2034

Figure 130: Middle East and Africa Market Value (US$ Million) Analysis by Country, 2019 to 2034

Figure 131: Middle East and Africa Market Volume (Units) Analysis by Country, 2019 to 2034

Figure 132: Middle East and Africa Market Value Share (%) and BPS Analysis by Country, 2024 to 2034

Figure 133: Middle East and Africa Market Y-o-Y Growth (%) Projections by Country, 2024 to 2034

Figure 134: Middle East and Africa Market Value (US$ Million) Analysis by Product, 2019 to 2034

Figure 135: Middle East and Africa Market Volume (Units) Analysis by Product, 2019 to 2034

Figure 136: Middle East and Africa Market Value Share (%) and BPS Analysis by Product, 2024 to 2034

Figure 137: Middle East and Africa Market Y-o-Y Growth (%) Projections by Product, 2024 to 2034

Figure 138: Middle East and Africa Market Value (US$ Million) Analysis by End User, 2019 to 2034

Figure 139: Middle East and Africa Market Volume (Units) Analysis by End User, 2019 to 2034

Figure 140: Middle East and Africa Market Value Share (%) and BPS Analysis by End User, 2024 to 2034

Figure 141: Middle East and Africa Market Y-o-Y Growth (%) Projections by End User, 2024 to 2034

Figure 142: Middle East and Africa Market Attractiveness by Product, 2024 to 2034

Figure 143: Middle East and Africa Market Attractiveness by End User, 2024 to 2034

Figure 144: Middle East and Africa Market Attractiveness by Country, 2024 to 2034

Frequently Asked Questions

How Big is the Biomedical Refrigerator and Freezer Market?

The biomedical refrigerator and freezer market is valued at USD 3,510.65 million in 2024.

What is the Projected CAGR of the Biomedical Refrigerator and Freezer Market?

The biomedical refrigerator and freezer market size is estimated to increase at a 5.60% CAGR through 2034.

What is the Future Outlook for the Biomedical Refrigerator and Freezer Market?

The biomedical refrigerator and freezer market is anticipated to be worth USD 6,053.78 million by 2034.

Which is the Leading Product in the Biomedical Refrigerator and Freezer Market?

Plasma freezers witness high demand in the industry.

Which Country is Rising at a Higher CAGR in the Biomedical Refrigerator and Freezer Market?

The biomedical refrigerator and freezer market in China is predicted to rise at a 7.80% CAGR through 2034.

Explore Similar Insights

Future Market Insights

Biomedical Refrigerator and Freezer Market