

- Market Size (2026)
- USD 1.2 Bn
- Forecast (2036)
- USD 1.8 Bn
- CAGR (2026 to 2036)
- 4.1%
N-Methyl-2-Pyrrolidone Market Size, Market Forecast and Outlook By FMI
The n-methyl-2-pyrrolidone market size was valued at USD 1.1 billion in 2025. Industry is anticipated to cross USD 1.2 billion in 2026 and reach USD 1.8 billion by 2036 at 4.1% CAGR. Fresh NMP is projected to account for 75.0% share by product in 2026. By distribution channel, direct sales are expected to hold 58.0% share in 2026.
Summary of the N-Methyl-2-Pyrrolidone Market
- Demand and Growth Drivers
- Lithium-ion battery coating activity is lifting N-Methyl-2-Pyrrolidone consumption through 2036 as electrode slurry production needs stable solvent performance.
- Electronics-grade N-Methyl-2-Pyrrolidone demand continues as semiconductor cleaning and photoresist stripping need low residue levels during wafer processing.
- Petrochemical and coatings manufacturers support steady consumption as N-Methyl-2-Pyrrolidone is used for extraction work and polymer resin dissolution.
- Product and Segment View
- Fresh NMP is projected to account for 75.0% share in 2026 due to quality assurance and consistent purity in regulated use.
- Industrial grade is expected to represent 50.0% share in 2026 as standard chemical processes need cost-controlled solvent supply.
- Direct sales are forecast to capture 58.0% share in 2026 since large buyers prefer audited supply contracts.
- Geography and Competitive Outlook
- India is projected to record 7.0% CAGR by 2036 with chemical output and electronics assembly raising solvent use.
- China is expected to expand at 5.2% CAGR by 2036 as battery and electronics plants keep high-purity solvent demand active.
- BASF SE and LyondellBasell Industries Holdings B.V. hold strong positions due to integrated chemical production and global supply reach.
- Analyst Opinion
- Nikhil Kaitwade, Principal Consultant for Chemicals and Materials, FMI, observes, “NMP buyers have moved beyond price-only sourcing toward a clearer focus on solvent assurance and recovery performance. Suppliers who can consistently demonstrate low metal content and strong recovery support are competing on volume and building defensible and long-term customer relationships. As safety regulations tighten, qualification records will more often determine who stays on the approved list, especially in electronics and petrochemicals.”
- N-Methyl-2-Pyrrolidone Market Value Analysis
- N-Methyl-2-Pyrrolidone is moving from general solvent use toward higher-specification demand in batteries and electronics.
- Battery manufacturers are expected to raise solvent consumption as lithium-ion electrode coating expands across cell production lines.
- Electronics-grade N-Methyl-2-Pyrrolidone is gaining preference since wafer cleaning and photoresist stripping need low residue performance.
- Demand is supported by petrochemical and coatings applications where solvent strength affects extraction quality and resin processing.
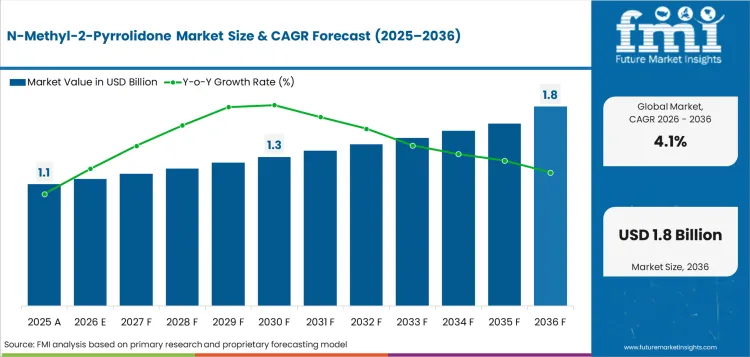
Key Takeaways, Market Size, and Forecast
| Metric | Value |
|---|---|
| Market Size (2025) | USD 1.1 Billion |
| Market Size (2036) | USD 1.8 Billion |
| CAGR (2026–2036) | 4.1% |
| Market Size (2026) | USD 0.6 Billion |
| Leading Material (2026) | Fresh NMP |
| Fresh NMP Share (2026) | 75.0% |
| Leading Distribution Channel (2026) | Direct Sales |
| Direct Sales Share (2026) | 58.0% |
| Fastest-Growing Country | India |
| India CAGR | 7.0% |
N-Methyl-2-Pyrrolidone remains important as battery plants need a high-purity solvent for electrode coating and binder handling. Electronics and petrochemical users support demand through cleaning and extraction work. International Energy Agency material from May 2025 stated global electric car sales topped 17 million in 2024 and rose above 25%. Higher battery output gives NMP suppliers a wider solvent pool across cathode coating and lithium-ion cell manufacturing. Semiconductor Industry Association material from February 2026 stated global semiconductor sales reached USD 791.7 billion in 2025. Eastman lists NMP as a high-boiling polar aprotic solvent used for engineering polymers and coating resins. LyondellBasell states that NMP serves electronics along with coatings and pharmaceuticals. Solvent quality has become a direct process yield and compliance issue for NMP buyers.
N-Methyl-2-Pyrrolidone Market Definition
Sector scope covers NMP sold for industrial solvent use across petrochemical processing and electronics cleaning. Battery electrode processing and pharmaceutical solubilizer use are included when NMP is sold as a process solvent. Paint stripping and coatings formulation are included within industrial use. Revenue scope includes fresh material and recycled NMP that re-enters approved industrial supply. N-ethyl-2-pyrrolidone and other substitute solvents are outside the main value boundary unless discussed as competitive alternatives.
N-Methyl-2-Pyrrolidone Market Inclusions
Market scope covers commercially sold fresh NMP and recovered NMP. Product and purity grade form the main segmentation. Application and end use assess how buyers specify solvent performance. Distribution channel shows how supply is purchased by large chemical users and smaller customers. Stakeholders include chemical manufacturers and specialty distributors. Electronics fabricators and petrochemical plants influence grade selection. Regulatory bodies influence exposure control and documentation standards.
N-Methyl-2-Pyrrolidone Market Exclusions
Study scope excludes captive solvent made and consumed inside one site without external sale. Dimethyl sulfoxide and green solvents are excluded as separate product families. Finished battery cells and semiconductor chips are outside scope. General coating resins are excluded unless NMP is sold as a solvent into the formulation. Waste solvent disposal is excluded unless recovered material is sold back into solvent supply.
N-Methyl-2-Pyrrolidone Market Research Methodology
- Primary Research: FMI analysts reviewed solvent buyer needs across petrochemical units and electronics cleaning. Interviews focused on purity control and exposure management. Recovery economics and direct supply contracts were reviewed for channel fit.
- Desk Research: Desk review used public chemical safety actions and semiconductor industry data. Battery demand sources and government manufacturing indicators were checked for end-use direction. Company product pages were reviewed to confirm active NMP supply.
- Market Sizing and Forecasting: Forecast work combined supplied market anchors with solvent use intensity across petrochemical processing and electronics. Country-level chemical output and downstream industry growth were used to adjust regional demand.
- Data Validation: Segment shares were checked against grade use and purchasing route patterns. Forecast outputs were compared with adjacent specialty solvent and battery materials categories to keep sizing realistic.
Why is the N-Methyl-2-Pyrrolidone market growing?
- Petrochemical processors support steady NMP consumption as selective extraction work uses the solvent for aromatics and butadiene recovery.
- Electronics users are using more high-purity NMP for photoresist stripping and cleaning steps requiring low residue levels.
- Battery material producers use NMP with polyvinylidene fluoride binders during cathode slurry preparation across many lithium-ion battery lines.
Petrochemical processing gives NMP a steady industrial anchor during the forecast period. Eastman states that NMP is used as an extraction medium for butadiene recovery and BTX extraction. This extraction use connects the solvent to refinery and chemical separation work instead of only general cleaning. Buyers in these units value selectivity and recovery performance over low price alone. Supplier fit depends on solvent consistency and technical support for closed-loop recovery.
Electronics and battery activity creates a higher-purity layer for NMP suppliers. Semiconductor Industry Association data released in February 2026 said global semiconductor sales reached USD 791.7 billion in 2025. International Energy Agency battery analysis published in May 2025 said electric vehicle battery demand was about 1 TWh in 2024. Advanced chip production and battery electrode coating make impurity control more relevant to the forecast. Suppliers need cleaner grades and tighter quality checks for these accounts.
Market Segmentation Analysis
- Fresh NMP is projected to represent 75.0% share in 2026 as qualified users prefer virgin supply for critical processing.
- Industrial grade is expected to secure 50.0% share in 2026 with bulk chemical processing and coatings using standard specifications.
- Petrochemical processing is anticipated to account for 30.0% share in 2026 due to separation units keeping established solvent circuits.
- Chemical industry end use is forecast to represent 38.0% share in 2026, led by refinery and specialty chemical plants buying repeat volumes.
- Direct sales are projected to reach 58.0% share in 2026 since large buyers need contract supply and traceable documentation.
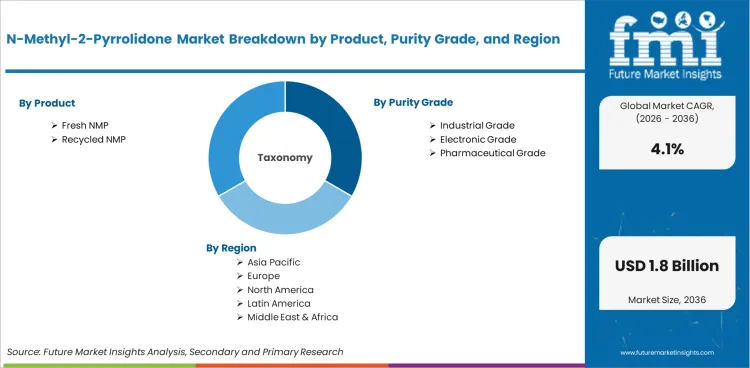
The market is segmented by product and purity grade. Application, end use and distribution channel complete the scope. Product segmentation includes fresh N-Methyl-2-Pyrrolidone and recycled N-Methyl-2-Pyrrolidone. Fresh N-Methyl-2-Pyrrolidone leads the product scope with wider use in electronics and battery processing. Purity grade covers electronic grade, pharmaceutical grade and industrial grade. Industrial grade leads due to broad use in petrochemical extraction and coatings. Application includes petrochemical processing, electronics and pharmaceuticals. Paints and coatings and agrochemicals complete the application scope. End use includes the chemical industry and electronics industry.
Insights into N-Methyl-2-Pyrrolidone Market by Product
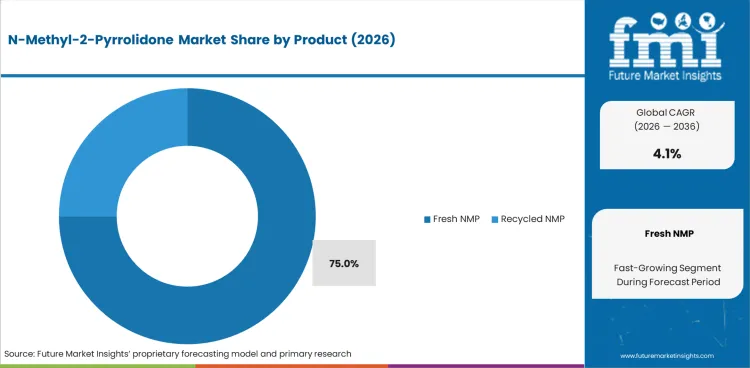
- Fresh NMP is expected to account for 75.0% share in 2026 since buyers in electronics and petrochemical units need stable quality lots.
- Recycled NMP gains use in solvent recovery systems as closed-loop processes lower disposal exposure and reduce replacement purchases.
Insights into N-Methyl-2-Pyrrolidone Market by Purity Grade
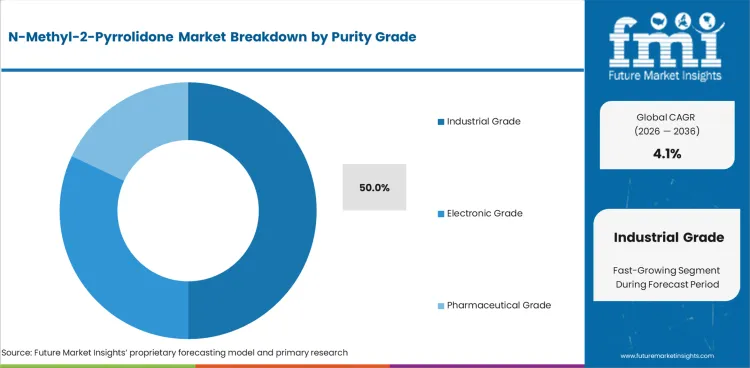
- Industrial grade is projected to hold 50.0% share in 2026 as bulk chemical processing and coatings can use standard purity ranges.
- Electronic grade carries higher qualification value since semiconductor cleaning needs low metal content and tighter residue control.
Insights into N-Methyl-2-Pyrrolidone Market by Application
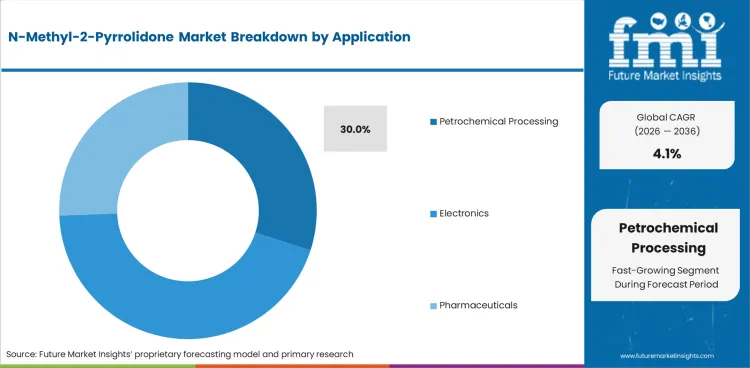
- Petrochemical processing is anticipated to capture 30.0% share in 2026 through butadiene recovery and aromatics extraction units.
- Electronics applications gain value as high-purity solvents are used in photoresist stripping and wafer cleaning routines.
Insights into N-Methyl-2-Pyrrolidone Market by End Use
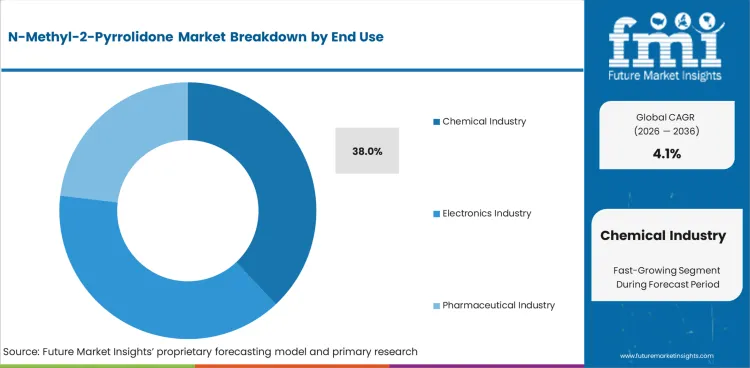
- Chemical industry use is forecast to represent 38.0% share in 2026, led by refineries and specialty chemical plants needing repeat supply.
- Electronics industry use rises as chip fabrication and battery manufacturing place stronger weight on traceability and impurity limits.
Insights into N-Methyl-2-Pyrrolidone Market by Distribution Channel
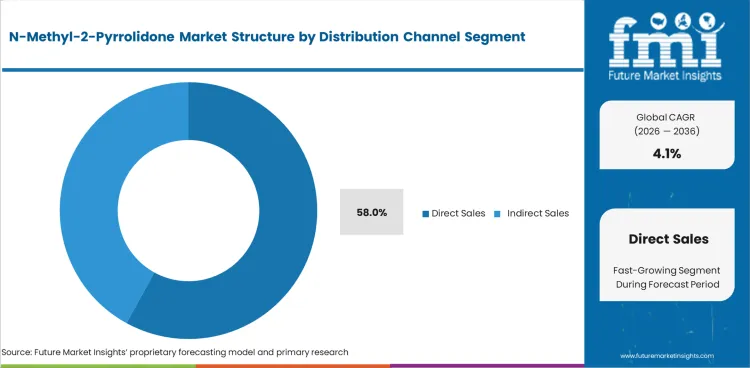
- Direct sales are expected to account for 58.0% share in 2026 due to industrial buyers preferring audited contracts and scheduled deliveries.
- Indirect sales support smaller customers through distributors and regional suppliers that handle mixed solvent portfolios.
N-Methyl-2-Pyrrolidone Market Drivers, Restraints, and Opportunities
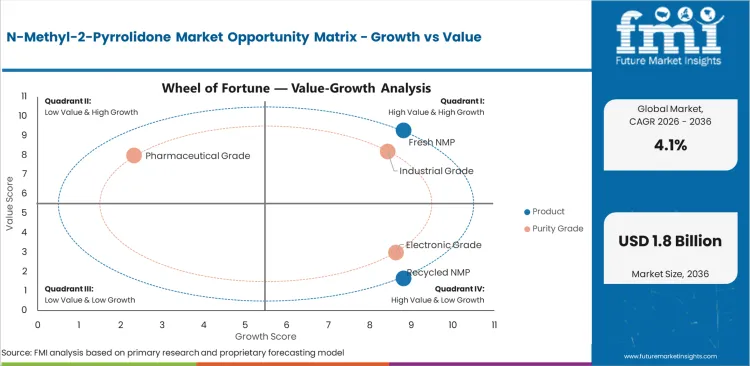
- High-purity solvent pull is expected to raise electronic grade orders due to semiconductor cleaning requiring tighter residue control.
- Worker exposure rules are expected to slow low-control uses as buyers review ventilation records and handling evidence.
- Recovered solvent systems create opportunity since regulated users seek lower waste exposure and steadier delivered cost during the forecast period.
Safety regulation is expected to become a restraint and supplier selection filter for the N-Methyl-2-Pyrrolidone market. The United States Environmental Protection Agency stated in June 2024 that NMP presents unreasonable risk to human health under the Toxic Substances Control Act. Regulatory pressure should move solvent buying toward closed handling and stronger worker protection records. Battery and electronics applications are expected to support higher-value demand as NMP remains widely used in cathode slurry preparation with polyvinylidene fluoride binders. Suppliers with high-purity grades, recovery support and safety documentation should gain preference in regulated accounts.
Regulatory Compliance and Solvent Recovery Analysis
Compliance is expected to reshape how buyers specify NMP during the forecast period. The United States Environmental Protection Agency proposed a June 2024 rule that would require worker protections for many NMP uses under the Toxic Substances Control Act. Buyer review is therefore moving toward exposure controls and use documentation before price negotiations begin. Recovered solvent offers a practical route for approved users, as reclamation can restore waste solvent for reuse in industrial processes. Suppliers that combine fresh NMP supply with recovery guidance should hold stronger buyer confidence in regulated accounts.
Recovered NMP and Closed-Loop Supply Outlook
Recovered NMP is drawing buyer attention as battery and electronics users try to reduce waste handling without weakening process quality. Battery recovery research published in 2025 notes that industrial NMP waste recovery can use distillation or membrane-based routes. These recovery routes support closed-loop solvent use, but energy cost and purity control remain buyer concerns. Suppliers with fresh and recovered grades can serve users that need tighter residue limits and stronger audit records. Solvent recovery should become a stronger buying factor for battery coating and electronics cleaning accounts.
Regional Analysis
.webp "Top Country Growth Comparison N Methyl 2 Pyrrolidone Market Cagr (2026 2036)")
| Country | CAGR 2026 to 2036 |
|---|---|
| United States | 2.6% |
| Canada | 2.1% |
| Germany | 2.0% |
| China | 5.2% |
| India | 7.0% |
| Japan | 3.4% |
| Brazil | 4.7% |
Source: Future Market Insights analysis, 2026.
Analysis of N-Methyl-2-Pyrrolidone Market by Key Countries
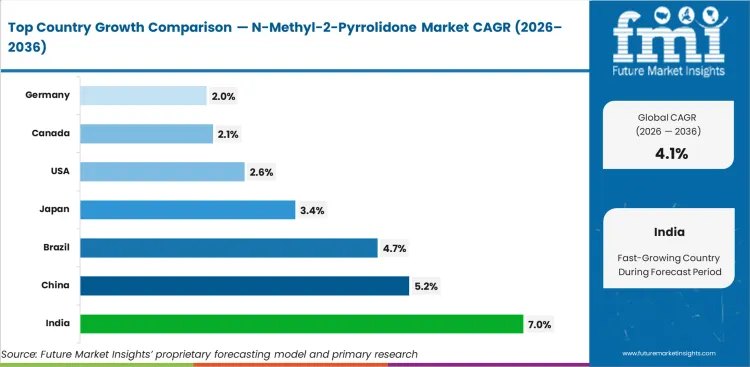
- India is projected to record 7.0% CAGR by 2036 with chemicals and electronics manufacturing lifting solvent qualification needs.
- China is expected to expand at 5.2% CAGR by 2036 as electronics and battery output support high-purity NMP use.
- Brazil is forecast to grow at 4.7% CAGR by 2036 due to agrochemical and coatings demand supporting industrial-grade purchases.
- Japan is expected to advance at 3.4% CAGR by 2036 with semiconductor material quality shaping premium solvent demand.
- United States at 2.6% CAGR reflects mature chemical use and stricter exposure controls. Canada at 2.1% CAGR and Germany at 2.0% CAGR by 2036, reflect slower industrial solvent growth.
Country performance differs by battery manufacturing, electronics demand, and petrochemical solvent use. India and China are expected to grow faster than the global pace as lithium-ion battery production and electronics processing raise higher-purity NMP consumption. Brazil is forecast above the global average as petrochemical processing and coatings use support steady solvent demand. Japan is expected to track closer to the global pace due to electronics-grade solvent needs and strict quality control. United States, Canada and Germany are forecast below the global pace but remain important due to regulatory scrutiny and mature chemical processing demand.
Demand Outlook for N-Methyl-2-Pyrrolidone Market in the United States
United States demand for the sector is projected to record 2.6% CAGR by 2036, driven by mature chemical processing sustaining a measured solvent replacement cycle. United States Census Bureau material from March 2026 said chemical manufacturing establishments rose from 13.6 thousand in 2017 to 15.0 thousand in 2022. This factory footprint supports repeat solvent use even as safety review slows casual handling. Buyers are expected to favor suppliers with exposure documentation and supply continuity.
- Petrochemical processing keeps a stable solvent outlet since NMP is used in extraction and separation steps.
- Electronics and battery users raise quality expectations for low residue and consistent water content.
- Regulated workplaces favor direct suppliers with safety support and clear product documentation.
Demand Outlook for N-Methyl-2-Pyrrolidone Market in Canada
NMP use in Canada is expected to expand at 2.1% CAGR by 2036, led by chemical output staying moderate and buyer review focuses on supply assurance. Statistics Canada reported fourth-quarter 2025 manufacturing sales of CAD 213.1 billion. Chemical product sales moved unevenly in 2025 which kept solvent orders tied to approved users. Contract supply is likely to remain important for refinery and specialty chemical customers.
- Petrochemical and industrial cleaning applications support repeat orders from large chemical users.
- Smaller buyers rely on distributors for mixed solvent needs and local inventory support.
- Recovered solvent programs reduce waste handling for plants with steady NMP circuits.
Sales Analysis of N-Methyl-2-Pyrrolidone Market in Germany
The sector in Germany is forecast at 2.0% CAGR by 2036 as chemical producers balance high input costs with strict solvent rules. Verband der Chemischen Industrie reported fourth-quarter 2025 chemical plant capacity utilization of 72.5%. Lower utilization tempers volume growth but does not remove demand for compliant grades. BASF SE has introduced reduced product carbon footprint variants for NMP from Ludwigshafen to support buyers tracking carbon data.
- Established chemical clusters use NMP in specialty processing and pharmaceutical solvent chains.
- Electronics and coatings users need strong supplier documentation under European chemical rules.
- Supplier differentiation is moving toward product carbon footprint records and controlled handling support.
Opportunity Analysis of N-Methyl-2-Pyrrolidone Market in China
Demand for the sector in China is expected to advance at 5.2% CAGR by 2036, as electronics and battery industries keep solvent use active. China released an action plan in September 2025 targeting around 7% average added-value growth for computer and electronic equipment manufacturing in 2025 to 2026. This policy direction influences demand for electronic grade NMP and solvent recovery. Domestic producers can benefit by meeting impurity controls and delivery scale.
- Battery manufacturing supports NMP use in cathode slurry systems and solvent recovery towers.
- Semiconductor cleaning raises demand for low-metal and low-residue grades from qualified suppliers.
- Local supply growth can reduce import reliance for high-volume industrial grade buyers.
Demand Outlook for N-Methyl-2-Pyrrolidone Market in India
Industry in India is projected to rise at 7.0% CAGR by 2036 due to chemicals and electronics manufacturing raising solvent buying. India's Department of Chemicals and Petrochemicals published its Annual Report 2024-25 in February 2025 for sector review. Domestic chemical output and planned petrochemical investment support a faster solvent outlook than mature Western markets. NMP suppliers with distribution reach and safety support are likely to serve both industrial and electronics accounts.
- Petrochemical expansion increases scope for extraction solvents and specialty processing aids.
- Electronics assembly and battery materials create a higher-value channel for controlled purity NMP.
- Distributors remain important for smaller formulation buyers outside major chemical clusters.
In-Depth Analysis of N-Methyl-2-Pyrrolidone Market in Japan
The sector in Japan is forecast at 3.4% CAGR by 2036 as semiconductor materials and specialty chemicals support selective NMP buying. Japan Electronics and Information Technology Industries Association reported July 2025 integrated circuit production of 255,469 million yen, anchoring demand for electronic cleaning materials with strict purity controls. Mature manufacturing limits volume speed but premium grades should maintain commercial importance.
- Chip and electronics suppliers focus on residue control and lot traceability in solvent selection.
- Pharmaceutical applications support smaller volumes with stronger documentation and grade assurance.
- Japanese users may test alternatives for lower-risk processes while retaining NMP in qualified uses.
Sales Analysis of N-Methyl-2-Pyrrolidone Market in Brazil
The market in Brazil is expected to post 4.7% CAGR by 2036 as agrochemicals and coatings support industrial-grade consumption. VCI's August 2025 Brazil country report showed chemical-sector import dependence. This environment favors distributors and regional suppliers that can manage landed cost. NMP demand is expected to expand faster than Canada and Germany due to agriculture-linked formulation needs.
- Agrochemical formulators use NMP as a solvent in pesticide and herbicide production routes.
- Paints and coatings users support standard grade buying for resin processing and surface coatings.
- Import dependence makes delivery reliability and local stocking important for industrial buyers.
Competitive Landscape and Strategic Positioning
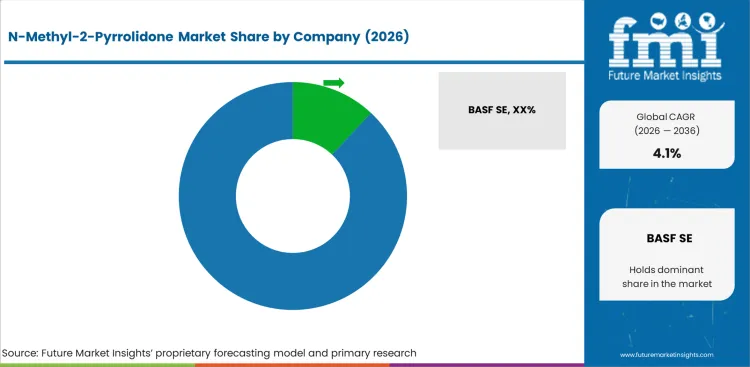
- Global producers compete on purity control and safety documentation, with feedstock access shaping cost stability.
- Premium-grade demand favors suppliers leading stronger documentation for pharmaceutical and electronics solvent use.
- Regional suppliers compete on cost and channel reach as industrial users accept standard and recovered grades.
Competition in the NMP market is centered on grade reliability and supply consistency for regulated industrial buyers. LyondellBasell states that it manufactures NMP from 1,4-butanediol made through a proprietary propylene oxide route. BASF SE sells N-Methylpyrrolidone as a polar solvent. The company introduced reduced product carbon footprint variants in March 2026. Ashland serves pharmaceutical users through Pharmasolve NMP with ISO 9001:2015 and EXCiPACT GMP certifications. Eastman Chemical Company supplies NMP for petrochemical processing and coatings applications.
Regional suppliers strengthen competition by serving industrial-grade demand through lower-cost supply and broad distribution reach. Chinese producers and distributors can expand into recycled solvent as some users accept reprocessed material for non-premium applications. Direct contracts favor global suppliers with stable grade control and clear safety records. Distributor supply fits coatings and agrochemical customers buying smaller volumes. Competitive advantage is expected to favor suppliers that can combine purity assurance with regulatory support and reliable logistics.
Key Companies in the N-Methyl-2-Pyrrolidone Market
Competition spans integrated global chemical producers and regional solvent suppliers. Pharmaceutical solvent specialists serve higher documentation accounts.
- Global producers: BASF SE and LyondellBasell Industries Holdings B.V. hold strong positions through integrated production and global customer reach. Eastman Chemical Company and Mitsubishi Chemical Corporation add solvent portfolios and application depth.
- Specialty suppliers: Ashland serves pharmaceutical NMP users with certified manufacturing and formulation support. Balaji Amines and Hefei TNJ Chemical Industry Co., Ltd. compete based on regional supply and specialty chemical channels.
- Regional suppliers: Shandong Qingyun Changxin Chemical Science-Tech Co., Ltd. and Zhejiang Realsun Chemical Co., Ltd. serve industrial customers. Puyang Guangming Chemicals Co., Ltd. and Abtonsmart Chemicals Group Co., Ltd. compete in distribution-led accounts.
Competitive Benchmarking: N-Methyl-2-Pyrrolidone Market
| Company | Purity Range | Recovery Support | Compliance Documentation | Geographic Footprint |
|---|---|---|---|---|
| BASF SE | High | Medium | High | Global |
| LyondellBasell Industries Holdings B.V. | High | Medium | High | Global |
| Ashland | High | Medium | High | North America and Europe |
| Eastman Chemical Company | Strong | Medium | Strong | Global |
| Mitsubishi Chemical Corporation | Strong | Medium | Strong | Asia and global |
| Hefei TNJ Chemical Industry Co., Ltd. | Medium | Medium | Medium | Asia |
| Zhejiang Realsun Chemical Co., Ltd. | Medium | Strong | Medium | Asia |
| Balaji Amines | Medium | Medium | Medium | India and export markets |
Source: Future Market Insights competitive analysis, 2026. Ratings reflect relative positioning based on purity range and compliance documentation. Recovery support and operating footprint complete the score view.
Key Developments in N-Methyl-2-Pyrrolidone Market
- In March 2025, Ashland increased global prices for 1,4-butanediol intermediates and solvents, specifically listing NMP at a minimum USD 0.40 per kg increase effective March 15, 2025.
- In September 2025, ChemPoint and Eastman announced a partnership for TamiSolve NxG solvents across North America.
- In March 2026, BASF SE introduced reduced product carbon footprint variants for BDO, THF, PolyTHF and NMP from Ludwigshafen.
Key Players in the N-Methyl-2-Pyrrolidone Market
Global Producers
- BASF SE
- LyondellBasell Industries Holdings B.V.
- Ashland
- Eastman Chemical Company
- Mitsubishi Chemical Corporation
Regional Producers
- Hefei TNJ Chemical Industry Co., Ltd.
- Shandong Qingyun Changxin Chemical Science-Tech Co., Ltd.
- Zhejiang Realsun Chemical Co., Ltd.
- Puyang Guangming Chemicals Co., Ltd.
- Balaji Amines
Specialty Suppliers
- Abtonsmart Chemicals Group Co., Ltd.
- Binzhou Yuneng Chemical Co., Ltd.
- Binzhou City Zhanhua District Ruian Chemical Co., Ltd.
- Hefei Tengchao Chemical Material Co., Ltd.
- Shanghai Poochun Industry Co., Ltd.
Report Scope and Coverage
| Item | Value |
|---|---|
| Market value in 2025 | USD 1.1 billion |
| Market value in 2026 | USD 1.2 billion |
| Market value in 2036 | USD 1.8 billion |
| CAGR from 2026 to 2036 | 4.1% CAGR |
| Quantitative units | USD billion |
| Market definition | NMP sold as fresh or recovered solvent for industrial and specialty applications |
| By product | Fresh NMP, recycled NMP |
| By purity grade | Electronic grade, pharmaceutical grade, industrial grade |
| By application | Petrochemical processing, electronics, paints and coatings, agrochemicals |
| By end use | Chemical industry, electronics industry, pharmaceutical industry, coatings and paint industry, agriculture industry |
| By distribution channel | Direct sales, indirect sales |
| Regions covered | North America, Latin America, Western Europe, Eastern Europe, East Asia, South Asia and Pacific, Middle East and Africa |
| Countries covered | United States, Canada, Germany, China, India, Japan, Brazil |
| Key companies profiled | BASF SE, LyondellBasell, Ashland, Eastman Chemical Company, Mitsubishi Chemical Corporation, Balaji Amines |
| Forecast period | 2026 to 2036 |
| Approach | Hybrid top-down and bottom-up method using solvent applications and buyer validation patterns |
Source: Future Market Insights, 2026.
N-Methyl-2-Pyrrolidone Market Breakdown by Product, Purity Grade, Application, End Use, Distribution Channel, and Region
N-Methyl-2-Pyrrolidone Market Segmented by Product
- Fresh N-Methyl-2-Pyrrolidone
- Recycled N-Methyl-2-Pyrrolidone
N-Methyl-2-Pyrrolidone Market Segmented by Purity Grade
- Electronic Grade
- Pharmaceutical Grade
- Industrial Grade
N-Methyl-2-Pyrrolidone Market Segmented by Application
- Petrochemical Processing
- Electronics
- Pharmaceuticals
- Paints and Coatings
- Agrochemicals
N-Methyl-2-Pyrrolidone Market Segmented by End Use
- Chemical Industry
- Electronics Industry
- Pharmaceutical Industry
- Coatings and Paints Industry
- Agriculture Industry
N-Methyl-2-Pyrrolidone Market Segmented by Distribution Channel
- Direct Sales
- Indirect Sales
N-Methyl-2-Pyrrolidone Market by Region
- North America
- United States
- Canada
- Latin America
- Brazil
- Rest of Latin America
- Western Europe
- Germany
- United Kingdom
- France
- Italy
- Spain
- BENELUX
- Nordic
- Rest of Western Europe
- Eastern Europe
- Poland
- Hungary
- Balkan and Baltic
- Rest of Eastern Europe
- East Asia
- China
- Japan
- South Korea
- South Asia and Pacific
- India
- ASEAN
- Australia and New Zealand
- Rest of South Asia and Pacific
- Middle East and Africa
- Kingdom of Saudi Arabia
- Other GCC Countries
- Turkiye
- South Africa
- Rest of Middle East and Africa
Research Sources and Bibliography
- Ashland Inc. (2025, March 3). Ashland increases prices for 1,4-butanediol intermediates and solvents product range globally.
- BASF SE. (2026, March 9). BASF introduces BDO, THF, PolyTHF® and NMP product variants with reduced product carbon footprint (rPCF).
- ChemPoint. (2025, September 24). Eastman's TamiSolve™ NxG solvents.
- Department of Chemicals and Petrochemicals. (2025, February 6). Annual report 2024-25.
- Federal Register. (2024, June 14). n-Methylpyrrolidone (NMP); regulation under the Toxic Substances Control Act (TSCA).
- International Energy Agency. (2025, May 14). Global EV Outlook 2025.
- Japan Electronics and Information Technology Industries Association. (2025, July). July 2025 production by the Japanese electronics industry.
- Semiconductor Industry Association. (2024, July 29). Comments of the Semiconductor Industry Association (SIA) to the Environmental Protection Agency (EPA) on the proposed rule on n-Methylpyrrolidone (NMP) regulation under the Toxic Substances Control Act (TSCA).
- Semiconductor Industry Association. (2026, February 6). Global annual semiconductor sales increase 25.6% to $791.7 billion in 2025.
- State Council of the People’s Republic of China. (2025, September 4). China unveils action plan to boost electronic information manufacturing growth.
- Statistics Canada. (2026, February 16). Monthly Survey of Manufacturing, December 2025.
- United States Census Bureau. (2026, March 5). USA chemical manufacturers grew despite overall manufacturing decline.
- Verband der Chemischen Industrie. (2026, March). Quarterly report 4.2025: The business situation of the German chemical and pharmaceutical industry.
- Ashland. (2026). Pharmasolve™ n-methyl-2-pyrrolidone.
- Eastman Chemical Company. (2019, March 14). N-Methyl-2-Pyrrolidone (NMP).
- LyondellBasell Industries. (2026). Amines & amides.
- Vaisala. (2025). NMP recovery in rechargeable battery manufacturing.
- Verband der Chemischen Industrie. (2025, August). Country report Brazil: Chemical and pharmaceutical industry data and facts.
Sources use public agency and official company publications.
This Report Answers
- What is the current and future value of the n-methyl-2-pyrrolidone market during 2026 to 2036?
- How fast is the n-methyl-2-pyrrolidone market expected to expand across the forecast period?
- Which product type is projected to hold a strong share in the n-methyl-2-pyrrolidone market in 2026?
- Which purity grade is expected to account for a strong share of solvent demand?
- Which applications are driving NMP use in petrochemical processing and electronics?
- How do exposure rules affect supplier selection for NMP buyers?
- Which countries are forecast to grow faster in n-methyl-2-pyrrolidone demand?
- Which companies are positioned strongly in purity control and global supply?
- What work is included or excluded in the n-methyl-2-pyrrolidone market definition?
- How does FMI size and forecast the n-methyl-2-pyrrolidone market using solvent and buyer evidence?
Frequently Asked Questions
What is the global market demand for n-methyl-2-pyrrolidone market in 2026?
In 2026, the n-methyl-2-pyrrolidone market is expected to cross USD 1.2 billion with demand tied to regulated solvent uses.
What is the forecast value of n-methyl-2-pyrrolidone market by 2036?
By 2036, the n-methyl-2-pyrrolidone industry is projected to reach USD 1.8 billion as electronics and petrochemical users continue buying.
What is the CAGR for N-Methyl-2-Pyrrolidone market from 2026 to 2036?
The n-methyl-2-pyrrolidone sector is expected to expand at 4.1% CAGR from 2026 to 2036 across solvent applications.
Which product type leads n-methyl-2-pyrrolidone market in 2026?
Fresh NMP is projected to account for 75.0% share in 2026 due to quality needs in critical processing.
Which distribution channel holds a strong share in n-methyl-2-pyrrolidone market?
Direct sales are expected to hold 58.0% share in 2026 as large users need contracted supply and documentation.
How is NMP used in battery production?
NMP is used as a process solvent in many cathode slurry systems. Recovery units often reclaim the solvent after coating work.
Why do some users compare NMP with safer alternatives?
Worker exposure rules and safety reviews push some users to test alternatives for lower-risk cleaning or coating applications.
How long does NMP qualification take for electronics buyers?
Electronics buyers often need supplier audits and lot testing before approval. Timing varies by facility and required purity level.
Preview the report firsthand - request a free sample
Get SampleGet the brochure for pricing and purchase details.
Get PDFTable of Content
- Executive Summary
- Global Market Outlook
- Demand-side Trends
- Supply-side Trends
- Technology Roadmap Analysis
- Analysis and Recommendations
- Market Overview
- Market Coverage / Taxonomy
- Market Definition / Scope / Limitations
- Research Methodology
- Chapter Orientation
- Analytical Lens and Working Hypotheses
- Market Structure, Signals, and Trend Drivers
- Benchmarking and Cross-market Comparability
- Market Sizing, Forecasting, and Opportunity Mapping
- Research Design and Evidence Framework
- Desk Research Programme (Secondary Evidence)
- Company Annual and Sustainability Reports
- Peer-reviewed Journals and Academic Literature
- Corporate Websites, Product Literature, and Technical Notes
- Earnings Decks and Investor Briefings
- Statutory Filings and Regulatory Disclosures
- Technical White Papers and Standards Notes
- Trade Journals, Industry Magazines, and Analyst Briefs
- Conference Proceedings, Webinars, and Seminar Materials
- Government Statistics Portals and Public Data Releases
- Press Releases and Reputable Media Coverage
- Specialist Newsletters and Curated Briefings
- Sector Databases and Reference Repositories
- FMI Internal Proprietary Databases and Historical Market Datasets
- Subscription Datasets and Paid Sources
- Social Channels, Communities, and Digital Listening Inputs
- Additional Desk Sources
- Expert Input and Fieldwork (Primary Evidence)
- Primary Modes
- Qualitative Interviews and Expert Elicitation
- Quantitative Surveys and Structured Data Capture
- Blended Approach
- Why Primary Evidence is Used
- Field Techniques
- Interviews
- Surveys
- Focus Groups
- Observational and In-context Research
- Social and Community Interactions
- Stakeholder Universe Engaged
- C-suite Leaders
- Board Members
- Presidents and Vice Presidents
- R&D and Innovation Heads
- Technical Specialists
- Domain Subject-matter Experts
- Scientists
- Physicians and Other Healthcare Professionals
- Governance, Ethics, and Data Stewardship
- Research Ethics
- Data Integrity and Handling
- Primary Modes
- Tooling, Models, and Reference Databases
- Desk Research Programme (Secondary Evidence)
- Data Engineering and Model Build
- Data Acquisition and Ingestion
- Cleaning, Normalisation, and Verification
- Synthesis, Triangulation, and Analysis
- Quality Assurance and Audit Trail
- Market Background
- Market Dynamics
- Drivers
- Restraints
- Opportunity
- Trends
- Scenario Forecast
- Demand in Optimistic Scenario
- Demand in Likely Scenario
- Demand in Conservative Scenario
- Opportunity Map Analysis
- Product Life Cycle Analysis
- Supply Chain Analysis
- Investment Feasibility Matrix
- Value Chain Analysis
- PESTLE and Porter’s Analysis
- Regulatory Landscape
- Regional Parent Market Outlook
- Production and Consumption Statistics
- Import and Export Statistics
- Market Dynamics
- Global Market Analysis 2021 to 2025 and Forecast, 2026 to 2036
- Historical Market Size Value (USD Million) Analysis, 2021 to 2025
- Current and Future Market Size Value (USD Million) Projections, 2026 to 2036
- Y-o-Y Growth Trend Analysis
- Absolute $ Opportunity Analysis
- Global Market Pricing Analysis 2021 to 2025 and Forecast 2026 to 2036
- Global Market Analysis 2021 to 2025 and Forecast 2026 to 2036, By Product
- Introduction / Key Findings
- Historical Market Size Value (USD Million) Analysis By Product , 2021 to 2025
- Current and Future Market Size Value (USD Million) Analysis and Forecast By Product , 2026 to 2036
- Fresh NMP
- Recycled NMP
- Fresh NMP
- Y-o-Y Growth Trend Analysis By Product , 2021 to 2025
- Absolute $ Opportunity Analysis By Product , 2026 to 2036
- Global Market Analysis 2021 to 2025 and Forecast 2026 to 2036, By Purity Grade
- Introduction / Key Findings
- Historical Market Size Value (USD Million) Analysis By Purity Grade, 2021 to 2025
- Current and Future Market Size Value (USD Million) Analysis and Forecast By Purity Grade, 2026 to 2036
- Industrial Grade
- Electronic Grade
- Pharmaceutical Grade
- Industrial Grade
- Y-o-Y Growth Trend Analysis By Purity Grade, 2021 to 2025
- Absolute $ Opportunity Analysis By Purity Grade, 2026 to 2036
- Global Market Analysis 2021 to 2025 and Forecast 2026 to 2036, By Application
- Introduction / Key Findings
- Historical Market Size Value (USD Million) Analysis By Application, 2021 to 2025
- Current and Future Market Size Value (USD Million) Analysis and Forecast By Application, 2026 to 2036
- Petrochemical Processing
- Electronics
- Pharmaceuticals
- Petrochemical Processing
- Y-o-Y Growth Trend Analysis By Application, 2021 to 2025
- Absolute $ Opportunity Analysis By Application, 2026 to 2036
- Global Market Analysis 2021 to 2025 and Forecast 2026 to 2036, By End Use
- Introduction / Key Findings
- Historical Market Size Value (USD Million) Analysis By End Use, 2021 to 2025
- Current and Future Market Size Value (USD Million) Analysis and Forecast By End Use, 2026 to 2036
- Chemical Industry
- Electronics Industry
- Pharmaceutical Industry
- Chemical Industry
- Y-o-Y Growth Trend Analysis By End Use, 2021 to 2025
- Absolute $ Opportunity Analysis By End Use, 2026 to 2036
- Global Market Analysis 2021 to 2025 and Forecast 2026 to 2036, By Distribution Channel
- Introduction / Key Findings
- Historical Market Size Value (USD Million) Analysis By Distribution Channel, 2021 to 2025
- Current and Future Market Size Value (USD Million) Analysis and Forecast By Distribution Channel, 2026 to 2036
- Direct Sales
- Indirect Sales
- Direct Sales
- Y-o-Y Growth Trend Analysis By Distribution Channel, 2021 to 2025
- Absolute $ Opportunity Analysis By Distribution Channel, 2026 to 2036
- Global Market Analysis 2021 to 2025 and Forecast 2026 to 2036, By Region
- Introduction
- Historical Market Size Value (USD Million) Analysis By Region, 2021 to 2025
- Current Market Size Value (USD Million) Analysis and Forecast By Region, 2026 to 2036
- North America
- Latin America
- Western Europe
- Eastern Europe
- East Asia
- South Asia and Pacific
- Middle East & Africa
- Market Attractiveness Analysis By Region
- North America Market Analysis 2021 to 2025 and Forecast 2026 to 2036, By Country
- Historical Market Size Value (USD Million) Trend Analysis By Market Taxonomy, 2021 to 2025
- Market Size Value (USD Million) Forecast By Market Taxonomy, 2026 to 2036
- By Country
- USA
- Canada
- Mexico
- By Product
- By Purity Grade
- By Application
- By End Use
- By Distribution Channel
- By Country
- Market Attractiveness Analysis
- By Country
- By Product
- By Purity Grade
- By Application
- By End Use
- By Distribution Channel
- Key Takeaways
- Latin America Market Analysis 2021 to 2025 and Forecast 2026 to 2036, By Country
- Historical Market Size Value (USD Million) Trend Analysis By Market Taxonomy, 2021 to 2025
- Market Size Value (USD Million) Forecast By Market Taxonomy, 2026 to 2036
- By Country
- Brazil
- Chile
- Rest of Latin America
- By Product
- By Purity Grade
- By Application
- By End Use
- By Distribution Channel
- By Country
- Market Attractiveness Analysis
- By Country
- By Product
- By Purity Grade
- By Application
- By End Use
- By Distribution Channel
- Key Takeaways
- Western Europe Market Analysis 2021 to 2025 and Forecast 2026 to 2036, By Country
- Historical Market Size Value (USD Million) Trend Analysis By Market Taxonomy, 2021 to 2025
- Market Size Value (USD Million) Forecast By Market Taxonomy, 2026 to 2036
- By Country
- Germany
- UK
- Italy
- Spain
- France
- Nordic
- BENELUX
- Rest of Western Europe
- By Product
- By Purity Grade
- By Application
- By End Use
- By Distribution Channel
- By Country
- Market Attractiveness Analysis
- By Country
- By Product
- By Purity Grade
- By Application
- By End Use
- By Distribution Channel
- Key Takeaways
- Eastern Europe Market Analysis 2021 to 2025 and Forecast 2026 to 2036, By Country
- Historical Market Size Value (USD Million) Trend Analysis By Market Taxonomy, 2021 to 2025
- Market Size Value (USD Million) Forecast By Market Taxonomy, 2026 to 2036
- By Country
- Russia
- Poland
- Hungary
- Balkan & Baltic
- Rest of Eastern Europe
- By Product
- By Purity Grade
- By Application
- By End Use
- By Distribution Channel
- By Country
- Market Attractiveness Analysis
- By Country
- By Product
- By Purity Grade
- By Application
- By End Use
- By Distribution Channel
- Key Takeaways
- East Asia Market Analysis 2021 to 2025 and Forecast 2026 to 2036, By Country
- Historical Market Size Value (USD Million) Trend Analysis By Market Taxonomy, 2021 to 2025
- Market Size Value (USD Million) Forecast By Market Taxonomy, 2026 to 2036
- By Country
- China
- Japan
- South Korea
- By Product
- By Purity Grade
- By Application
- By End Use
- By Distribution Channel
- By Country
- Market Attractiveness Analysis
- By Country
- By Product
- By Purity Grade
- By Application
- By End Use
- By Distribution Channel
- Key Takeaways
- South Asia and Pacific Market Analysis 2021 to 2025 and Forecast 2026 to 2036, By Country
- Historical Market Size Value (USD Million) Trend Analysis By Market Taxonomy, 2021 to 2025
- Market Size Value (USD Million) Forecast By Market Taxonomy, 2026 to 2036
- By Country
- India
- ASEAN
- Australia & New Zealand
- Rest of South Asia and Pacific
- By Product
- By Purity Grade
- By Application
- By End Use
- By Distribution Channel
- By Country
- Market Attractiveness Analysis
- By Country
- By Product
- By Purity Grade
- By Application
- By End Use
- By Distribution Channel
- Key Takeaways
- Middle East & Africa Market Analysis 2021 to 2025 and Forecast 2026 to 2036, By Country
- Historical Market Size Value (USD Million) Trend Analysis By Market Taxonomy, 2021 to 2025
- Market Size Value (USD Million) Forecast By Market Taxonomy, 2026 to 2036
- By Country
- Kingdom of Saudi Arabia
- Other GCC Countries
- Turkiye
- South Africa
- Other African Union
- Rest of Middle East & Africa
- By Product
- By Purity Grade
- By Application
- By End Use
- By Distribution Channel
- By Country
- Market Attractiveness Analysis
- By Country
- By Product
- By Purity Grade
- By Application
- By End Use
- By Distribution Channel
- Key Takeaways
- Key Countries Market Analysis
- USA
- Pricing Analysis
- Market Share Analysis, 2025
- By Product
- By Purity Grade
- By Application
- By End Use
- By Distribution Channel
- Canada
- Pricing Analysis
- Market Share Analysis, 2025
- By Product
- By Purity Grade
- By Application
- By End Use
- By Distribution Channel
- Mexico
- Pricing Analysis
- Market Share Analysis, 2025
- By Product
- By Purity Grade
- By Application
- By End Use
- By Distribution Channel
- Brazil
- Pricing Analysis
- Market Share Analysis, 2025
- By Product
- By Purity Grade
- By Application
- By End Use
- By Distribution Channel
- Chile
- Pricing Analysis
- Market Share Analysis, 2025
- By Product
- By Purity Grade
- By Application
- By End Use
- By Distribution Channel
- Germany
- Pricing Analysis
- Market Share Analysis, 2025
- By Product
- By Purity Grade
- By Application
- By End Use
- By Distribution Channel
- UK
- Pricing Analysis
- Market Share Analysis, 2025
- By Product
- By Purity Grade
- By Application
- By End Use
- By Distribution Channel
- Italy
- Pricing Analysis
- Market Share Analysis, 2025
- By Product
- By Purity Grade
- By Application
- By End Use
- By Distribution Channel
- Spain
- Pricing Analysis
- Market Share Analysis, 2025
- By Product
- By Purity Grade
- By Application
- By End Use
- By Distribution Channel
- France
- Pricing Analysis
- Market Share Analysis, 2025
- By Product
- By Purity Grade
- By Application
- By End Use
- By Distribution Channel
- India
- Pricing Analysis
- Market Share Analysis, 2025
- By Product
- By Purity Grade
- By Application
- By End Use
- By Distribution Channel
- ASEAN
- Pricing Analysis
- Market Share Analysis, 2025
- By Product
- By Purity Grade
- By Application
- By End Use
- By Distribution Channel
- Australia & New Zealand
- Pricing Analysis
- Market Share Analysis, 2025
- By Product
- By Purity Grade
- By Application
- By End Use
- By Distribution Channel
- China
- Pricing Analysis
- Market Share Analysis, 2025
- By Product
- By Purity Grade
- By Application
- By End Use
- By Distribution Channel
- Japan
- Pricing Analysis
- Market Share Analysis, 2025
- By Product
- By Purity Grade
- By Application
- By End Use
- By Distribution Channel
- South Korea
- Pricing Analysis
- Market Share Analysis, 2025
- By Product
- By Purity Grade
- By Application
- By End Use
- By Distribution Channel
- Russia
- Pricing Analysis
- Market Share Analysis, 2025
- By Product
- By Purity Grade
- By Application
- By End Use
- By Distribution Channel
- Poland
- Pricing Analysis
- Market Share Analysis, 2025
- By Product
- By Purity Grade
- By Application
- By End Use
- By Distribution Channel
- Hungary
- Pricing Analysis
- Market Share Analysis, 2025
- By Product
- By Purity Grade
- By Application
- By End Use
- By Distribution Channel
- Kingdom of Saudi Arabia
- Pricing Analysis
- Market Share Analysis, 2025
- By Product
- By Purity Grade
- By Application
- By End Use
- By Distribution Channel
- Turkiye
- Pricing Analysis
- Market Share Analysis, 2025
- By Product
- By Purity Grade
- By Application
- By End Use
- By Distribution Channel
- South Africa
- Pricing Analysis
- Market Share Analysis, 2025
- By Product
- By Purity Grade
- By Application
- By End Use
- By Distribution Channel
- USA
- Market Structure Analysis
- Competition Dashboard
- Competition Benchmarking
- Market Share Analysis of Top Players
- By Regional
- By Product
- By Purity Grade
- By Application
- By End Use
- By Distribution Channel
- Competition Analysis
- Competition Deep Dive
- BASF SE
- Overview
- Product Portfolio
- Profitability by Market Segments (Product/Age /Sales Channel/Region)
- Sales Footprint
- Strategy Overview
- Marketing Strategy
- Product Strategy
- Channel Strategy
- LyondellBasell Industries Holdings B.V.
- Ashland
- Eastman Chemical Company
- Mitsubishi Chemical Corporation
- BASF SE
- Competition Deep Dive
- Assumptions & Acronyms Used


