Reports

- Global Locations -

Headquarters

Future Market Insights, Inc.

Christiana Corporate, 200
Continental Drive, Suite 401,
Newark, Delaware - 19713,
United States

T: +1-845-579-5705

Americas

Future Market Insights, Inc.

616 Corporate Way, Suite 2-9018,
Valley Cottage, NY 10989, United States

T: +1-347-918-3531

MEA

Future Market Insights

1602-6 Jumeirah Bay X2 Tower, Plot No: JLT-PH2-X2A,
Jumeirah Lakes Towers, Dubai,
United Arab Emirates

Europe

Future Market Insights

3rd Floor, 207 Regent Street,
W1B 3HH London
United Kingdom

T: + 44 (0) 20 8123 9659
D: +44 (0) 20 3287 4268

Asia Pacific

Future Market Insights

IndiaLand Global Tech Park, Unit UG-1, Behind Grand HighStreet, Phase 1, Hinjawadi, MH, Pune – 411057, India

Glyceryl Caprylate Market Outlook (2022 to 2032)

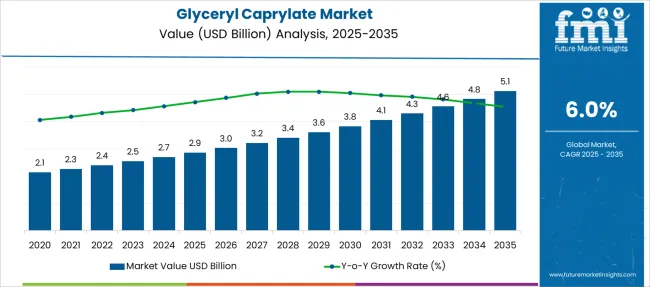
The glyceryl caprylate market is anticipated to secure a CAGR of 6% during the forecast period.

Sales of glyceryl caprylate are expected to rise due to a sudden increase in the cosmetics and personal care industry. In addition to this, the demand for glyceryl caprylate is rising on account of improved public awareness of the importance of personal hygiene.

Attributes Details
Glyceryl Caprylate Market CAGR (2022 to 2032) 6%
Glyceryl Caprylate Market Value (2022 to 2032) US$ 2.4 billion

The report sheds light on the factors improving the sales of glyceryl caprylate and, in turn, the opportunities for the market players. However, the glyceryl caprylate market also faces some challenges, which might limit the glyceryl caprylate market share from reaching its potential.

Some of the key glyceryl caprylate market trends promoting the demand for glyceryl caprylate include the changing retail market outlook owing to the surge in e-commerce.

With the strong presence of many domestic and international cosmetic product manufacturing businesses, the global market for glyceryl caprylate is expected to increase. An additional factor driving the growth of the glyceryl caprylate market is the rising demand for organic cosmetics and personal hygiene products.

Don't pay for what you don't need

Customize your report by selecting specific countries or regions and save 30%!

What are the Key Growth Propellers to the Glyceryl Caprylate Market Share

The growing cosmetics and personal care industry and awareness among the population for personal hygiene are driving the sales of glyceryl caprylate globally. Glyceryl caprylate is a co-emulsifier primarily used for stabilizing oil-in-water emulsions. It is derived from various vegetable oils. Palm oil and coconut oil are commonly used resources for obtaining glyceryl caprylate. The fundamental concept of using glyceryl caprylate in cosmetics is its properties that enhance human skin features, such as regulating skin moisture, maintaining skin oils, and humidifying the skin. Glyceryl caprylate also acts as a solubilizer for synthetic materials and a viscous modifier for flavors and fragrances.

There is a trend for multi-functional end products offering several benefits in one product. This trend has propelled the glyceryl caprylate market as it not only enhances the anti-microbial effect but also provides the necessary conditioning. Glyceryl caprylate replaces many conventional thickeners and conditioners such as PQ7, guar gum, Q10, and PEG thickeners.

The compatibility of glyceryl caprylate with organic ingredients enhances the market growth as demand for natural products is increasing steadily. The market for glyceryl caprylate is estimated to grow globally with the strong presence of many domestic and international cosmetic product manufacturing brands. The increased demand for organic cosmetic and personal hygiene products is an add-on factor fueling the growth of sales of glyceryl caprylate.

In the current century, people are more aware of their looks and appearances. And the global population has an immense interest in gaining knowledge about the ingredients in the products and their effect on their skin. The functions of glyceryl caprylate, such as a surfactant and skin conditioning agent, drive the demand from the market following the factors mentioned above.

Other significant factors propelling the sales of glyceryl caprylate are a surge in the cosmetics and personal care industry and the development of new cosmetics, personal care, and fragrance products. Moreover, increased awareness among the population for personal care, urbanization, changing the retailing sector, and e-commerce are some of the factors fueling the demand for glyceryl caprylate.

Developing countries are forecasted to be the most promising regions in terms of lucrative opportunities as a result of rapid urbanization, rising disposable income of the population, and growing population. The glyceryl caprylate market is expected to have a significant impact on developing countries in terms of high revenue generation, with the sales of glyceryl caprylate rising constantly.

Glyceryl caprylate has a natural origin and is safe for baby care products also, thus, creating new opportunities. The market players are now developing products for the baby care range with glyceryl caprylate as one of the ingredients, which is expected to improve the demand for glyceryl caprylate.
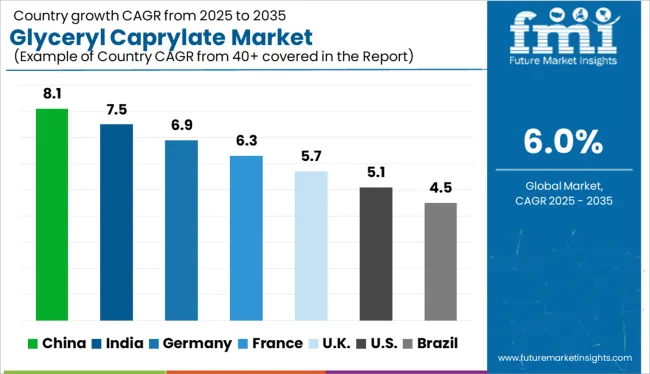
Which Region holds the Highest Growth Potential in the Glyceryl Caprylate Market

North America, Japan, and Europe are the mature glyceryl caprylate markets and have a prominent market share for products containing glyceryl caprylate. As Europe has a more aging population, more anti-aging skin products are being sold with a high demand for glyceryl caprylate. Thus, the sales of glyceryl caprylate are also significantly higher in the region.

Although Japan is experiencing a similar scenario as Europe, China has more youth population. The demand for glyceryl caprylate in East Asia is estimated to be high in a specific country while slowing in another country. Also, North America has a growing aged population. Thus, the glyceryl caprylate market is eventually growing in the region.

The South Asia market for glyceryl caprylate is forecasted to be the most emerging market and a trendsetter for new products. The Middle East and Africa (MEA) are anticipated to propel the sales of glyceryl caprylate with the development of products containing the glyceryl caprylate market. The glyceryl caprylate market in Latin America is estimated to exhibit exceptional growth with increased awareness among the population for personal care.
Sudip Saha
Sudip Saha

Principal Consultant

Talk to Analyst

Find your sweet spots for generating winning opportunities in this market.

How is the Competitive Landscape in the Glyceryl Caprylate Market

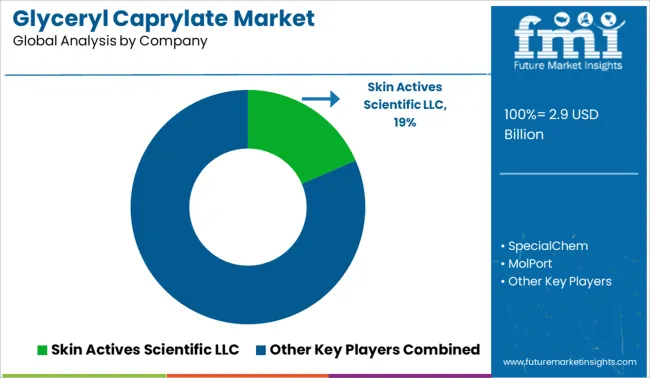
Some of the major players in the Glyceryl Caprylate market are SkinChakra, Parchem Fine & specialty chemicals, Stepan Company, ABITEC, BOC Sciences, Kao Corporation, Kingyoung Bio Technical Co., Ltd., Tokyo Chemical Industry Co., Ltd. (TCI), INOLEX Inc., Subhash Chemical Industries Pvt Ltd., Universal Preserv-A-Chem Inc. [UPI], SpecialChem, Evonik Industries, and among others.

These key market players are estimated to enhance the sales of glyceryl caprylate with innovative product formulations and new product launches. This would be beneficial to cater to the growing demand for glyceryl caprylate.

The report consists of key players contributing to the glyceryl caprylate market share. It also consists of organic and inorganic growth strategies adopted by market players to improve their market positions. This exclusive report analyzes the competitive landscape and glyceryl caprylate market share acquired by players to strengthen their market position.

Report Scope

Report Attribute Details
The base year for estimation 2021
Historical data 2015 to 2020
Forecast period 2022 to 2032
Quantitative units Revenue in USD Million, volume in kilotons, and CAGR from 2022 to 2032
Report Coverage Revenue forecast, volume forecast, company ranking, competitive landscape, growth factors, and trends, Pricing Analysis
Segments Covered Application, end-use, form, source, sales channel, region
Regional scope North America; Western Europe, Eastern Europe, Middle East, Africa, ASEAN, South Asia, Rest of Asia, Australia, and New Zealand
Country scope USA; Canada; Mexico; Germany; United Kingdom; France; Italy; Spain; Russia; Belgium; Poland; Czech Republic; China; India; Japan; Australia; Brazil; Argentina; Colombia; Saudi Arabia; United Arab Emirates(UAE); Iran; South Africa
Key companies profiled SkinChakra, Parchem fine & specialty chemicals, Stepan Company, ABITEC, BOC Sciences, Kao Corporation, Kingyoung Bio Technical Co., Ltd., Tokyo Chemical Industry Co., Ltd. (TCI), INOLEX Inc., Subhash Chemical Industries Pvt Ltd., Universal Preserv-A-Chem Inc. [UPI], SpecialChem, Evonik Industries
Customization scope Free report customization (equivalent to up to 8 analysts' working days) with purchase. Addition or alteration to country, regional & segment scope.
Pricing and purchase options Avail customized purchase options to meet your exact research needs.

Get the data you need at a Fraction of the cost

Personalize your report by choosing insights you need
and save 40%!

Key Segments

By Application:

  • Creams
  • Lotions
  • Deodorants
  • Powders
  • Gels
  • Other applications

By End Use:

  • Flavor
  • Cosmetics
  • Pharmaceutical
  • Textiles
  • Fragrances

By Form:

  • Liquid
  • Semi-solid

By Source:

  • Palm oil
  • Coconut oil
  • Other sources

By Sales Channel:

  • Direct
  • Indirect
  • Independent Stores
  • Hypermarket/Supermarket
  • Specialty Stores
  • E-commerce
  • Others

By Region:

  • North America
  • Latin America
  • Asia Pacific
  • Middle East and Africa(MEA)
  • Europe

Frequently Asked Questions

What is the growth outlook for the Glyceryl Caprylate Market?

The glyceryl caprylate market is expected to register a CAGR of 6% from 2022 to 2032.

Which Sector is the Key Driver in the Glyceryl Caprylate Market?

The cosmetic product sector is a key driver in the glyceryl caprylate market.

Which Region Leads the Glyceryl Caprylate Market?

The North American region is anticipated to dominate the glyceryl caprylate market during the forecast period.

How much Growth Potential does the Glyceryl Caprylate Market hold?

The glyceryl caprylate market is likely to hold a valuation of US$ 4.30 billion by 2032.

What is the current valuation of the Glyceryl Caprylate Market?

The current valuation of the glyceryl caprylate market in 2022 is US$ 2.4 billion.

Table of Content

1. Executive Summary | Glyceryl Caprylate Market

    1.1. Global Market Outlook

    1.2. Demand-side Trends

    1.3. Supply-side Trends

    1.4. Technology Roadmap Analysis

    1.5. Analysis and Recommendations

2. Market Overview

    2.1. Market Coverage / Taxonomy

    2.2. Market Definition / Scope / Limitations

3. Market Background

    3.1. Market Dynamics

        3.1.1. Drivers

        3.1.2. Restraints

        3.1.3. Opportunity

        3.1.4. Trends

    3.2. Scenario Forecast

        3.2.1. Demand in Optimistic Scenario

        3.2.2. Demand in Likely Scenario

        3.2.3. Demand in Conservative Scenario

    3.3. Opportunity Map Analysis

    3.4. Investment Feasibility Matrix

    3.5. PESTLE and Porter’s Analysis

    3.6. Regulatory Landscape

        3.6.1. By Key Regions

        3.6.2. By Key Countries

4. Global Market Analysis 2017 to 2021 and Forecast, 2022 to 2032

    4.1. Historical Market Size Value (US$ Million) & Volume(Units) Analysis, 2017 to 2021

    4.2. Current and Future Market Size Value (US$ Million) & Volume(Units) Projections, 2022 to 2032

        4.2.1. Y-o-Y Growth Trend Analysis

        4.2.2. Absolute $ Opportunity Analysis

5. Global Market Analysis 2017 to 2021 and Forecast 2022 to 2032, By Application

    5.1. Introduction / Key Findings

    5.2. Historical Market Size Value (US$ Million) & Volume(Units) Analysis By Application, 2017 to 2021

    5.3. Current and Future Market Size Value (US$ Million) & Volume(Units) Analysis and Forecast By Application, 2022 to 2032

        5.3.1. Creams

        5.3.2. Hair care

            5.3.2.1. Lotions

        5.3.3. Deodorants

        5.3.4. Powder

        5.3.5. Gels

        5.3.6. Others

    5.4. Y-o-Y Growth Trend Analysis By Application, 2017 to 2021

    5.5. Absolute $ Opportunity Analysis By Application, 2022 to 2032

6. Global Market Analysis 2017 to 2021 and Forecast 2022 to 2032, By End Use

    6.1. Introduction / Key Findings

    6.2. Historical Market Size Value (US$ Million) & Volume(Units) Analysis By End Use, 2017 to 2021

    6.3. Current and Future Market Size Value (US$ Million) & Volume(Units) Analysis and Forecast By End Use, 2022 to 2032

        6.3.1. Flavor

        6.3.2. Cosmetics

        6.3.3. Pharmaceutical

        6.3.4. Textiles

        6.3.5. Fragrances

    6.4. Y-o-Y Growth Trend Analysis By End Use, 2017 to 2021

    6.5. Absolute $ Opportunity Analysis By End Use, 2022 to 2032

7. Global Market Analysis 2017 to 2021 and Forecast 2022 to 2032, By Form

    7.1. Introduction / Key Findings

    7.2. Historical Market Size Value (US$ Million) & Volume(Units) Analysis By Form, 2017 to 2021

    7.3. Current and Future Market Size Value (US$ Million) & Volume(Units) Analysis and Forecast By Form, 2022 to 2032

        7.3.1. Liquid

        7.3.2. Semi-Liquid

    7.4. Y-o-Y Growth Trend Analysis By Form, 2017 to 2021

    7.5. Absolute $ Opportunity Analysis By Form, 2022 to 2032

8. Global Market Analysis 2017 to 2021 and Forecast 2022 to 2032, By Sorce

    8.1. Introduction / Key Findings

    8.2. Historical Market Size Value (US$ Million) & Volume(Units) Analysis By Sorce, 2017 to 2021

    8.3. Current and Future Market Size Value (US$ Million) & Volume(Units) Analysis and Forecast By Sorce, 2022 to 2032

        8.3.1. Palm Oil

        8.3.2. Coconut Oil

        8.3.3. Others

    8.4. Y-o-Y Growth Trend Analysis By Sorce, 2017 to 2021

    8.5. Absolute $ Opportunity Analysis By Sorce, 2022 to 2032

9. Global Market Analysis 2017 to 2021 and Forecast 2022 to 2032, By Sales Channel 

    9.1. Introduction / Key Findings

    9.2. Historical Market Size Value (US$ Million) & Volume(Units) Analysis By Sales Channel , 2017 to 2021

    9.3. Current and Future Market Size Value (US$ Million) & Volume(Units) Analysis and Forecast By Sales Channel , 2022 to 2032

        9.3.1. Direct

        9.3.2. Indirect

    9.4. Y-o-Y Growth Trend Analysis By Sales Channel, 2017 to 2021

    9.5. Absolute $ Opportunity Analysis By Sales Channel, 2022 to 2032

10. Global Market Analysis 2017 to 2021 and Forecast 2022 to 2032, By Region

    10.1. Introduction

    10.2. Historical Market Size Value (US$ Million) & Volume(Units) Analysis By Region, 2017 to 2021

    10.3. Current Market Size Value (US$ Million) & Volume(Units) Analysis and Forecast By Region, 2022 to 2032

        10.3.1. North America

        10.3.2. Latin America

        10.3.3. Europe

        10.3.4. East Asia

        10.3.5. South Asia

        10.3.6. Oceania

        10.3.7. Middle East and Africa

    10.4. Market Attractiveness Analysis By Region

11. North America Market Analysis 2017 to 2021 and Forecast 2022 to 2032, By Country

    11.1. Historical Market Size Value (US$ Million) & Volume(Units) Trend Analysis By Market Taxonomy, 2017 to 2021

    11.2. Market Size Value (US$ Million) & Volume(Units) Forecast By Market Taxonomy, 2022 to 2032

        11.2.1. By Country

            11.2.1.1. USA

            11.2.1.2. Canada

        11.2.2. By Application

        11.2.3. By End Use

        11.2.4. By Form

        11.2.5. By Sorce

        11.2.6. By Sales Channel

    11.3. Market Attractiveness Analysis

        11.3.1. By Country

        11.3.2. By Application

        11.3.3. By End Use

        11.3.4. By Form

        11.3.5. By Sorce

        11.3.6. By Sales Channel

    11.4. Key Takeaways

12. Latin America Market Analysis 2017 to 2021 and Forecast 2022 to 2032, By Country

    12.1. Historical Market Size Value (US$ Million) & Volume(Units) Trend Analysis By Market Taxonomy, 2017 to 2021

    12.2. Market Size Value (US$ Million) & Volume(Units) Forecast By Market Taxonomy, 2022 to 2032

        12.2.1. By Country

            12.2.1.1. Brazil

            12.2.1.2. Mexico

            12.2.1.3. Rest of Latin America

        12.2.2. By Application

        12.2.3. By End Use

        12.2.4. By Form

        12.2.5. By Sorce

        12.2.6. By Sales Channel

    12.3. Market Attractiveness Analysis

        12.3.1. By Country

        12.3.2. By Application

        12.3.3. By End Use

        12.3.4. By Form

        12.3.5. By Sorce

        12.3.6. By Sales Channel

    12.4. Key Takeaways

13. Europe Market Analysis 2017 to 2021 and Forecast 2022 to 2032, By Country

    13.1. Historical Market Size Value (US$ Million) & Volume(Units) Trend Analysis By Market Taxonomy, 2017 to 2021

    13.2. Market Size Value (US$ Million) & Volume(Units) Forecast By Market Taxonomy, 2022 to 2032

        13.2.1. By Country

            13.2.1.1. Germany

            13.2.1.2. Italy

            13.2.1.3. France

            13.2.1.4. United Kingdom

            13.2.1.5. Spain

            13.2.1.6. Russia

            13.2.1.7. BENELUX

            13.2.1.8. Rest of Europe

        13.2.2. By Application

        13.2.3. By End Use

        13.2.4. By Form

        13.2.5. By Sorce

        13.2.6. By Sales Channel

    13.3. Market Attractiveness Analysis

        13.3.1. By Country

        13.3.2. By Application

        13.3.3. By End Use

        13.3.4. By Form

        13.3.5. By Sorce

        13.3.6. By Sales Channel

    13.4. Key Takeaways

14. East Asia Market Analysis 2017 to 2021 and Forecast 2022 to 2032, By Country

    14.1. Historical Market Size Value (US$ Million) & Volume(Units) Trend Analysis By Market Taxonomy, 2017 to 2021

    14.2. Market Size Value (US$ Million) & Volume(Units) Forecast By Market Taxonomy, 2022 to 2032

        14.2.1. By Country

            14.2.1.1. China

            14.2.1.2. Japan

            14.2.1.3. South Korea

        14.2.2. By Application

        14.2.3. By End Use

        14.2.4. By Form

        14.2.5. By Sorce

        14.2.6. By Sales Channel

    14.3. Market Attractiveness Analysis

        14.3.1. By Country

        14.3.2. By Application

        14.3.3. By End Use

        14.3.4. By Form

        14.3.5. By Sorce

        14.3.6. By Sales Channel

    14.4. Key Takeaways

15. South Asia Market Analysis 2017 to 2021 and Forecast 2022 to 2032, By Country

    15.1. Historical Market Size Value (US$ Million) & Volume(Units) Trend Analysis By Market Taxonomy, 2017 to 2021

    15.2. Market Size Value (US$ Million) & Volume(Units) Forecast By Market Taxonomy, 2022 to 2032

        15.2.1. By Country

            15.2.1.1. India

            15.2.1.2. Thailand

            15.2.1.3. Malaysia

            15.2.1.4. Indonesia

            15.2.1.5. Rest of South Asia

        15.2.2. By Application

        15.2.3. By End Use

        15.2.4. By Form

        15.2.5. By Sorce

        15.2.6. By Sales Channel

    15.3. Market Attractiveness Analysis

        15.3.1. By Country

        15.3.2. By Application

        15.3.3. By End Use

        15.3.4. By Form

        15.3.5. By Sorce

        15.3.6. By Sales Channel

    15.4. Key Takeaways

16. Oceania Market Analysis 2017 to 2021 and Forecast 2022 to 2032, By Country

    16.1. Historical Market Size Value (US$ Million) & Volume(Units) Trend Analysis By Market Taxonomy, 2017 to 2021

    16.2. Market Size Value (US$ Million) & Volume(Units) Forecast By Market Taxonomy, 2022 to 2032

        16.2.1. By Country

            16.2.1.1. Australia

            16.2.1.2. New Zealand

        16.2.2. By Application

        16.2.3. By End Use

        16.2.4. By Form

        16.2.5. By Sorce

        16.2.6. By Sales Channel

    16.3. Market Attractiveness Analysis

        16.3.1. By Country

        16.3.2. By Application

        16.3.3. By End Use

        16.3.4. By Form

        16.3.5. By Sorce

        16.3.6. By Sales Channel

    16.4. Key Takeaways

17. Middle East and Africa Market Analysis 2017 to 2021 and Forecast 2022 to 2032, By Country

    17.1. Historical Market Size Value (US$ Million) & Volume(Units) Trend Analysis By Market Taxonomy, 2017 to 2021

    17.2. Market Size Value (US$ Million) & Volume(Units) Forecast By Market Taxonomy, 2022 to 2032

        17.2.1. By Country

            17.2.1.1. GCC Countries

            17.2.1.2. Turkey

            17.2.1.3. Israel

            17.2.1.4. South Africa

            17.2.1.5. Egypt

            17.2.1.6. Rest of Middle East and Africa

        17.2.2. By Application

        17.2.3. By End Use

        17.2.4. By Form

        17.2.5. By Sorce

        17.2.6. By Sales Channel

    17.3. Market Attractiveness Analysis

        17.3.1. By Country

        17.3.2. By Application

        17.3.3. By End Use

        17.3.4. By Form

        17.3.5. By Sorce

        17.3.6. By Sales Channel

    17.4. Key Takeaways

18. Key Countries Market Analysis

    18.1. USA

        18.1.1. Pricing Analysis

        18.1.2. Market Share Analysis, 2021

            18.1.2.1. By Application

            18.1.2.2. By End Use

            18.1.2.3. By Form

            18.1.2.4. By Sorce

            18.1.2.5. By Sales Channel

    18.2. Canada

        18.2.1. Pricing Analysis

        18.2.2. Market Share Analysis, 2021

            18.2.2.1. By Application

            18.2.2.2. By End Use

            18.2.2.3. By Form

            18.2.2.4. By Sorce

            18.2.2.5. By Sales Channel

    18.3. Brazil

        18.3.1. Pricing Analysis

        18.3.2. Market Share Analysis, 2021

            18.3.2.1. By Application

            18.3.2.2. By End Use

            18.3.2.3. By Form

            18.3.2.4. By Sorce

            18.3.2.5. By Sales Channel

    18.4. Mexico

        18.4.1. Pricing Analysis

        18.4.2. Market Share Analysis, 2021

            18.4.2.1. By Application

            18.4.2.2. By End Use

            18.4.2.3. By Form

            18.4.2.4. By Sorce

            18.4.2.5. By Sales Channel

    18.5. Argentina

        18.5.1. Pricing Analysis

        18.5.2. Market Share Analysis, 2021

            18.5.2.1. By Application

            18.5.2.2. By End Use

            18.5.2.3. By Form

            18.5.2.4. By Sorce

            18.5.2.5. By Sales Channel

    18.6. Germany

        18.6.1. Pricing Analysis

        18.6.2. Market Share Analysis, 2021

            18.6.2.1. By Application

            18.6.2.2. By End Use

            18.6.2.3. By Form

            18.6.2.4. By Sorce

            18.6.2.5. By Sales Channel

    18.7. Italy

        18.7.1. Pricing Analysis

        18.7.2. Market Share Analysis, 2021

            18.7.2.1. By Application

            18.7.2.2. By End Use

            18.7.2.3. By Form

            18.7.2.4. By Sorce

            18.7.2.5. By Sales Channel

    18.8. France

        18.8.1. Pricing Analysis

        18.8.2. Market Share Analysis, 2021

            18.8.2.1. By Application

            18.8.2.2. By End Use

            18.8.2.3. By Form

            18.8.2.4. By Sorce

            18.8.2.5. By Sales Channel

    18.9. United Kingdom

        18.9.1. Pricing Analysis

        18.9.2. Market Share Analysis, 2021

            18.9.2.1. By Application

            18.9.2.2. By End Use

            18.9.2.3. By Form

            18.9.2.4. By Sorce

            18.9.2.5. By Sales Channel

    18.10. Spain

        18.10.1. Pricing Analysis

        18.10.2. Market Share Analysis, 2021

            18.10.2.1. By Application

            18.10.2.2. By End Use

            18.10.2.3. By Form

            18.10.2.4. By Sorce

            18.10.2.5. By Sales Channel

    18.11. Russia

        18.11.1. Pricing Analysis

        18.11.2. Market Share Analysis, 2021

            18.11.2.1. By Application

            18.11.2.2. By End Use

            18.11.2.3. By Form

            18.11.2.4. By Sorce

            18.11.2.5. By Sales Channel

    18.12. BENELUX

        18.12.1. Pricing Analysis

        18.12.2. Market Share Analysis, 2021

            18.12.2.1. By Application

            18.12.2.2. By End Use

            18.12.2.3. By Form

            18.12.2.4. By Sorce

            18.12.2.5. By Sales Channel

    18.13. China

        18.13.1. Pricing Analysis

        18.13.2. Market Share Analysis, 2021

            18.13.2.1. By Application

            18.13.2.2. By End Use

            18.13.2.3. By Form

            18.13.2.4. By Sorce

            18.13.2.5. By Sales Channel

    18.14. Japan

        18.14.1. Pricing Analysis

        18.14.2. Market Share Analysis, 2021

            18.14.2.1. By Application

            18.14.2.2. By End Use

            18.14.2.3. By Form

            18.14.2.4. By Sorce

            18.14.2.5. By Sales Channel

    18.15. South Korea

        18.15.1. Pricing Analysis

        18.15.2. Market Share Analysis, 2021

            18.15.2.1. By Application

            18.15.2.2. By End Use

            18.15.2.3. By Form

            18.15.2.4. By Sorce

            18.15.2.5. By Sales Channel

    18.16. India

        18.16.1. Pricing Analysis

        18.16.2. Market Share Analysis, 2021

            18.16.2.1. By Application

            18.16.2.2. By End Use

            18.16.2.3. By Form

            18.16.2.4. By Sorce

            18.16.2.5. By Sales Channel

    18.17. GCC Countries

        18.17.1. Pricing Analysis

        18.17.2. Market Share Analysis, 2021

            18.17.2.1. By Application

            18.17.2.2. By End Use

            18.17.2.3. By Form

            18.17.2.4. By Sorce

            18.17.2.5. By Sales Channel

    18.18. Turkey

        18.18.1. Pricing Analysis

        18.18.2. Market Share Analysis, 2021

            18.18.2.1. By Application

            18.18.2.2. By End Use

            18.18.2.3. By Form

            18.18.2.4. By Sorce

            18.18.2.5. By Sales Channel

    18.19. Israel

        18.19.1. Pricing Analysis

        18.19.2. Market Share Analysis, 2021

            18.19.2.1. By Application

            18.19.2.2. By End Use

            18.19.2.3. By Form

            18.19.2.4. By Sorce

            18.19.2.5. By Sales Channel

    18.20. South Africa

        18.20.1. Pricing Analysis

        18.20.2. Market Share Analysis, 2021

            18.20.2.1. By Application

            18.20.2.2. By End Use

            18.20.2.3. By Form

            18.20.2.4. By Sorce

            18.20.2.5. By Sales Channel

    18.21. Egypt

        18.21.1. Pricing Analysis

        18.21.2. Market Share Analysis, 2021

            18.21.2.1. By Application

            18.21.2.2. By End Use

            18.21.2.3. By Form

            18.21.2.4. By Sorce

            18.21.2.5. By Sales Channel

19. Market Structure Analysis

    19.1. Competition Dashboard

    19.2. Competition Benchmarking

    19.3. Market Share Analysis of Top Players

        19.3.1. By Regional

        19.3.2. By Application

        19.3.3. By End Use

        19.3.4. By Form

        19.3.5. By Sorce

        19.3.6. By Sales Channel

20. Competition Analysis

    20.1. Competition Deep Dive

        20.1.1. SkinChakra

            20.1.1.1. Overview

            20.1.1.2. Product Portfolio

            20.1.1.3. Profitability by Market Segment

            20.1.1.4. Sales Footprint

            20.1.1.5. Strategy Overview

                20.1.1.5.1. Marketing Strategy

                20.1.1.5.2. Product Strategy

        20.1.2. Parchem fine & specialty chemicals

            20.1.2.1. Overview

            20.1.2.2. Product Portfolio

            20.1.2.3. Profitability by Market Segment

            20.1.2.4. Sales Footprint

            20.1.2.5. Strategy Overview

                20.1.2.5.1. Marketing Strategy

                20.1.2.5.2. Product Strategy

        20.1.3. Stepan Company

            20.1.3.1. Overview

            20.1.3.2. Product Portfolio

            20.1.3.3. Profitability by Market Segment

            20.1.3.4. Sales Footprint

            20.1.3.5. Strategy Overview

                20.1.3.5.1. Marketing Strategy

                20.1.3.5.2. Product Strategy

        20.1.4. ABITEC

            20.1.4.1. Overview

            20.1.4.2. Product Portfolio

            20.1.4.3. Profitability by Market Segment

            20.1.4.4. Sales Footprint

            20.1.4.5. Strategy Overview

                20.1.4.5.1. Marketing Strategy

                20.1.4.5.2. Product Strategy

        20.1.5. BOC Sciences

            20.1.5.1. Overview

            20.1.5.2. Product Portfolio

            20.1.5.3. Profitability by Market Segment

            20.1.5.4. Sales Footprint

            20.1.5.5. Strategy Overview

                20.1.5.5.1. Marketing Strategy

                20.1.5.5.2. Product Strategy

        20.1.6. Kao Corporation

            20.1.6.1. Overview

            20.1.6.2. Product Portfolio

            20.1.6.3. Profitability by Market Segment

            20.1.6.4. Sales Footprint

            20.1.6.5. Strategy Overview

                20.1.6.5.1. Marketing Strategy

                20.1.6.5.2. Product Strategy

        20.1.7. Kingyoung Bio Technical Co. Ltd.

            20.1.7.1. Overview

            20.1.7.2. Product Portfolio

            20.1.7.3. Profitability by Market Segment

            20.1.7.4. Sales Footprint

            20.1.7.5. Strategy Overview

                20.1.7.5.1. Marketing Strategy

                20.1.7.5.2. Product Strategy

        20.1.8. Tokyo Chemical Industry Co., Ltd. (TCI)

            20.1.8.1. Overview

            20.1.8.2. Product Portfolio

            20.1.8.3. Profitability by Market Segment

            20.1.8.4. Sales Footprint

            20.1.8.5. Strategy Overview

                20.1.8.5.1. Marketing Strategy

                20.1.8.5.2. Product Strategy

        20.1.9. INOLEX Inc.

            20.1.9.1. Overview

            20.1.9.2. Product Portfolio

            20.1.9.3. Profitability by Market Segment

            20.1.9.4. Sales Footprint

            20.1.9.5. Strategy Overview

                20.1.9.5.1. Marketing Strategy

                20.1.9.5.2. Product Strategy

        20.1.10. Subhash Chemical Industries Pvt Ltd.

            20.1.10.1. Overview

            20.1.10.2. Product Portfolio

            20.1.10.3. Profitability by Market Segment

            20.1.10.4. Sales Footprint

            20.1.10.5. Strategy Overview

                20.1.10.5.1. Marketing Strategy

                20.1.10.5.2. Product Strategy

        20.1.11. Universal Preserv-A-Chem Inc. [UPI]

            20.1.11.1. Overview

            20.1.11.2. Product Portfolio

            20.1.11.3. Profitability by Market Segment

            20.1.11.4. Sales Footprint

            20.1.11.5. Strategy Overview

                20.1.11.5.1. Marketing Strategy

                20.1.11.5.2. Product Strategy

        20.1.12. SpecialChem

            20.1.12.1. Overview

            20.1.12.2. Product Portfolio

            20.1.12.3. Profitability by Market Segment

            20.1.12.4. Sales Footprint

            20.1.12.5. Strategy Overview

                20.1.12.5.1. Marketing Strategy

                20.1.12.5.2. Product Strategy

        20.1.13. Evonik Industries

            20.1.13.1. Overview

            20.1.13.2. Product Portfolio

            20.1.13.3. Profitability by Market Segment

            20.1.13.4. Sales Footprint

            20.1.13.5. Strategy Overview

                20.1.13.5.1. Marketing Strategy

                20.1.13.5.2. Product Strategy

21. Assumptions & Acronyms Used

22. Research Methodology

List of Tables

Table 1: Global Market Value (US$ Million) Forecast by Region, 2017 to 2032

Table 2: Global Market Volume(Units) Forecast by Region, 2017 to 2032

Table 3: Global Market Value (US$ Million) Forecast by Application, 2017 to 2032

Table 4: Global Market Volume(Units) Forecast by Application, 2017 to 2032

Table 5: Global Market Value (US$ Million) Forecast by End Use, 2017 to 2032

Table 6: Global Market Volume(Units) Forecast by End Use, 2017 to 2032

Table 7: Global Market Value (US$ Million) Forecast by Form, 2017 to 2032

Table 8: Global Market Volume(Units) Forecast by Form, 2017 to 2032

Table 9: Global Market Value (US$ Million) Forecast by Sorce, 2017 to 2032

Table 10: Global Market Volume(Units) Forecast by Sorce, 2017 to 2032

Table 11: Global Market Value (US$ Million) Forecast by Sales Channels, 2017 to 2032

Table 12: Global Market Volume(Units) Forecast by Sales Channels, 2017 to 2032

Table 13: North America Market Value (US$ Million) Forecast by Country, 2017 to 2032

Table 14: North America Market Volume(Units) Forecast by Country, 2017 to 2032

Table 15: North America Market Value (US$ Million) Forecast by Application, 2017 to 2032

Table 16: North America Market Volume(Units) Forecast by Application, 2017 to 2032

Table 17: North America Market Value (US$ Million) Forecast by End Use, 2017 to 2032

Table 18: North America Market Volume(Units) Forecast by End Use, 2017 to 2032

Table 19: North America Market Value (US$ Million) Forecast by Form, 2017 to 2032

Table 20: North America Market Volume(Units) Forecast by Form, 2017 to 2032

Table 21: North America Market Value (US$ Million) Forecast by Sorce, 2017 to 2032

Table 22: North America Market Volume(Units) Forecast by Sorce, 2017 to 2032

Table 23: North America Market Value (US$ Million) Forecast by Sales Channels, 2017 to 2032

Table 24: North America Market Volume(Units) Forecast by Sales Channels, 2017 to 2032

Table 25: Latin America Market Value (US$ Million) Forecast by Country, 2017 to 2032

Table 26: Latin America Market Volume(Units) Forecast by Country, 2017 to 2032

Table 27: Latin America Market Value (US$ Million) Forecast by Application, 2017 to 2032

Table 28: Latin America Market Volume(Units) Forecast by Application, 2017 to 2032

Table 29: Latin America Market Value (US$ Million) Forecast by End Use, 2017 to 2032

Table 30: Latin America Market Volume(Units) Forecast by End Use, 2017 to 2032

Table 31: Latin America Market Value (US$ Million) Forecast by Form, 2017 to 2032

Table 32: Latin America Market Volume(Units) Forecast by Form, 2017 to 2032

Table 33: Latin America Market Value (US$ Million) Forecast by Sorce, 2017 to 2032

Table 34: Latin America Market Volume(Units) Forecast by Sorce, 2017 to 2032

Table 35: Latin America Market Value (US$ Million) Forecast by Sales Channels, 2017 to 2032

Table 36: Latin America Market Volume(Units) Forecast by Sales Channels, 2017 to 2032

Table 37: Europe Market Value (US$ Million) Forecast by Country, 2017 to 2032

Table 38: Europe Market Volume(Units) Forecast by Country, 2017 to 2032

Table 39: Europe Market Value (US$ Million) Forecast by Application, 2017 to 2032

Table 40: Europe Market Volume(Units) Forecast by Application, 2017 to 2032

Table 41: Europe Market Value (US$ Million) Forecast by End Use, 2017 to 2032

Table 42: Europe Market Volume(Units) Forecast by End Use, 2017 to 2032

Table 43: Europe Market Value (US$ Million) Forecast by Form, 2017 to 2032

Table 44: Europe Market Volume(Units) Forecast by Form, 2017 to 2032

Table 45: Europe Market Value (US$ Million) Forecast by Sorce, 2017 to 2032

Table 46: Europe Market Volume(Units) Forecast by Sorce, 2017 to 2032

Table 47: Europe Market Value (US$ Million) Forecast by Sales Channels, 2017 to 2032

Table 48: Europe Market Volume(Units) Forecast by Sales Channels, 2017 to 2032

Table 49: East Asia Market Value (US$ Million) Forecast by Country, 2017 to 2032

Table 50: East Asia Market Volume(Units) Forecast by Country, 2017 to 2032

Table 51: East Asia Market Value (US$ Million) Forecast by Application, 2017 to 2032

Table 52: East Asia Market Volume(Units) Forecast by Application, 2017 to 2032

Table 53: East Asia Market Value (US$ Million) Forecast by End Use, 2017 to 2032

Table 54: East Asia Market Volume(Units) Forecast by End Use, 2017 to 2032

Table 55: East Asia Market Value (US$ Million) Forecast by Form, 2017 to 2032

Table 56: East Asia Market Volume(Units) Forecast by Form, 2017 to 2032

Table 57: East Asia Market Value (US$ Million) Forecast by Sorce, 2017 to 2032

Table 58: East Asia Market Volume(Units) Forecast by Sorce, 2017 to 2032

Table 59: East Asia Market Value (US$ Million) Forecast by Sales Channels, 2017 to 2032

Table 60: East Asia Market Volume(Units) Forecast by Sales Channels, 2017 to 2032

Table 61: South Asia Market Value (US$ Million) Forecast by Country, 2017 to 2032

Table 62: South Asia Market Volume(Units) Forecast by Country, 2017 to 2032

Table 63: South Asia Market Value (US$ Million) Forecast by Application, 2017 to 2032

Table 64: South Asia Market Volume(Units) Forecast by Application, 2017 to 2032

Table 65: South Asia Market Value (US$ Million) Forecast by End Use, 2017 to 2032

Table 66: South Asia Market Volume(Units) Forecast by End Use, 2017 to 2032

Table 67: South Asia Market Value (US$ Million) Forecast by Form, 2017 to 2032

Table 68: South Asia Market Volume(Units) Forecast by Form, 2017 to 2032

Table 69: South Asia Market Value (US$ Million) Forecast by Sorce, 2017 to 2032

Table 70: South Asia Market Volume(Units) Forecast by Sorce, 2017 to 2032

Table 71: South Asia Market Value (US$ Million) Forecast by Sales Channels, 2017 to 2032

Table 72: South Asia Market Volume(Units) Forecast by Sales Channels, 2017 to 2032

Table 73: Oceania Market Value (US$ Million) Forecast by Country, 2017 to 2032

Table 74: Oceania Market Volume(Units) Forecast by Country, 2017 to 2032

Table 75: Oceania Market Value (US$ Million) Forecast by Application, 2017 to 2032

Table 76: Oceania Market Volume(Units) Forecast by Application, 2017 to 2032

Table 77: Oceania Market Value (US$ Million) Forecast by End Use, 2017 to 2032

Table 78: Oceania Market Volume(Units) Forecast by End Use, 2017 to 2032

Table 79: Oceania Market Value (US$ Million) Forecast by Form, 2017 to 2032

Table 80: Oceania Market Volume(Units) Forecast by Form, 2017 to 2032

Table 81: Oceania Market Value (US$ Million) Forecast by Sorce, 2017 to 2032

Table 82: Oceania Market Volume(Units) Forecast by Sorce, 2017 to 2032

Table 83: Oceania Market Value (US$ Million) Forecast by Sales Channels, 2017 to 2032

Table 84: Oceania Market Volume(Units) Forecast by Sales Channels, 2017 to 2032

Table 85: MEA Market Value (US$ Million) Forecast by Country, 2017 to 2032

Table 86: MEA Market Volume(Units) Forecast by Country, 2017 to 2032

Table 87: MEA Market Value (US$ Million) Forecast by Application, 2017 to 2032

Table 88: MEA Market Volume(Units) Forecast by Application, 2017 to 2032

Table 89: MEA Market Value (US$ Million) Forecast by End Use, 2017 to 2032

Table 90: MEA Market Volume(Units) Forecast by End Use, 2017 to 2032

Table 91: MEA Market Value (US$ Million) Forecast by Form, 2017 to 2032

Table 92: MEA Market Volume(Units) Forecast by Form, 2017 to 2032

Table 93: MEA Market Value (US$ Million) Forecast by Sorce, 2017 to 2032

Table 94: MEA Market Volume(Units) Forecast by Sorce, 2017 to 2032

Table 95: MEA Market Value (US$ Million) Forecast by Sales Channels, 2017 to 2032

Table 96: MEA Market Volume(Units) Forecast by Sales Channels, 2017 to 2032

List of Charts

Figure 1: Global Market Value (US$ Million) by Application, 2022 to 2032

Figure 2: Global Market Value (US$ Million) by End Use, 2022 to 2032

Figure 3: Global Market Value (US$ Million) by Form, 2022 to 2032

Figure 4: Global Market Value (US$ Million) by Source, 2022 to 2032

Figure 5: Global Market Value (US$ Million) by Sales Channel, 2022 to 2032

Figure 6: Global Market Value (US$ Million) by Region, 2022 to 2032

Figure 7: Global Market Value (US$ Million) Analysis by Region, 2017 to 2032

Figure 8: Global Market Volume(Units) Analysis by Region, 2017 to 2032

Figure 9: Global Market Value Share (%) and BPS Analysis by Region, 2022 to 2032

Figure 10: Global Market Y-o-Y Growth (%) Projections by Region, 2022 to 2032

Figure 11: Global Market Value (US$ Million) Analysis by Application, 2017 to 2032

Figure 12: Global Market Volume(Units) Analysis by Application, 2017 to 2032

Figure 13: Global Market Value Share (%) and BPS Analysis by Application, 2022 to 2032

Figure 14: Global Market Y-o-Y Growth (%) Projections by Application, 2022 to 2032

Figure 15: Global Market Value (US$ Million) Analysis by End Use, 2017 to 2032

Figure 16: Global Market Volume(Units) Analysis by End Use, 2017 to 2032

Figure 17: Global Market Value Share (%) and BPS Analysis by End Use, 2022 to 2032

Figure 18: Global Market Y-o-Y Growth (%) Projections by End Use, 2022 to 2032

Figure 19: Global Market Value (US$ Million) Analysis by Form, 2017 to 2032

Figure 20: Global Market Volume(Units) Analysis by Form, 2017 to 2032

Figure 21: Global Market Value Share (%) and BPS Analysis by Form, 2022 to 2032

Figure 22: Global Market Y-o-Y Growth (%) Projections by Form, 2022 to 2032

Figure 23: Global Market Value (US$ Million) Analysis by Source, 2017 to 2032

Figure 24: Global Market Volume(Units) Analysis by Source, 2017 to 2032

Figure 25: Global Market Value Share (%) and BPS Analysis by Sorce, 2022 to 2032

Figure 26: Global Market Y-o-Y Growth (%) Projections by Source, 2022 to 2032

Figure 27: Global Market Value (US$ Million) Analysis by Sales Channel, 2017 to 2032

Figure 28: Global Market Volume(Units) Analysis by Sales Channel, 2017 to 2032

Figure 29: Global Market Value Share (%) and BPS Analysis by Sales Channel, 2022 to 2032

Figure 30: Global Market Y-o-Y Growth (%) Projections by Sales Channel, 2022 to 2032

Figure 31: Global Market Attractiveness by Application, 2022 to 2032

Figure 32: Global Market Attractiveness by End Use, 2022 to 2032

Figure 33: Global Market Attractiveness by Form, 2022 to 2032

Figure 34: Global Market Attractiveness by Sorce, 2022 to 2032

Figure 35: Global Market Attractiveness by Sales Channel, 2022 to 2032

Figure 36: Global Market Attractiveness by Region, 2022 to 2032

Figure 37: North America Market Value (US$ Million) by Application, 2022 to 2032

Figure 38: North America Market Value (US$ Million) by End Use, 2022 to 2032

Figure 39: North America Market Value (US$ Million) by Form, 2022 to 2032

Figure 40: North America Market Value (US$ Million) by Source, 2022 to 2032

Figure 41: North America Market Value (US$ Million) by Sales Channel, 2022 to 2032

Figure 42: North America Market Value (US$ Million) by Country, 2022 to 2032

Figure 43: North America Market Value (US$ Million) Analysis by Country, 2017 to 2032

Figure 44: North America Market Volume(Units) Analysis by Country, 2017 to 2032

Figure 45: North America Market Value Share (%) and BPS Analysis by Country, 2022 to 2032

Figure 46: North America Market Y-o-Y Growth (%) Projections by Country, 2022 to 2032

Figure 47: North America Market Value (US$ Million) Analysis by Application, 2017 to 2032

Figure 48: North America Market Volume(Units) Analysis by Application, 2017 to 2032

Figure 49: North America Market Value Share (%) and BPS Analysis by Application, 2022 to 2032

Figure 50: North America Market Y-o-Y Growth (%) Projections by Application, 2022 to 2032

Figure 51: North America Market Value (US$ Million) Analysis by End Use, 2017 to 2032

Figure 52: North America Market Volume(Units) Analysis by End Use, 2017 to 2032

Figure 53: North America Market Value Share (%) and BPS Analysis by End Use, 2022 to 2032

Figure 54: North America Market Y-o-Y Growth (%) Projections by End Use, 2022 to 2032

Figure 55: North America Market Value (US$ Million) Analysis by Form, 2017 to 2032

Figure 56: North America Market Volume(Units) Analysis by Form, 2017 to 2032

Figure 57: North America Market Value Share (%) and BPS Analysis by Form, 2022 to 2032

Figure 58: North America Market Y-o-Y Growth (%) Projections by Form, 2022 to 2032

Figure 59: North America Market Value (US$ Million) Analysis by Source, 2017 to 2032

Figure 60: North America Market Volume(Units) Analysis by Sorce, 2017 to 2032

Figure 61: North America Market Value Share (%) and BPS Analysis by Source, 2022 to 2032

Figure 62: North America Market Y-o-Y Growth (%) Projections by Source, 2022 to 2032

Figure 63: North America Market Value (US$ Million) Analysis by Sales Channel, 2017 to 2032

Figure 64: North America Market Volume(Units) Analysis by Sales Channel, 2017 to 2032

Figure 65: North America Market Value Share (%) and BPS Analysis by Sales Channel, 2022 to 2032

Figure 66: North America Market Y-o-Y Growth (%) Projections by Sales Channel, 2022 to 2032

Figure 67: North America Market Attractiveness by Application, 2022 to 2032

Figure 68: North America Market Attractiveness by End Use, 2022 to 2032

Figure 69: North America Market Attractiveness by Form, 2022 to 2032

Figure 70: North America Market Attractiveness by Source, 2022 to 2032

Figure 71: North America Market Attractiveness by Sales Channel, 2022 to 2032

Figure 72: North America Market Attractiveness by Country, 2022 to 2032

Figure 73: Latin America Market Value (US$ Million) by Application, 2022 to 2032

Figure 74: Latin America Market Value (US$ Million) by End Use, 2022 to 2032

Figure 75: Latin America Market Value (US$ Million) by Form, 2022 to 2032

Figure 76: Latin America Market Value (US$ Million) by Sorce, 2022 to 2032

Figure 77: Latin America Market Value (US$ Million) by Sales Channel, 2022 to 2032

Figure 78: Latin America Market Value (US$ Million) by Country, 2022 to 2032

Figure 79: Latin America Market Value (US$ Million) Analysis by Country, 2017 to 2032

Figure 80: Latin America Market Volume(Units) Analysis by Country, 2017 to 2032

Figure 81: Latin America Market Value Share (%) and BPS Analysis by Country, 2022 to 2032

Figure 82: Latin America Market Y-o-Y Growth (%) Projections by Country, 2022 to 2032

Figure 83: Latin America Market Value (US$ Million) Analysis by Application, 2017 to 2032

Figure 84: Latin America Market Volume(Units) Analysis by Application, 2017 to 2032

Figure 85: Latin America Market Value Share (%) and BPS Analysis by Application, 2022 to 2032

Figure 86: Latin America Market Y-o-Y Growth (%) Projections by Application, 2022 to 2032

Figure 87: Latin America Market Value (US$ Million) Analysis by End Use, 2017 to 2032

Figure 88: Latin America Market Volume(Units) Analysis by End Use, 2017 to 2032

Figure 89: Latin America Market Value Share (%) and BPS Analysis by End Use, 2022 to 2032

Figure 90: Latin America Market Y-o-Y Growth (%) Projections by End Use, 2022 to 2032

Figure 91: Latin America Market Value (US$ Million) Analysis by Form, 2017 to 2032

Figure 92: Latin America Market Volume(Units) Analysis by Form, 2017 to 2032

Figure 93: Latin America Market Value Share (%) and BPS Analysis by Form, 2022 to 2032

Figure 94: Latin America Market Y-o-Y Growth (%) Projections by Form, 2022 to 2032

Figure 95: Latin America Market Value (US$ Million) Analysis by Sorce, 2017 to 2032

Figure 96: Latin America Market Volume(Units) Analysis by Sorce, 2017 to 2032

Figure 97: Latin America Market Value Share (%) and BPS Analysis by Sorce, 2022 to 2032

Figure 98: Latin America Market Y-o-Y Growth (%) Projections by Source, 2022 to 2032

Figure 99: Latin America Market Value (US$ Million) Analysis by Sales Channel, 2017 to 2032

Figure 100: Latin America Market Volume(Units) Analysis by Sales Channel, 2017 to 2032

Figure 101: Latin America Market Value Share (%) and BPS Analysis by Sales Channel, 2022 to 2032

Figure 102: Latin America Market Y-o-Y Growth (%) Projections by Sales Channel, 2022 to 2032

Figure 103: Latin America Market Attractiveness by Application, 2022 to 2032

Figure 104: Latin America Market Attractiveness by End Use, 2022 to 2032

Figure 105: Latin America Market Attractiveness by Form, 2022 to 2032

Figure 106: Latin America Market Attractiveness by Sorce, 2022 to 2032

Figure 107: Latin America Market Attractiveness by Sales Channel, 2022 to 2032

Figure 108: Latin America Market Attractiveness by Country, 2022 to 2032

Figure 109: Europe Market Value (US$ Million) by Application, 2022 to 2032

Figure 110: Europe Market Value (US$ Million) by End Use, 2022 to 2032

Figure 111: Europe Market Value (US$ Million) by Form, 2022 to 2032

Figure 112: Europe Market Value (US$ Million) by Source, 2022 to 2032

Figure 113: Europe Market Value (US$ Million) by Sales Channel, 2022 to 2032

Figure 114: Europe Market Value (US$ Million) by Country, 2022 to 2032

Figure 115: Europe Market Value (US$ Million) Analysis by Country, 2017 to 2032

Figure 116: Europe Market Volume(Units) Analysis by Country, 2017 to 2032

Figure 117: Europe Market Value Share (%) and BPS Analysis by Country, 2022 to 2032

Figure 118: Europe Market Y-o-Y Growth (%) Projections by Country, 2022 to 2032

Figure 119: Europe Market Value (US$ Million) Analysis by Application, 2017 to 2032

Figure 120: Europe Market Volume(Units) Analysis by Application, 2017 to 2032

Figure 121: Europe Market Value Share (%) and BPS Analysis by Application, 2022 to 2032

Figure 122: Europe Market Y-o-Y Growth (%) Projections by Application, 2022 to 2032

Figure 123: Europe Market Value (US$ Million) Analysis by End Use, 2017 to 2032

Figure 124: Europe Market Volume(Units) Analysis by End Use, 2017 to 2032

Figure 125: Europe Market Value Share (%) and BPS Analysis by End Use, 2022 to 2032

Figure 126: Europe Market Y-o-Y Growth (%) Projections by End Use, 2022 to 2032

Figure 127: Europe Market Value (US$ Million) Analysis by Form, 2017 to 2032

Figure 128: Europe Market Volume(Units) Analysis by Form, 2017 to 2032

Figure 129: Europe Market Value Share (%) and BPS Analysis by Form, 2022 to 2032

Figure 130: Europe Market Y-o-Y Growth (%) Projections by Form, 2022 to 2032

Figure 131: Europe Market Value (US$ Million) Analysis by Source, 2017 to 2032

Figure 132: Europe Market Volume(Units) Analysis by Source, 2017 to 2032

Figure 133: Europe Market Value Share (%) and BPS Analysis by Source, 2022 to 2032

Figure 134: Europe Market Y-o-Y Growth (%) Projections by Source, 2022 to 2032

Figure 135: Europe Market Value (US$ Million) Analysis by Sales Channel, 2017 to 2032

Figure 136: Europe Market Volume(Units) Analysis by Sales Channel, 2017 to 2032

Figure 137: Europe Market Value Share (%) and BPS Analysis by Sales Channel, 2022 to 2032

Figure 138: Europe Market Y-o-Y Growth (%) Projections by Sales Channel, 2022 to 2032

Figure 139: Europe Market Attractiveness by Application, 2022 to 2032

Figure 140: Europe Market Attractiveness by End Use, 2022 to 2032

Figure 141: Europe Market Attractiveness by Form, 2022 to 2032

Figure 142: Europe Market Attractiveness by Sorce, 2022 to 2032

Figure 143: Europe Market Attractiveness by Sales Channel, 2022 to 2032

Figure 144: Europe Market Attractiveness by Country, 2022 to 2032

Figure 145: East Asia Market Value (US$ Million) by Application, 2022 to 2032

Figure 146: East Asia Market Value (US$ Million) by End Use, 2022 to 2032

Figure 147: East Asia Market Value (US$ Million) by Form, 2022 to 2032

Figure 148: East Asia Market Value (US$ Million) by Sorce, 2022 to 2032

Figure 149: East Asia Market Value (US$ Million) by Sales Channel, 2022 to 2032

Figure 150: East Asia Market Value (US$ Million) by Country, 2022 to 2032

Figure 151: East Asia Market Value (US$ Million) Analysis by Country, 2017 to 2032

Figure 152: East Asia Market Volume(Units) Analysis by Country, 2017 to 2032

Figure 153: East Asia Market Value Share (%) and BPS Analysis by Country, 2022 to 2032

Figure 154: East Asia Market Y-o-Y Growth (%) Projections by Country, 2022 to 2032

Figure 155: East Asia Market Value (US$ Million) Analysis by Application, 2017 to 2032

Figure 156: East Asia Market Volume(Units) Analysis by Application, 2017 to 2032

Figure 157: East Asia Market Value Share (%) and BPS Analysis by Application, 2022 to 2032

Figure 158: East Asia Market Y-o-Y Growth (%) Projections by Application, 2022 to 2032

Figure 159: East Asia Market Value (US$ Million) Analysis by End Use, 2017 to 2032

Figure 160: East Asia Market Volume(Units) Analysis by End Use, 2017 to 2032

Figure 161: East Asia Market Value Share (%) and BPS Analysis by End Use, 2022 to 2032

Figure 162: East Asia Market Y-o-Y Growth (%) Projections by End Use, 2022 to 2032

Figure 163: East Asia Market Value (US$ Million) Analysis by Form, 2017 to 2032

Figure 164: East Asia Market Volume(Units) Analysis by Form, 2017 to 2032

Figure 165: East Asia Market Value Share (%) and BPS Analysis by Form, 2022 to 2032

Figure 166: East Asia Market Y-o-Y Growth (%) Projections by Form, 2022 to 2032

Figure 167: East Asia Market Value (US$ Million) Analysis by Source, 2017 to 2032

Figure 168: East Asia Market Volume(Units) Analysis by Sorce, 2017 to 2032

Figure 169: East Asia Market Value Share (%) and BPS Analysis by Sorce, 2022 to 2032

Figure 170: East Asia Market Y-o-Y Growth (%) Projections by Sorce, 2022 to 2032

Figure 171: East Asia Market Value (US$ Million) Analysis by Sales Channel, 2017 to 2032

Figure 172: East Asia Market Volume(Units) Analysis by Sales Channel, 2017 to 2032

Figure 173: East Asia Market Value Share (%) and BPS Analysis by Sales Channel, 2022 to 2032

Figure 174: East Asia Market Y-o-Y Growth (%) Projections by Sales Channel, 2022 to 2032

Figure 175: East Asia Market Attractiveness by Application, 2022 to 2032

Figure 176: East Asia Market Attractiveness by End Use, 2022 to 2032

Figure 177: East Asia Market Attractiveness by Form, 2022 to 2032

Figure 178: East Asia Market Attractiveness by Sorce, 2022 to 2032

Figure 179: East Asia Market Attractiveness by Sales Channel, 2022 to 2032

Figure 180: East Asia Market Attractiveness by Country, 2022 to 2032

Figure 181: South Asia Market Value (US$ Million) by Application, 2022 to 2032

Figure 182: South Asia Market Value (US$ Million) by End Use, 2022 to 2032

Figure 183: South Asia Market Value (US$ Million) by Form, 2022 to 2032

Figure 184: South Asia Market Value (US$ Million) by Sorce, 2022 to 2032

Figure 185: South Asia Market Value (US$ Million) by Sales Channel, 2022 to 2032

Figure 186: South Asia Market Value (US$ Million) by Country, 2022 to 2032

Figure 187: South Asia Market Value (US$ Million) Analysis by Country, 2017 to 2032

Figure 188: South Asia Market Volume(Units) Analysis by Country, 2017 to 2032

Figure 189: South Asia Market Value Share (%) and BPS Analysis by Country, 2022 to 2032

Figure 190: South Asia Market Y-o-Y Growth (%) Projections by Country, 2022 to 2032

Figure 191: South Asia Market Value (US$ Million) Analysis by Application, 2017 to 2032

Figure 192: South Asia Market Volume(Units) Analysis by Application, 2017 to 2032

Figure 193: South Asia Market Value Share (%) and BPS Analysis by Application, 2022 to 2032

Figure 194: South Asia Market Y-o-Y Growth (%) Projections by Application, 2022 to 2032

Figure 195: South Asia Market Value (US$ Million) Analysis by End Use, 2017 to 2032

Figure 196: South Asia Market Volume(Units) Analysis by End Use, 2017 to 2032

Figure 197: South Asia Market Value Share (%) and BPS Analysis by End Use, 2022 to 2032

Figure 198: South Asia Market Y-o-Y Growth (%) Projections by End Use, 2022 to 2032

Figure 199: South Asia Market Value (US$ Million) Analysis by Form, 2017 to 2032

Figure 200: South Asia Market Volume(Units) Analysis by Form, 2017 to 2032

Figure 201: South Asia Market Value Share (%) and BPS Analysis by Form, 2022 to 2032

Figure 202: South Asia Market Y-o-Y Growth (%) Projections by Form, 2022 to 2032

Figure 203: South Asia Market Value (US$ Million) Analysis by Source, 2017 to 2032

Figure 204: South Asia Market Volume(Units) Analysis by Sorce, 2017 to 2032

Figure 205: South Asia Market Value Share (%) and BPS Analysis by Sorce, 2022 to 2032

Figure 206: South Asia Market Y-o-Y Growth (%) Projections by Source, 2022 to 2032

Figure 207: South Asia Market Value (US$ Million) Analysis by Sales Channel, 2017 to 2032

Figure 208: South Asia Market Volume(Units) Analysis by Sales Channel, 2017 to 2032

Figure 209: South Asia Market Value Share (%) and BPS Analysis by Sales Channel, 2022 to 2032

Figure 210: South Asia Market Y-o-Y Growth (%) Projections by Sales Channel, 2022 to 2032

Figure 211: South Asia Market Attractiveness by Application, 2022 to 2032

Figure 212: South Asia Market Attractiveness by End Use, 2022 to 2032

Figure 213: South Asia Market Attractiveness by Form, 2022 to 2032

Figure 214: South Asia Market Attractiveness by Source, 2022 to 2032

Figure 215: South Asia Market Attractiveness by Sales Channel, 2022 to 2032

Figure 216: South Asia Market Attractiveness by Country, 2022 to 2032

Figure 217: Oceania Market Value (US$ Million) by Application, 2022 to 2032

Figure 218: Oceania Market Value (US$ Million) by End Use, 2022 to 2032

Figure 219: Oceania Market Value (US$ Million) by Form, 2022 to 2032

Figure 220: Oceania Market Value (US$ Million) by Source, 2022 to 2032

Figure 221: Oceania Market Value (US$ Million) by Sales Channel, 2022 to 2032

Figure 222: Oceania Market Value (US$ Million) by Country, 2022 to 2032

Figure 223: Oceania Market Value (US$ Million) Analysis by Country, 2017 to 2032

Figure 224: Oceania Market Volume(Units) Analysis by Country, 2017 to 2032

Figure 225: Oceania Market Value Share (%) and BPS Analysis by Country, 2022 to 2032

Figure 226: Oceania Market Y-o-Y Growth (%) Projections by Country, 2022 to 2032

Figure 227: Oceania Market Value (US$ Million) Analysis by Application, 2017 to 2032

Figure 228: Oceania Market Volume(Units) Analysis by Application, 2017 to 2032

Figure 229: Oceania Market Value Share (%) and BPS Analysis by Application, 2022 to 2032

Figure 230: Oceania Market Y-o-Y Growth (%) Projections by Application, 2022 to 2032

Figure 231: Oceania Market Value (US$ Million) Analysis by End Use, 2017 to 2032

Figure 232: Oceania Market Volume(Units) Analysis by End Use, 2017 to 2032

Figure 233: Oceania Market Value Share (%) and BPS Analysis by End Use, 2022 to 2032

Figure 234: Oceania Market Y-o-Y Growth (%) Projections by End Use, 2022 to 2032

Figure 235: Oceania Market Value (US$ Million) Analysis by Form, 2017 to 2032

Figure 236: Oceania Market Volume(Units) Analysis by Form, 2017 to 2032

Figure 237: Oceania Market Value Share (%) and BPS Analysis by Form, 2022 to 2032

Figure 238: Oceania Market Y-o-Y Growth (%) Projections by Form, 2022 to 2032

Figure 239: Oceania Market Value (US$ Million) Analysis by Source, 2017 to 2032

Figure 240: Oceania Market Volume(Units) Analysis by Source, 2017 to 2032

Figure 241: Oceania Market Value Share (%) and BPS Analysis by Sorce, 2022 to 2032

Figure 242: Oceania Market Y-o-Y Growth (%) Projections by Source, 2022 to 2032

Figure 243: Oceania Market Value (US$ Million) Analysis by Sales Channel, 2017 to 2032

Figure 244: Oceania Market Volume(Units) Analysis by Sales Channel, 2017 to 2032

Figure 245: Oceania Market Value Share (%) and BPS Analysis by Sales Channel, 2022 to 2032

Figure 246: Oceania Market Y-o-Y Growth (%) Projections by Sales Channel, 2022 to 2032

Figure 247: Oceania Market Attractiveness by Application, 2022 to 2032

Figure 248: Oceania Market Attractiveness by End Use, 2022 to 2032

Figure 249: Oceania Market Attractiveness by Form, 2022 to 2032

Figure 250: Oceania Market Attractiveness by Sorce, 2022 to 2032

Figure 251: Oceania Market Attractiveness by Sales Channel, 2022 to 2032

Figure 252: Oceania Market Attractiveness by Country, 2022 to 2032

Figure 253: MEA Market Value (US$ Million) by Application, 2022 to 2032

Figure 254: MEA Market Value (US$ Million) by End Use, 2022 to 2032

Figure 255: MEA Market Value (US$ Million) by Form, 2022 to 2032

Figure 256: MEA Market Value (US$ Million) by Sorce, 2022 to 2032

Figure 257: MEA Market Value (US$ Million) by Sales Channel, 2022 to 2032

Figure 258: MEA Market Value (US$ Million) by Country, 2022 to 2032

Figure 259: MEA Market Value (US$ Million) Analysis by Country, 2017 to 2032

Figure 260: MEA Market Volume(Units) Analysis by Country, 2017 to 2032

Figure 261: MEA Market Value Share (%) and BPS Analysis by Country, 2022 to 2032

Figure 262: MEA Market Y-o-Y Growth (%) Projections by Country, 2022 to 2032

Figure 263: MEA Market Value (US$ Million) Analysis by Application, 2017 to 2032

Figure 264: MEA Market Volume(Units) Analysis by Application, 2017 to 2032

Figure 265: MEA Market Value Share (%) and BPS Analysis by Application, 2022 to 2032

Figure 266: MEA Market Y-o-Y Growth (%) Projections by Application, 2022 to 2032

Figure 267: MEA Market Value (US$ Million) Analysis by End Use, 2017 to 2032

Figure 268: MEA Market Volume(Units) Analysis by End Use, 2017 to 2032

Figure 269: MEA Market Value Share (%) and BPS Analysis by End Use, 2022 to 2032

Figure 270: MEA Market Y-o-Y Growth (%) Projections by End Use, 2022 to 2032

Figure 271: MEA Market Value (US$ Million) Analysis by Form, 2017 to 2032

Figure 272: MEA Market Volume(Units) Analysis by Form, 2017 to 2032

Figure 273: MEA Market Value Share (%) and BPS Analysis by Form, 2022 to 2032

Figure 274: MEA Market Y-o-Y Growth (%) Projections by Form, 2022 to 2032

Figure 275: MEA Market Value (US$ Million) Analysis by Source, 2017 to 2032

Figure 276: MEA Market Volume(Units) Analysis by Source, 2017 to 2032

Figure 277: MEA Market Value Share (%) and BPS Analysis by Source, 2022 to 2032

Figure 278: MEA Market Y-o-Y Growth (%) Projections by Source, 2022 to 2032

Figure 279: MEA Market Value (US$ Million) Analysis by Sales Channel, 2017 to 2032

Figure 280: MEA Market Volume(Units) Analysis by Sales Channel, 2017 to 2032

Figure 281: MEA Market Value Share (%) and BPS Analysis by Sales Channel, 2022 to 2032

Figure 282: MEA Market Y-o-Y Growth (%) Projections by Sales Channel, 2022 to 2032

Figure 283: MEA Market Attractiveness by Application, 2022 to 2032

Figure 284: MEA Market Attractiveness by End Use, 2022 to 2032

Figure 285: MEA Market Attractiveness by Form, 2022 to 2032

Figure 286: MEA Market Attractiveness by Source, 2022 to 2032

Figure 287: MEA Market Attractiveness by Sales Channel, 2022 to 2032

Figure 288: MEA Market Attractiveness by Country, 2022 to 2032

Explore Consumer Product Insights

View Reports

Glyceryl Caprylate Market