Reports

- Global Locations -

Headquarters

Future Market Insights, Inc.

Christiana Corporate, 200
Continental Drive, Suite 401,
Newark, Delaware - 19713,
United States

T: +1-845-579-5705

Americas

Future Market Insights, Inc.

616 Corporate Way, Suite 2-9018,
Valley Cottage, NY 10989, United States

T: +1-347-918-3531

MEA

Future Market Insights

1602-6 Jumeirah Bay X2 Tower, Plot No: JLT-PH2-X2A,
Jumeirah Lakes Towers, Dubai,
United Arab Emirates

Europe

Future Market Insights

3rd Floor, 207 Regent Street,
W1B 3HH London
United Kingdom

T: + 44 (0) 20 8123 9659
D: +44 (0) 20 3287 4268

Asia Pacific

Future Market Insights

IndiaLand Global Tech Park, Unit UG-1, Behind Grand HighStreet, Phase 1, Hinjawadi, MH, Pune – 411057, India

Fragrance Product Market Outlook from 2024 to 2034

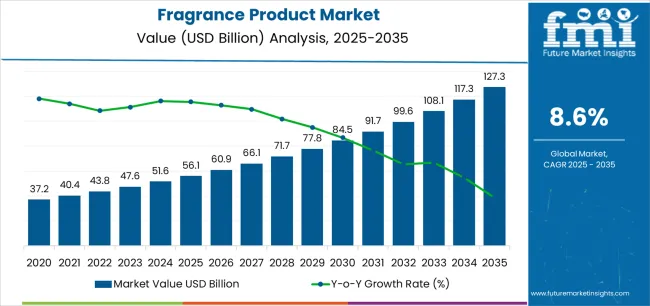
The fragrance product market is projected to be valued at US$ 51.43 billion by 2024 and rise to US$ 121.75 billion by 2034. The fragrance products are predicted to rise at a promising CAGR of 9% from 2024 to 2034.

Attributes Key Insights
Estimated Market Size in 2024 US$ 51.43 billion
Projected Market Value in 2034 US$ 121.75 billion
Value-based CAGR from 2024 to 2034 9%

Don't pay for what you don't need

Customize your report by selecting specific countries or regions and save 30%!

Key Trends and Highlights

  • Increasing demand for natural and organic fragrance products due to rising consumer awareness regarding health and environmental concerns.
  • Growth of niche and artisanal fragrance brands catering to specific consumer preferences and offering unique scent experiences.
  • Adoption of personalized fragrance solutions, including bespoke fragrances and customizable scent options, driven by consumers seeking individuality and exclusivity.
  • Expansion of the fragrance market in emerging economies, fueled by rising disposable incomes and changing lifestyle patterns.

2019 to 2023 Historical Analysis vs. 2024 to 2034 Market Forecast Projections

From 2019 to 2023, the fragrance product market experienced a CAGR of 7.9%. This growth was primarily driven by increasing disposable incomes, evolving consumer preferences towards premium and niche fragrances, and introducing innovative product offerings.

Market players capitalized on the rising demand for natural and organic fragrances, personalized scent solutions, and sustainable practices to maintain their competitive edge. During this period, the market faced intense competition, fluctuating raw material prices, and regulatory pressures regarding ingredient safety and environmental impact.

Looking ahead to the forecasted period from 2024 to 2034, the fragrance product market is expected to sustain its growth momentum with a projected CAGR of 9%. Several factors, including continued economic development in emerging markets, further advancements in fragrance technology, and the growing influence of digital platforms in marketing and distribution channels fuel this optimistic outlook.

Shifting consumer preferences towards wellness-oriented and experiential fragrance products are anticipated to drive market expansion. Market participants will need to navigate evolving consumer trends, regulatory landscapes, and competitive dynamics to capitalize on emerging opportunities and sustain growth in the forecasted period. Top of Form

Historical CAGR from 2019 to 2023 7.9%
Forecast CAGR from 2024 to 2034 9%
Sneha Verghese
Sneha Verghese

Principal Consultant

Talk to Analyst

Find your sweet spots for generating winning opportunities in this market.

Fragrance Product Market Drivers

  • Continuous innovation in fragrance technology, such as personalized scent solutions and eco-friendly formulations, stimulates market expansion.
  • The growing influence of digital platforms in marketing and distribution channels enables fragrance brands to reach wider audiences and enhance consumer engagement.
  • Rising interest in wellness-oriented products, including aromatherapy benefits of fragrances, is creating new market opportunities.

Fragrance Product Market Challenges

  • Fluctuations in raw material prices, especially for natural ingredients, impact production costs and profit margins for fragrance manufacturers.
  • Stringent regulations regarding ingredient safety, environmental impact, and labeling requirements present compliance challenges for fragrance companies.
  • Rapidly changing consumer trends and preferences require agility and adaptability from fragrance brands to meet evolving demands.

Get the data you need at a Fraction of the cost

Personalize your report by choosing insights you need
and save 40%!

Comparative View of Adjacent Markets

Future Market Insights has compared three markets, namely the fragrance diffuser market and the fragrance emulsifier market are below. Consumers seek convenient and continuous ways to disperse fragrances within their living spaces, contributing to the growth of the fragrance diffuser market.

As consumer preferences shift towards lighter and more natural product formulations, the demand for fragrance emulsifiers to create stable water-based fragrances is expected to rise steadily.

Fragrance Product Market:

Attributes Fragrance Product Market
CAGR from 2024 to 2034 9%
Key Trend Consumers are increasingly seeking unique and personalized fragrance experiences, driving the trend of customizable fragrance products.
Growth Factor The growing awareness of health and environmental concerns fuels the demand for natural and organic fragrance products.

Fragrance Diffuser Market:

Attributes Fragrance Diffuser Market
CAGR from 2022 to 2032 7.08%
Key Trend The fragrance diffuser market is witnessing a trend towards the integration of smart technology, such as app-controlled diffusers and IoT-enabled devices.
Growth Factor The growing emphasis on creating relaxing and inviting home environments is driving the demand for fragrance diffusers.

Fragrance Emulsifier Market:

Attributes Fragrance Emulsifier Market
CAGR from 2023 to 2033 3.4%
Key Trends A key trend in the fragrance emulsifier market is the shift towards sustainable formulations.
Growth Factor The fragrance emulsifier market benefits from expanding the cosmetics and personal care industry.

Country-wise Analysis

The provided table illustrates the top five countries in terms of revenue, with India holding a prominent position in the market.

Fragrances play a significant role in Indian customs, rituals, and daily life, making them an integral part of the cultural fabric. This cultural affinity towards fragrances fuels a strong demand for fragrance products across various segments, including perfumes, incense sticks, aromatic oils, and scented personal care items.

The diverse consumer base, growing disposable incomes, and evolving consumer preferences contribute to the market growth and leadership position in the fragrance industry.

Countries Forecast CAGRs from 2024 to 2034
The United States 6.3%
Canada 7.3%
Italy 6.1%
China 7.6%
India 8%

Cosmetics and Personal Care Industry Surges the United States Market

In the United States, the fragrance product market finds extensive usage across various sectors. It is prominently utilized in the cosmetics and personal care industry, where fragrances are incorporated into products such as perfumes, colognes, body sprays, and scented lotions.

The home fragrance segment is significant, with consumers frequently using fragrance products such as candles, reed diffusers, and room sprays to create pleasant indoor environments. Fragrances are also utilized in household cleaning products, air fresheners, and laundry detergents, catering to consumer preferences for pleasant scents in their daily lives.

Canada is considered a Home Fragrance Segment

Similar to the United States, fragrance products in Canada are widely used across multiple sectors. In the personal care industry, fragrances are integral components of perfumes, body mists, and skin care products, appealing to consumers' desire for enhanced grooming and self-expression.

The home fragrance market is growing steadily, driven by the demand for ambient scenting solutions such as diffusers, scented candles, and room sprays to create cozy and inviting living spaces. Fragrances are also utilized in household cleaning products and air care solutions to impart freshness and cleanliness.

Luxury Cosmetics and Perfumery Sector Booms the Market Growth in Italy

Italy has a rich tradition in the fragrance industry, with fragrances deeply embedded in various aspects of life. In Italy, fragrance products are extensively used in the luxury cosmetics and perfumery sector, where Italian brands are renowned for their craftsmanship and artistry in creating exquisite fragrances. Perfumes, colognes, and scented skincare products are highly sought after by Italian consumers, reflecting their appreciation for quality and sophistication.

Fragrances play a significant role in Italian culture, with scented candles and home fragrances commonly used to enhance the ambiance of homes and public spaces, especially during social gatherings and festivities.

Personal Care and Home Decor Trends Boom the China Market

The fragrance product market in China is experiencing rapid growth, driven by increasing urbanization, rising disposable incomes, and evolving consumer lifestyles.

Fragrances are primarily utilized in the personal care sector, with perfumes, body sprays, and scented skincare products gaining popularity among Chinese consumers seeking self-expression and luxury experiences.

The home fragrance market is expanding, fueled by the growing trend of home decor and wellness, with consumers incorporating diffusers, scented candles, and room sprays to create tranquil and harmonious living environments. Fragrances are also used in air care products and luxury household items, catering to consumers' desire for premium and functional products.

Cultural and Religious Traditions Fuel the Market in India

In India, the fragrance product market is diverse and multifaceted, with fragrances deeply ingrained in the cultural and religious traditions of the country. Fragrances are extensively used in the personal care industry, with perfumes, deodorants, and scented body lotions popular among Indian consumers, especially the youth segment.

Fragrances play a significant role in spiritual and religious practices, with incense sticks, aromatic oils, and floral waters commonly used in rituals and ceremonies across different communities. The home fragrance market is growing steadily, with consumers adopting diffusers, scented candles, and air fresheners to create pleasant and inviting home environments.

Category-wise Insights

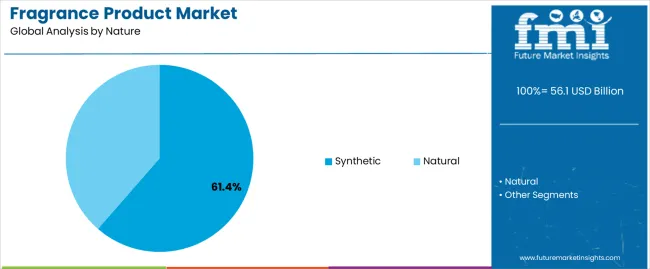
The below section shows the leading segment. Based on nature, the synthetic segment is accounted to hold a market share of 32.6% in 2024. Based on the distribution channel, the offline segment is anticipated to hold a market share of 79.4% in 2024.

Synthetic fragrances can be produced at a lower cost compared to natural alternatives, making them more accessible to a wider range of consumers. The offline distribution channel has continued its dominance and is driven by the unique sensory experiences and personalized services it offers consumers.

Category Market Share in 2024
Synthetic 32.6%
Offline 79.4%

Synthetic Segment to Hold a Significant Share in the Market

Based on nature, the synthetic segment holds a significant market share of 32.6%. This indicates that a considerable portion of fragrance products available in the market are synthesized rather than derived from natural sources. Synthetic fragrances are created through chemical processes to mimic natural scents or develop new fragrances.

The substantial share suggests a strong demand for synthetic fragrances due to cost-effectiveness, consistency in scent, and versatility in creating a wide range of fragrance options to cater to diverse consumer preferences.

Offline Segment to Hold a Dominant Share in the Market

Based on distribution channels, the offline segment is projected to dominate, with a market share of 79.4% in 2024. Offline distribution channels include brick-and-mortar stores such as specialty fragrance shops, department stores, supermarkets, and pharmacies.

The dominance highlights the continued significance of traditional retail channels in the fragrance industry despite the growing influence of e-commerce. Consumers often prefer offline channels for fragrance purchases as they provide opportunities for sensory experiences, such as sampling and testing fragrances before making a purchase. Offline channels offer personalized assistance from sales representatives, fostering consumer trust and satisfaction.
Competitive Landscape

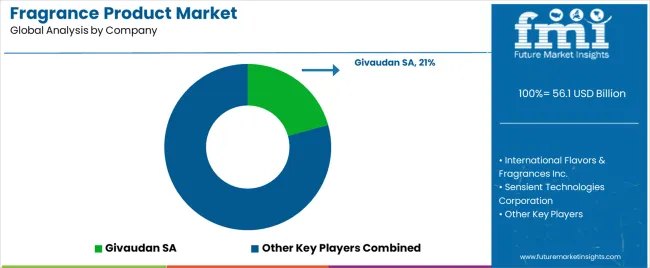
The competitive landscape of the fragrance product market is characterized by a diverse array of players ranging from global fragrance houses to niche artisanal brands.

Smaller players are gaining traction by offering unique and innovative fragrance formulations tailored to specific consumer preferences. The market is also witnessing increased competition from direct-to-consumer brands leveraging digital platforms for marketing and distribution.

Some of the key developments

  • In November 2022, Coty Inc. introduced Chloé Rose Naturelle Intense, marking the debut of their refillable perfume line. The innovative design of the refillable bottles aims to reduce environmental impacts throughout the product's lifecycle, aligning with sustainability goals.
  • In July 2022, Chanel SA launched two new fragrances: Gabrielle Chanel Eau de Parfum and Gabrielle Chanel Essence Twist & Spray. The Eau de Parfum is exclusively offered online, while the Essence Twist & Spray is available in domestic markets and select global travel retail outlets, expanding Chanel's fragrance offerings across different distribution channels.

Key Coverage of Fragrance Product Market Report

  • Adjacent Study on Fragrance Product Market, Fragrance Market Size, Flavors and Fragrances Market Size
  • Fragrance Product Market Size, Current Insights, and Demographic Trends
  • Fragrance and Perfume Industry Market Growth Analysis
  • Global Fragrance Market Growth Opportunities
  • Sales Forecast for India Perfume Market

Report Scope

Attributes Details
Estimated Market Size in 2024 US$ 51.43 billion
Projected Market Valuation in 2034 US$ 121.75 billion
Value-based CAGR 2024 to 2034 9%
Forecast Period 2024 to 2034
Historical Data Available for 2019 to 2023
Market Analysis Value in US$ billion
Key Regions Covered
  • North America
  • Latin America
  • Western Europe
  • Eastern Europe
  • South Asia and Pacific
  • East Asia
  • Middle East and Africa
Key Market Segments Covered
  • Nature
  • Application
  • Fragrance Type
  • Region
Key Countries Profiled
  • The United States
  • Canada
  • Brazil
  • Mexico
  • Germany
  • The United Kingdom
  • France
  • Spain
  • Italy
  • Russia
  • Poland
  • Czech Republic
  • Romania
  • India
  • Bangladesh
  • Australia
  • New Zealand
  • China
  • Japan
  • South Korea
  • GCC countries
  • South Africa
  • Israel
Key Companies Profiled
  • International Flavors & Fragrances Inc.
  • Sensient Technologies Corporation
  • Givaudan SA
  • Symrise AG
  • Firmenich International SA
  • Takasago International Corporation
  • Avon Products, Inc.
  • CavinKare Pvt. Ltd
  • Henkel AG & Co.
  • Lion Corporation

Fragrance Product Market - Key Segments

By Nature:

  • Natural
  • Synthetic

By Application:

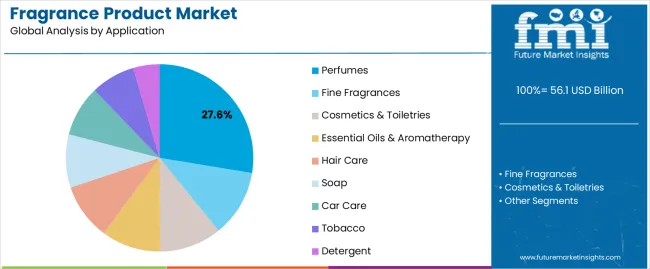
  • Perfumes
  • Fine Fragrances
  • Cosmetics & Toiletries
  • Essential Oils & Aromatherapy
  • Hair Care
  • Soap
  • Car Care
  • Tobacco
  • Detergent

By Fragrance Type:

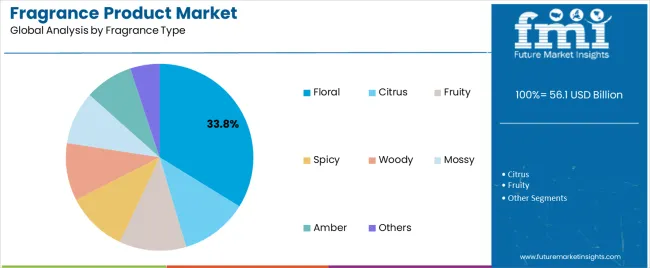
  • Citrus
  • Fruity
  • Spicy
  • Floral
  • Woody
  • Mossy
  • Amber
  • Others

By Region:

  • North America
  • Latin America
  • Western Europe
  • Eastern Europe
  • South Asia and Pacific
  • East Asia
  • The Middle East and Africa

Frequently Asked Questions

What is the expected worth of the fragrance product market in 2024?

As of 2024, the market for fragrance product is expected to be valued at US$ 51.43 billion.

What is the anticipated market value for the fragrance product in 2034?

By 2034, the market value of the fragrance product is expected to reach US$ 121.75 billion.

What is the projected forecast CAGR for the fragrance product market from 2024 to 2034?

From 2024 to 2034, the fragrance product market is expected to flourish at a CAGR of 9%

Based on nature, which segment dominates the fragrance product market?

The synthetic segment is accounted to hold a market share of 32.6% in 2024.

Which country is likely to dominate the fragrance product market?

India is likely the top-performing market, with a CAGR of 8%.

Table of Content

1. Executive Summary

    1.1. Global Market Outlook

    1.2. Demand-side Trends

    1.3. Supply-side Trends

    1.4. Technology Roadmap Analysis

    1.5. Analysis and Recommendations

2. Market Overview

    2.1. Market Coverage / Taxonomy

    2.2. Market Definition / Scope / Limitations

3. Market Background

    3.1. Market Dynamics

        3.1.1. Drivers

        3.1.2. Restraints

        3.1.3. Opportunity

        3.1.4. Trends

    3.2. Scenario Forecast

        3.2.1. Demand in Optimistic Scenario

        3.2.2. Demand in Likely Scenario

        3.2.3. Demand in Conservative Scenario

    3.3. Opportunity Map Analysis

    3.4. Product Life Cycle Analysis

    3.5. Supply Chain Analysis

        3.5.1. Supply Side Participants and their Roles

            3.5.1.1. Manufacturer

            3.5.1.2. Mid-Level Participants (Traders)

            3.5.1.3. Distributors

        3.5.2. Value Added and Value Created at Node in the Supply Chain

        3.5.3. List of Raw Material Suppliers

        3.5.4. List of Existing and Potential Buyer’s

    3.6. Investment Feasibility Matrix

    3.7. Value Chain Analysis

        3.7.1. Profit Margin Analysis

        3.7.2. Distributors

    3.8. PESTLE and Porter’s Analysis

    3.9. Regulatory Landscape

        3.9.1. By Key Regions

        3.9.2. By Key Countries

    3.10. Regional Parent Market Outlook

    3.11. Production and Consumption Statistics

    3.12. Import and Export Statistics

4. Global Market Analysis 2019 to 2023 and Forecast, 2024 to 2034

    4.1. Historical Market Size Value (US$ Million) & Volume (Tons) Analysis, 2019 to 2023

    4.2. Current and Future Market Size Value (US$ Million) & Volume (Tons) Projections, 2024 to 2034

        4.2.1. Y-o-Y Growth Trend Analysis

        4.2.2. Absolute $ Opportunity Analysis

5. Global Market Analysis 2019 to 2023 and Forecast 2024 to 2034, By Nature

    5.1. Introduction / Key Findings

    5.2. Historical Market Size Value (US$ Million) & Volume (Tons) Analysis By Nature, 2019 to 2023

    5.3. Current and Future Market Size Value (US$ Million) & Volume (Tons) Analysis and Forecast By Nature, 2024 to 2034

        5.3.1. Natural

        5.3.2. Synthetic

    5.4. Y-o-Y Growth Trend Analysis By Nature, 2019 to 2023

    5.5. Absolute $ Opportunity Analysis By Nature, 2024 to 2034

6. Global Market Analysis 2019 to 2023 and Forecast 2024 to 2034, By Application

    6.1. Introduction / Key Findings

    6.2. Historical Market Size Value (US$ Million) & Volume (Tons) Analysis By Application, 2019 to 2023

    6.3. Current and Future Market Size Value (US$ Million) & Volume (Tons) Analysis and Forecast By Application, 2024 to 2034

        6.3.1. Perfumes

        6.3.2. Fine Fragrances

        6.3.3. Cosmetics & Toiletries

        6.3.4. Essential Oils & Aromatherapy

        6.3.5. Hair Care

        6.3.6. Soap

        6.3.7. Car Care

        6.3.8. Tobacco

        6.3.9. Detergent

    6.4. Y-o-Y Growth Trend Analysis By Application, 2019 to 2023

    6.5. Absolute $ Opportunity Analysis By Application, 2024 to 2034

7. Global Market Analysis 2019 to 2023 and Forecast 2024 to 2034, By Fragrance Type

    7.1. Introduction / Key Findings

    7.2. Historical Market Size Value (US$ Million) & Volume (Tons) Analysis By Fragrance Type, 2019 to 2023

    7.3. Current and Future Market Size Value (US$ Million) & Volume (Tons) Analysis and Forecast By Fragrance Type, 2024 to 2034

        7.3.1. Citrus

        7.3.2. Fruity

        7.3.3. Spicy

        7.3.4. Floral

        7.3.5. Woody

        7.3.6. Mossy

        7.3.7. Amber

        7.3.8. Others

    7.4. Y-o-Y Growth Trend Analysis By Fragrance Type, 2019 to 2023

    7.5. Absolute $ Opportunity Analysis By Fragrance Type, 2024 to 2034

8. Global Market Analysis 2019 to 2023 and Forecast 2024 to 2034, By Region

    8.1. Introduction

    8.2. Historical Market Size Value (US$ Million) & Volume (Tons) Analysis By Region, 2019 to 2023

    8.3. Current Market Size Value (US$ Million) & Volume (Tons) Analysis and Forecast By Region, 2024 to 2034

        8.3.1. North America

        8.3.2. Latin America

        8.3.3. Western Europe

        8.3.4. Eastern Europe

        8.3.5. South Asia and Pacific

        8.3.6. East Asia

        8.3.7. Middle East and Africa

    8.4. Market Attractiveness Analysis By Region

9. North America Market Analysis 2019 to 2023 and Forecast 2024 to 2034, By Country

    9.1. Historical Market Size Value (US$ Million) & Volume (Tons) Trend Analysis By Market Taxonomy, 2019 to 2023

    9.2. Market Size Value (US$ Million) & Volume (Tons) Forecast By Market Taxonomy, 2024 to 2034

        9.2.1. By Country

            9.2.1.1. USA

            9.2.1.2. Canada

        9.2.2. By Nature

        9.2.3. By Application

        9.2.4. By Fragrance Type

    9.3. Market Attractiveness Analysis

        9.3.1. By Country

        9.3.2. By Nature

        9.3.3. By Application

        9.3.4. By Fragrance Type

    9.4. Key Takeaways

10. Latin America Market Analysis 2019 to 2023 and Forecast 2024 to 2034, By Country

    10.1. Historical Market Size Value (US$ Million) & Volume (Tons) Trend Analysis By Market Taxonomy, 2019 to 2023

    10.2. Market Size Value (US$ Million) & Volume (Tons) Forecast By Market Taxonomy, 2024 to 2034

        10.2.1. By Country

            10.2.1.1. Brazil

            10.2.1.2. Mexico

            10.2.1.3. Rest of Latin America

        10.2.2. By Nature

        10.2.3. By Application

        10.2.4. By Fragrance Type

    10.3. Market Attractiveness Analysis

        10.3.1. By Country

        10.3.2. By Nature

        10.3.3. By Application

        10.3.4. By Fragrance Type

    10.4. Key Takeaways

11. Western Europe Market Analysis 2019 to 2023 and Forecast 2024 to 2034, By Country

    11.1. Historical Market Size Value (US$ Million) & Volume (Tons) Trend Analysis By Market Taxonomy, 2019 to 2023

    11.2. Market Size Value (US$ Million) & Volume (Tons) Forecast By Market Taxonomy, 2024 to 2034

        11.2.1. By Country

            11.2.1.1. Germany

            11.2.1.2. UK

            11.2.1.3. France

            11.2.1.4. Spain

            11.2.1.5. Italy

            11.2.1.6. Rest of Western Europe

        11.2.2. By Nature

        11.2.3. By Application

        11.2.4. By Fragrance Type

    11.3. Market Attractiveness Analysis

        11.3.1. By Country

        11.3.2. By Nature

        11.3.3. By Application

        11.3.4. By Fragrance Type

    11.4. Key Takeaways

12. Eastern Europe Market Analysis 2019 to 2023 and Forecast 2024 to 2034, By Country

    12.1. Historical Market Size Value (US$ Million) & Volume (Tons) Trend Analysis By Market Taxonomy, 2019 to 2023

    12.2. Market Size Value (US$ Million) & Volume (Tons) Forecast By Market Taxonomy, 2024 to 2034

        12.2.1. By Country

            12.2.1.1. Poland

            12.2.1.2. Russia

            12.2.1.3. Czech Republic

            12.2.1.4. Romania

            12.2.1.5. Rest of Eastern Europe

        12.2.2. By Nature

        12.2.3. By Application

        12.2.4. By Fragrance Type

    12.3. Market Attractiveness Analysis

        12.3.1. By Country

        12.3.2. By Nature

        12.3.3. By Application

        12.3.4. By Fragrance Type

    12.4. Key Takeaways

13. South Asia and Pacific Market Analysis 2019 to 2023 and Forecast 2024 to 2034, By Country

    13.1. Historical Market Size Value (US$ Million) & Volume (Tons) Trend Analysis By Market Taxonomy, 2019 to 2023

    13.2. Market Size Value (US$ Million) & Volume (Tons) Forecast By Market Taxonomy, 2024 to 2034

        13.2.1. By Country

            13.2.1.1. India

            13.2.1.2. Bangladesh

            13.2.1.3. Australia

            13.2.1.4. New Zealand

            13.2.1.5. Rest of South Asia and Pacific

        13.2.2. By Nature

        13.2.3. By Application

        13.2.4. By Fragrance Type

    13.3. Market Attractiveness Analysis

        13.3.1. By Country

        13.3.2. By Nature

        13.3.3. By Application

        13.3.4. By Fragrance Type

    13.4. Key Takeaways

14. East Asia Market Analysis 2019 to 2023 and Forecast 2024 to 2034, By Country

    14.1. Historical Market Size Value (US$ Million) & Volume (Tons) Trend Analysis By Market Taxonomy, 2019 to 2023

    14.2. Market Size Value (US$ Million) & Volume (Tons) Forecast By Market Taxonomy, 2024 to 2034

        14.2.1. By Country

            14.2.1.1. China

            14.2.1.2. Japan

            14.2.1.3. South Korea

        14.2.2. By Nature

        14.2.3. By Application

        14.2.4. By Fragrance Type

    14.3. Market Attractiveness Analysis

        14.3.1. By Country

        14.3.2. By Nature

        14.3.3. By Application

        14.3.4. By Fragrance Type

    14.4. Key Takeaways

15. Middle East and Africa Market Analysis 2019 to 2023 and Forecast 2024 to 2034, By Country

    15.1. Historical Market Size Value (US$ Million) & Volume (Tons) Trend Analysis By Market Taxonomy, 2019 to 2023

    15.2. Market Size Value (US$ Million) & Volume (Tons) Forecast By Market Taxonomy, 2024 to 2034

        15.2.1. By Country

            15.2.1.1. GCC Countries

            15.2.1.2. South Africa

            15.2.1.3. Israel

            15.2.1.4. Rest of MEA

        15.2.2. By Nature

        15.2.3. By Application

        15.2.4. By Fragrance Type

    15.3. Market Attractiveness Analysis

        15.3.1. By Country

        15.3.2. By Nature

        15.3.3. By Application

        15.3.4. By Fragrance Type

    15.4. Key Takeaways

16. Key Countries Market Analysis

    16.1. USA

        16.1.1. Pricing Analysis

        16.1.2. Market Share Analysis, 2023

            16.1.2.1. By Nature

            16.1.2.2. By Application

            16.1.2.3. By Fragrance Type

    16.2. Canada

        16.2.1. Pricing Analysis

        16.2.2. Market Share Analysis, 2023

            16.2.2.1. By Nature

            16.2.2.2. By Application

            16.2.2.3. By Fragrance Type

    16.3. Brazil

        16.3.1. Pricing Analysis

        16.3.2. Market Share Analysis, 2023

            16.3.2.1. By Nature

            16.3.2.2. By Application

            16.3.2.3. By Fragrance Type

    16.4. Mexico

        16.4.1. Pricing Analysis

        16.4.2. Market Share Analysis, 2023

            16.4.2.1. By Nature

            16.4.2.2. By Application

            16.4.2.3. By Fragrance Type

    16.5. Germany

        16.5.1. Pricing Analysis

        16.5.2. Market Share Analysis, 2023

            16.5.2.1. By Nature

            16.5.2.2. By Application

            16.5.2.3. By Fragrance Type

    16.6. UK

        16.6.1. Pricing Analysis

        16.6.2. Market Share Analysis, 2023

            16.6.2.1. By Nature

            16.6.2.2. By Application

            16.6.2.3. By Fragrance Type

    16.7. France

        16.7.1. Pricing Analysis

        16.7.2. Market Share Analysis, 2023

            16.7.2.1. By Nature

            16.7.2.2. By Application

            16.7.2.3. By Fragrance Type

    16.8. Spain

        16.8.1. Pricing Analysis

        16.8.2. Market Share Analysis, 2023

            16.8.2.1. By Nature

            16.8.2.2. By Application

            16.8.2.3. By Fragrance Type

    16.9. Italy

        16.9.1. Pricing Analysis

        16.9.2. Market Share Analysis, 2023

            16.9.2.1. By Nature

            16.9.2.2. By Application

            16.9.2.3. By Fragrance Type

    16.10. Poland

        16.10.1. Pricing Analysis

        16.10.2. Market Share Analysis, 2023

            16.10.2.1. By Nature

            16.10.2.2. By Application

            16.10.2.3. By Fragrance Type

    16.11. Russia

        16.11.1. Pricing Analysis

        16.11.2. Market Share Analysis, 2023

            16.11.2.1. By Nature

            16.11.2.2. By Application

            16.11.2.3. By Fragrance Type

    16.12. Czech Republic

        16.12.1. Pricing Analysis

        16.12.2. Market Share Analysis, 2023

            16.12.2.1. By Nature

            16.12.2.2. By Application

            16.12.2.3. By Fragrance Type

    16.13. Romania

        16.13.1. Pricing Analysis

        16.13.2. Market Share Analysis, 2023

            16.13.2.1. By Nature

            16.13.2.2. By Application

            16.13.2.3. By Fragrance Type

    16.14. India

        16.14.1. Pricing Analysis

        16.14.2. Market Share Analysis, 2023

            16.14.2.1. By Nature

            16.14.2.2. By Application

            16.14.2.3. By Fragrance Type

    16.15. Bangladesh

        16.15.1. Pricing Analysis

        16.15.2. Market Share Analysis, 2023

            16.15.2.1. By Nature

            16.15.2.2. By Application

            16.15.2.3. By Fragrance Type

    16.16. Australia

        16.16.1. Pricing Analysis

        16.16.2. Market Share Analysis, 2023

            16.16.2.1. By Nature

            16.16.2.2. By Application

            16.16.2.3. By Fragrance Type

    16.17. New Zealand

        16.17.1. Pricing Analysis

        16.17.2. Market Share Analysis, 2023

            16.17.2.1. By Nature

            16.17.2.2. By Application

            16.17.2.3. By Fragrance Type

    16.18. China

        16.18.1. Pricing Analysis

        16.18.2. Market Share Analysis, 2023

            16.18.2.1. By Nature

            16.18.2.2. By Application

            16.18.2.3. By Fragrance Type

    16.19. Japan

        16.19.1. Pricing Analysis

        16.19.2. Market Share Analysis, 2023

            16.19.2.1. By Nature

            16.19.2.2. By Application

            16.19.2.3. By Fragrance Type

    16.20. South Korea

        16.20.1. Pricing Analysis

        16.20.2. Market Share Analysis, 2023

            16.20.2.1. By Nature

            16.20.2.2. By Application

            16.20.2.3. By Fragrance Type

    16.21. GCC Countries

        16.21.1. Pricing Analysis

        16.21.2. Market Share Analysis, 2023

            16.21.2.1. By Nature

            16.21.2.2. By Application

            16.21.2.3. By Fragrance Type

    16.22. South Africa

        16.22.1. Pricing Analysis

        16.22.2. Market Share Analysis, 2023

            16.22.2.1. By Nature

            16.22.2.2. By Application

            16.22.2.3. By Fragrance Type

    16.23. Israel

        16.23.1. Pricing Analysis

        16.23.2. Market Share Analysis, 2023

            16.23.2.1. By Nature

            16.23.2.2. By Application

            16.23.2.3. By Fragrance Type

17. Market Structure Analysis

    17.1. Competition Dashboard

    17.2. Competition Benchmarking

    17.3. Market Share Analysis of Top Players

        17.3.1. By Regional

        17.3.2. By Nature

        17.3.3. By Application

        17.3.4. By Fragrance Type

18. Competition Analysis

    18.1. Competition Deep Dive

        18.1.1. International Flavors & Fragrances Inc

            18.1.1.1. Overview

            18.1.1.2. Product Portfolio

            18.1.1.3. Profitability by Market Segments

            18.1.1.4. Sales Footprint

            18.1.1.5. Strategy Overview

                18.1.1.5.1. Marketing Strategy

                18.1.1.5.2. Product Strategy

                18.1.1.5.3. Channel Strategy

        18.1.2. Sensient Technologies Corporation

            18.1.2.1. Overview

            18.1.2.2. Product Portfolio

            18.1.2.3. Profitability by Market Segments

            18.1.2.4. Sales Footprint

            18.1.2.5. Strategy Overview

                18.1.2.5.1. Marketing Strategy

                18.1.2.5.2. Product Strategy

                18.1.2.5.3. Channel Strategy

        18.1.3. Givaudan SA

            18.1.3.1. Overview

            18.1.3.2. Product Portfolio

            18.1.3.3. Profitability by Market Segments

            18.1.3.4. Sales Footprint

            18.1.3.5. Strategy Overview

                18.1.3.5.1. Marketing Strategy

                18.1.3.5.2. Product Strategy

                18.1.3.5.3. Channel Strategy

        18.1.4. Symrise AG

            18.1.4.1. Overview

            18.1.4.2. Product Portfolio

            18.1.4.3. Profitability by Market Segments

            18.1.4.4. Sales Footprint

            18.1.4.5. Strategy Overview

                18.1.4.5.1. Marketing Strategy

                18.1.4.5.2. Product Strategy

                18.1.4.5.3. Channel Strategy

        18.1.5. Firmenich International SA

            18.1.5.1. Overview

            18.1.5.2. Product Portfolio

            18.1.5.3. Profitability by Market Segments

            18.1.5.4. Sales Footprint

            18.1.5.5. Strategy Overview

                18.1.5.5.1. Marketing Strategy

                18.1.5.5.2. Product Strategy

                18.1.5.5.3. Channel Strategy

        18.1.6. Takasago International Corporation

            18.1.6.1. Overview

            18.1.6.2. Product Portfolio

            18.1.6.3. Profitability by Market Segments

            18.1.6.4. Sales Footprint

            18.1.6.5. Strategy Overview

                18.1.6.5.1. Marketing Strategy

                18.1.6.5.2. Product Strategy

                18.1.6.5.3. Channel Strategy

        18.1.7. Avon Products, Inc.

            18.1.7.1. Overview

            18.1.7.2. Product Portfolio

            18.1.7.3. Profitability by Market Segments

            18.1.7.4. Sales Footprint

            18.1.7.5. Strategy Overview

                18.1.7.5.1. Marketing Strategy

                18.1.7.5.2. Product Strategy

                18.1.7.5.3. Channel Strategy

        18.1.8. CavinKare Pvt. Ltd

            18.1.8.1. Overview

            18.1.8.2. Product Portfolio

            18.1.8.3. Profitability by Market Segments

            18.1.8.4. Sales Footprint

            18.1.8.5. Strategy Overview

                18.1.8.5.1. Marketing Strategy

                18.1.8.5.2. Product Strategy

                18.1.8.5.3. Channel Strategy

        18.1.9. Henkel AG & Co.

            18.1.9.1. Overview

            18.1.9.2. Product Portfolio

            18.1.9.3. Profitability by Market Segments

            18.1.9.4. Sales Footprint

            18.1.9.5. Strategy Overview

                18.1.9.5.1. Marketing Strategy

                18.1.9.5.2. Product Strategy

                18.1.9.5.3. Channel Strategy

        18.1.10. Lion Corporation

            18.1.10.1. Overview

            18.1.10.2. Product Portfolio

            18.1.10.3. Profitability by Market Segments

            18.1.10.4. Sales Footprint

            18.1.10.5. Strategy Overview

                18.1.10.5.1. Marketing Strategy

                18.1.10.5.2. Product Strategy

                18.1.10.5.3. Channel Strategy

19. Assumptions & Acronyms Used

20. Research Methodology

Don't pay for what you don't need

Customize your report by selecting specific countries or regions and save 30%!

List of Tables

Table 1: Global Market Value (US$ Million) Forecast by Region, 2019 to 2034

Table 2: Global Market Volume (Tons) Forecast by Region, 2019 to 2034

Table 3: Global Market Value (US$ Million) Forecast by Nature, 2019 to 2034

Table 4: Global Market Volume (Tons) Forecast by Nature, 2019 to 2034

Table 5: Global Market Value (US$ Million) Forecast by Application, 2019 to 2034

Table 6: Global Market Volume (Tons) Forecast by Application, 2019 to 2034

Table 7: Global Market Value (US$ Million) Forecast by Fragrance Type, 2019 to 2034

Table 8: Global Market Volume (Tons) Forecast by Fragrance Type, 2019 to 2034

Table 9: North America Market Value (US$ Million) Forecast by Country, 2019 to 2034

Table 10: North America Market Volume (Tons) Forecast by Country, 2019 to 2034

Table 11: North America Market Value (US$ Million) Forecast by Nature, 2019 to 2034

Table 12: North America Market Volume (Tons) Forecast by Nature, 2019 to 2034

Table 13: North America Market Value (US$ Million) Forecast by Application, 2019 to 2034

Table 14: North America Market Volume (Tons) Forecast by Application, 2019 to 2034

Table 15: North America Market Value (US$ Million) Forecast by Fragrance Type, 2019 to 2034

Table 16: North America Market Volume (Tons) Forecast by Fragrance Type, 2019 to 2034

Table 17: Latin America Market Value (US$ Million) Forecast by Country, 2019 to 2034

Table 18: Latin America Market Volume (Tons) Forecast by Country, 2019 to 2034

Table 19: Latin America Market Value (US$ Million) Forecast by Nature, 2019 to 2034

Table 20: Latin America Market Volume (Tons) Forecast by Nature, 2019 to 2034

Table 21: Latin America Market Value (US$ Million) Forecast by Application, 2019 to 2034

Table 22: Latin America Market Volume (Tons) Forecast by Application, 2019 to 2034

Table 23: Latin America Market Value (US$ Million) Forecast by Fragrance Type, 2019 to 2034

Table 24: Latin America Market Volume (Tons) Forecast by Fragrance Type, 2019 to 2034

Table 25: Western Europe Market Value (US$ Million) Forecast by Country, 2019 to 2034

Table 26: Western Europe Market Volume (Tons) Forecast by Country, 2019 to 2034

Table 27: Western Europe Market Value (US$ Million) Forecast by Nature, 2019 to 2034

Table 28: Western Europe Market Volume (Tons) Forecast by Nature, 2019 to 2034

Table 29: Western Europe Market Value (US$ Million) Forecast by Application, 2019 to 2034

Table 30: Western Europe Market Volume (Tons) Forecast by Application, 2019 to 2034

Table 31: Western Europe Market Value (US$ Million) Forecast by Fragrance Type, 2019 to 2034

Table 32: Western Europe Market Volume (Tons) Forecast by Fragrance Type, 2019 to 2034

Table 33: Eastern Europe Market Value (US$ Million) Forecast by Country, 2019 to 2034

Table 34: Eastern Europe Market Volume (Tons) Forecast by Country, 2019 to 2034

Table 35: Eastern Europe Market Value (US$ Million) Forecast by Nature, 2019 to 2034

Table 36: Eastern Europe Market Volume (Tons) Forecast by Nature, 2019 to 2034

Table 37: Eastern Europe Market Value (US$ Million) Forecast by Application, 2019 to 2034

Table 38: Eastern Europe Market Volume (Tons) Forecast by Application, 2019 to 2034

Table 39: Eastern Europe Market Value (US$ Million) Forecast by Fragrance Type, 2019 to 2034

Table 40: Eastern Europe Market Volume (Tons) Forecast by Fragrance Type, 2019 to 2034

Table 41: South Asia and Pacific Market Value (US$ Million) Forecast by Country, 2019 to 2034

Table 42: South Asia and Pacific Market Volume (Tons) Forecast by Country, 2019 to 2034

Table 43: South Asia and Pacific Market Value (US$ Million) Forecast by Nature, 2019 to 2034

Table 44: South Asia and Pacific Market Volume (Tons) Forecast by Nature, 2019 to 2034

Table 45: South Asia and Pacific Market Value (US$ Million) Forecast by Application, 2019 to 2034

Table 46: South Asia and Pacific Market Volume (Tons) Forecast by Application, 2019 to 2034

Table 47: South Asia and Pacific Market Value (US$ Million) Forecast by Fragrance Type, 2019 to 2034

Table 48: South Asia and Pacific Market Volume (Tons) Forecast by Fragrance Type, 2019 to 2034

Table 49: East Asia Market Value (US$ Million) Forecast by Country, 2019 to 2034

Table 50: East Asia Market Volume (Tons) Forecast by Country, 2019 to 2034

Table 51: East Asia Market Value (US$ Million) Forecast by Nature, 2019 to 2034

Table 52: East Asia Market Volume (Tons) Forecast by Nature, 2019 to 2034

Table 53: East Asia Market Value (US$ Million) Forecast by Application, 2019 to 2034

Table 54: East Asia Market Volume (Tons) Forecast by Application, 2019 to 2034

Table 55: East Asia Market Value (US$ Million) Forecast by Fragrance Type, 2019 to 2034

Table 56: East Asia Market Volume (Tons) Forecast by Fragrance Type, 2019 to 2034

Table 57: Middle East and Africa Market Value (US$ Million) Forecast by Country, 2019 to 2034

Table 58: Middle East and Africa Market Volume (Tons) Forecast by Country, 2019 to 2034

Table 59: Middle East and Africa Market Value (US$ Million) Forecast by Nature, 2019 to 2034

Table 60: Middle East and Africa Market Volume (Tons) Forecast by Nature, 2019 to 2034

Table 61: Middle East and Africa Market Value (US$ Million) Forecast by Application, 2019 to 2034

Table 62: Middle East and Africa Market Volume (Tons) Forecast by Application, 2019 to 2034

Table 63: Middle East and Africa Market Value (US$ Million) Forecast by Fragrance Type, 2019 to 2034

Table 64: Middle East and Africa Market Volume (Tons) Forecast by Fragrance Type, 2019 to 2034
Sneha Verghese
Sneha Verghese

Principal Consultant

Talk to Analyst

Find your sweet spots for generating winning opportunities in this market.

List of Charts

Figure 1: Global Market Value (US$ Million) by Nature, 2024 to 2034

Figure 2: Global Market Value (US$ Million) by Application, 2024 to 2034

Figure 3: Global Market Value (US$ Million) by Fragrance Type, 2024 to 2034

Figure 4: Global Market Value (US$ Million) by Region, 2024 to 2034

Figure 5: Global Market Value (US$ Million) Analysis by Region, 2019 to 2034

Figure 6: Global Market Volume (Tons) Analysis by Region, 2019 to 2034

Figure 7: Global Market Value Share (%) and BPS Analysis by Region, 2024 to 2034

Figure 8: Global Market Y-o-Y Growth (%) Projections by Region, 2024 to 2034

Figure 9: Global Market Value (US$ Million) Analysis by Nature, 2019 to 2034

Figure 10: Global Market Volume (Tons) Analysis by Nature, 2019 to 2034

Figure 11: Global Market Value Share (%) and BPS Analysis by Nature, 2024 to 2034

Figure 12: Global Market Y-o-Y Growth (%) Projections by Nature, 2024 to 2034

Figure 13: Global Market Value (US$ Million) Analysis by Application, 2019 to 2034

Figure 14: Global Market Volume (Tons) Analysis by Application, 2019 to 2034

Figure 15: Global Market Value Share (%) and BPS Analysis by Application, 2024 to 2034

Figure 16: Global Market Y-o-Y Growth (%) Projections by Application, 2024 to 2034

Figure 17: Global Market Value (US$ Million) Analysis by Fragrance Type, 2019 to 2034

Figure 18: Global Market Volume (Tons) Analysis by Fragrance Type, 2019 to 2034

Figure 19: Global Market Value Share (%) and BPS Analysis by Fragrance Type, 2024 to 2034

Figure 20: Global Market Y-o-Y Growth (%) Projections by Fragrance Type, 2024 to 2034

Figure 21: Global Market Attractiveness by Nature, 2024 to 2034

Figure 22: Global Market Attractiveness by Application, 2024 to 2034

Figure 23: Global Market Attractiveness by Fragrance Type, 2024 to 2034

Figure 24: Global Market Attractiveness by Region, 2024 to 2034

Figure 25: North America Market Value (US$ Million) by Nature, 2024 to 2034

Figure 26: North America Market Value (US$ Million) by Application, 2024 to 2034

Figure 27: North America Market Value (US$ Million) by Fragrance Type, 2024 to 2034

Figure 28: North America Market Value (US$ Million) by Country, 2024 to 2034

Figure 29: North America Market Value (US$ Million) Analysis by Country, 2019 to 2034

Figure 30: North America Market Volume (Tons) Analysis by Country, 2019 to 2034

Figure 31: North America Market Value Share (%) and BPS Analysis by Country, 2024 to 2034

Figure 32: North America Market Y-o-Y Growth (%) Projections by Country, 2024 to 2034

Figure 33: North America Market Value (US$ Million) Analysis by Nature, 2019 to 2034

Figure 34: North America Market Volume (Tons) Analysis by Nature, 2019 to 2034

Figure 35: North America Market Value Share (%) and BPS Analysis by Nature, 2024 to 2034

Figure 36: North America Market Y-o-Y Growth (%) Projections by Nature, 2024 to 2034

Figure 37: North America Market Value (US$ Million) Analysis by Application, 2019 to 2034

Figure 38: North America Market Volume (Tons) Analysis by Application, 2019 to 2034

Figure 39: North America Market Value Share (%) and BPS Analysis by Application, 2024 to 2034

Figure 40: North America Market Y-o-Y Growth (%) Projections by Application, 2024 to 2034

Figure 41: North America Market Value (US$ Million) Analysis by Fragrance Type, 2019 to 2034

Figure 42: North America Market Volume (Tons) Analysis by Fragrance Type, 2019 to 2034

Figure 43: North America Market Value Share (%) and BPS Analysis by Fragrance Type, 2024 to 2034

Figure 44: North America Market Y-o-Y Growth (%) Projections by Fragrance Type, 2024 to 2034

Figure 45: North America Market Attractiveness by Nature, 2024 to 2034

Figure 46: North America Market Attractiveness by Application, 2024 to 2034

Figure 47: North America Market Attractiveness by Fragrance Type, 2024 to 2034

Figure 48: North America Market Attractiveness by Country, 2024 to 2034

Figure 49: Latin America Market Value (US$ Million) by Nature, 2024 to 2034

Figure 50: Latin America Market Value (US$ Million) by Application, 2024 to 2034

Figure 51: Latin America Market Value (US$ Million) by Fragrance Type, 2024 to 2034

Figure 52: Latin America Market Value (US$ Million) by Country, 2024 to 2034

Figure 53: Latin America Market Value (US$ Million) Analysis by Country, 2019 to 2034

Figure 54: Latin America Market Volume (Tons) Analysis by Country, 2019 to 2034

Figure 55: Latin America Market Value Share (%) and BPS Analysis by Country, 2024 to 2034

Figure 56: Latin America Market Y-o-Y Growth (%) Projections by Country, 2024 to 2034

Figure 57: Latin America Market Value (US$ Million) Analysis by Nature, 2019 to 2034

Figure 58: Latin America Market Volume (Tons) Analysis by Nature, 2019 to 2034

Figure 59: Latin America Market Value Share (%) and BPS Analysis by Nature, 2024 to 2034

Figure 60: Latin America Market Y-o-Y Growth (%) Projections by Nature, 2024 to 2034

Figure 61: Latin America Market Value (US$ Million) Analysis by Application, 2019 to 2034

Figure 62: Latin America Market Volume (Tons) Analysis by Application, 2019 to 2034

Figure 63: Latin America Market Value Share (%) and BPS Analysis by Application, 2024 to 2034

Figure 64: Latin America Market Y-o-Y Growth (%) Projections by Application, 2024 to 2034

Figure 65: Latin America Market Value (US$ Million) Analysis by Fragrance Type, 2019 to 2034

Figure 66: Latin America Market Volume (Tons) Analysis by Fragrance Type, 2019 to 2034

Figure 67: Latin America Market Value Share (%) and BPS Analysis by Fragrance Type, 2024 to 2034

Figure 68: Latin America Market Y-o-Y Growth (%) Projections by Fragrance Type, 2024 to 2034

Figure 69: Latin America Market Attractiveness by Nature, 2024 to 2034

Figure 70: Latin America Market Attractiveness by Application, 2024 to 2034

Figure 71: Latin America Market Attractiveness by Fragrance Type, 2024 to 2034

Figure 72: Latin America Market Attractiveness by Country, 2024 to 2034

Figure 73: Western Europe Market Value (US$ Million) by Nature, 2024 to 2034

Figure 74: Western Europe Market Value (US$ Million) by Application, 2024 to 2034

Figure 75: Western Europe Market Value (US$ Million) by Fragrance Type, 2024 to 2034

Figure 76: Western Europe Market Value (US$ Million) by Country, 2024 to 2034

Figure 77: Western Europe Market Value (US$ Million) Analysis by Country, 2019 to 2034

Figure 78: Western Europe Market Volume (Tons) Analysis by Country, 2019 to 2034

Figure 79: Western Europe Market Value Share (%) and BPS Analysis by Country, 2024 to 2034

Figure 80: Western Europe Market Y-o-Y Growth (%) Projections by Country, 2024 to 2034

Figure 81: Western Europe Market Value (US$ Million) Analysis by Nature, 2019 to 2034

Figure 82: Western Europe Market Volume (Tons) Analysis by Nature, 2019 to 2034

Figure 83: Western Europe Market Value Share (%) and BPS Analysis by Nature, 2024 to 2034

Figure 84: Western Europe Market Y-o-Y Growth (%) Projections by Nature, 2024 to 2034

Figure 85: Western Europe Market Value (US$ Million) Analysis by Application, 2019 to 2034

Figure 86: Western Europe Market Volume (Tons) Analysis by Application, 2019 to 2034

Figure 87: Western Europe Market Value Share (%) and BPS Analysis by Application, 2024 to 2034

Figure 88: Western Europe Market Y-o-Y Growth (%) Projections by Application, 2024 to 2034

Figure 89: Western Europe Market Value (US$ Million) Analysis by Fragrance Type, 2019 to 2034

Figure 90: Western Europe Market Volume (Tons) Analysis by Fragrance Type, 2019 to 2034

Figure 91: Western Europe Market Value Share (%) and BPS Analysis by Fragrance Type, 2024 to 2034

Figure 92: Western Europe Market Y-o-Y Growth (%) Projections by Fragrance Type, 2024 to 2034

Figure 93: Western Europe Market Attractiveness by Nature, 2024 to 2034

Figure 94: Western Europe Market Attractiveness by Application, 2024 to 2034

Figure 95: Western Europe Market Attractiveness by Fragrance Type, 2024 to 2034

Figure 96: Western Europe Market Attractiveness by Country, 2024 to 2034

Figure 97: Eastern Europe Market Value (US$ Million) by Nature, 2024 to 2034

Figure 98: Eastern Europe Market Value (US$ Million) by Application, 2024 to 2034

Figure 99: Eastern Europe Market Value (US$ Million) by Fragrance Type, 2024 to 2034

Figure 100: Eastern Europe Market Value (US$ Million) by Country, 2024 to 2034

Figure 101: Eastern Europe Market Value (US$ Million) Analysis by Country, 2019 to 2034

Figure 102: Eastern Europe Market Volume (Tons) Analysis by Country, 2019 to 2034

Figure 103: Eastern Europe Market Value Share (%) and BPS Analysis by Country, 2024 to 2034

Figure 104: Eastern Europe Market Y-o-Y Growth (%) Projections by Country, 2024 to 2034

Figure 105: Eastern Europe Market Value (US$ Million) Analysis by Nature, 2019 to 2034

Figure 106: Eastern Europe Market Volume (Tons) Analysis by Nature, 2019 to 2034

Figure 107: Eastern Europe Market Value Share (%) and BPS Analysis by Nature, 2024 to 2034

Figure 108: Eastern Europe Market Y-o-Y Growth (%) Projections by Nature, 2024 to 2034

Figure 109: Eastern Europe Market Value (US$ Million) Analysis by Application, 2019 to 2034

Figure 110: Eastern Europe Market Volume (Tons) Analysis by Application, 2019 to 2034

Figure 111: Eastern Europe Market Value Share (%) and BPS Analysis by Application, 2024 to 2034

Figure 112: Eastern Europe Market Y-o-Y Growth (%) Projections by Application, 2024 to 2034

Figure 113: Eastern Europe Market Value (US$ Million) Analysis by Fragrance Type, 2019 to 2034

Figure 114: Eastern Europe Market Volume (Tons) Analysis by Fragrance Type, 2019 to 2034

Figure 115: Eastern Europe Market Value Share (%) and BPS Analysis by Fragrance Type, 2024 to 2034

Figure 116: Eastern Europe Market Y-o-Y Growth (%) Projections by Fragrance Type, 2024 to 2034

Figure 117: Eastern Europe Market Attractiveness by Nature, 2024 to 2034

Figure 118: Eastern Europe Market Attractiveness by Application, 2024 to 2034

Figure 119: Eastern Europe Market Attractiveness by Fragrance Type, 2024 to 2034

Figure 120: Eastern Europe Market Attractiveness by Country, 2024 to 2034

Figure 121: South Asia and Pacific Market Value (US$ Million) by Nature, 2024 to 2034

Figure 122: South Asia and Pacific Market Value (US$ Million) by Application, 2024 to 2034

Figure 123: South Asia and Pacific Market Value (US$ Million) by Fragrance Type, 2024 to 2034

Figure 124: South Asia and Pacific Market Value (US$ Million) by Country, 2024 to 2034

Figure 125: South Asia and Pacific Market Value (US$ Million) Analysis by Country, 2019 to 2034

Figure 126: South Asia and Pacific Market Volume (Tons) Analysis by Country, 2019 to 2034

Figure 127: South Asia and Pacific Market Value Share (%) and BPS Analysis by Country, 2024 to 2034

Figure 128: South Asia and Pacific Market Y-o-Y Growth (%) Projections by Country, 2024 to 2034

Figure 129: South Asia and Pacific Market Value (US$ Million) Analysis by Nature, 2019 to 2034

Figure 130: South Asia and Pacific Market Volume (Tons) Analysis by Nature, 2019 to 2034

Figure 131: South Asia and Pacific Market Value Share (%) and BPS Analysis by Nature, 2024 to 2034

Figure 132: South Asia and Pacific Market Y-o-Y Growth (%) Projections by Nature, 2024 to 2034

Figure 133: South Asia and Pacific Market Value (US$ Million) Analysis by Application, 2019 to 2034

Figure 134: South Asia and Pacific Market Volume (Tons) Analysis by Application, 2019 to 2034

Figure 135: South Asia and Pacific Market Value Share (%) and BPS Analysis by Application, 2024 to 2034

Figure 136: South Asia and Pacific Market Y-o-Y Growth (%) Projections by Application, 2024 to 2034

Figure 137: South Asia and Pacific Market Value (US$ Million) Analysis by Fragrance Type, 2019 to 2034

Figure 138: South Asia and Pacific Market Volume (Tons) Analysis by Fragrance Type, 2019 to 2034

Figure 139: South Asia and Pacific Market Value Share (%) and BPS Analysis by Fragrance Type, 2024 to 2034

Figure 140: South Asia and Pacific Market Y-o-Y Growth (%) Projections by Fragrance Type, 2024 to 2034

Figure 141: South Asia and Pacific Market Attractiveness by Nature, 2024 to 2034

Figure 142: South Asia and Pacific Market Attractiveness by Application, 2024 to 2034

Figure 143: South Asia and Pacific Market Attractiveness by Fragrance Type, 2024 to 2034

Figure 144: South Asia and Pacific Market Attractiveness by Country, 2024 to 2034

Figure 145: East Asia Market Value (US$ Million) by Nature, 2024 to 2034

Figure 146: East Asia Market Value (US$ Million) by Application, 2024 to 2034

Figure 147: East Asia Market Value (US$ Million) by Fragrance Type, 2024 to 2034

Figure 148: East Asia Market Value (US$ Million) by Country, 2024 to 2034

Figure 149: East Asia Market Value (US$ Million) Analysis by Country, 2019 to 2034

Figure 150: East Asia Market Volume (Tons) Analysis by Country, 2019 to 2034

Figure 151: East Asia Market Value Share (%) and BPS Analysis by Country, 2024 to 2034

Figure 152: East Asia Market Y-o-Y Growth (%) Projections by Country, 2024 to 2034

Figure 153: East Asia Market Value (US$ Million) Analysis by Nature, 2019 to 2034

Figure 154: East Asia Market Volume (Tons) Analysis by Nature, 2019 to 2034

Figure 155: East Asia Market Value Share (%) and BPS Analysis by Nature, 2024 to 2034

Figure 156: East Asia Market Y-o-Y Growth (%) Projections by Nature, 2024 to 2034

Figure 157: East Asia Market Value (US$ Million) Analysis by Application, 2019 to 2034

Figure 158: East Asia Market Volume (Tons) Analysis by Application, 2019 to 2034

Figure 159: East Asia Market Value Share (%) and BPS Analysis by Application, 2024 to 2034

Figure 160: East Asia Market Y-o-Y Growth (%) Projections by Application, 2024 to 2034

Figure 161: East Asia Market Value (US$ Million) Analysis by Fragrance Type, 2019 to 2034

Figure 162: East Asia Market Volume (Tons) Analysis by Fragrance Type, 2019 to 2034

Figure 163: East Asia Market Value Share (%) and BPS Analysis by Fragrance Type, 2024 to 2034

Figure 164: East Asia Market Y-o-Y Growth (%) Projections by Fragrance Type, 2024 to 2034

Figure 165: East Asia Market Attractiveness by Nature, 2024 to 2034

Figure 166: East Asia Market Attractiveness by Application, 2024 to 2034

Figure 167: East Asia Market Attractiveness by Fragrance Type, 2024 to 2034

Figure 168: East Asia Market Attractiveness by Country, 2024 to 2034

Figure 169: Middle East and Africa Market Value (US$ Million) by Nature, 2024 to 2034

Figure 170: Middle East and Africa Market Value (US$ Million) by Application, 2024 to 2034

Figure 171: Middle East and Africa Market Value (US$ Million) by Fragrance Type, 2024 to 2034

Figure 172: Middle East and Africa Market Value (US$ Million) by Country, 2024 to 2034

Figure 173: Middle East and Africa Market Value (US$ Million) Analysis by Country, 2019 to 2034

Figure 174: Middle East and Africa Market Volume (Tons) Analysis by Country, 2019 to 2034

Figure 175: Middle East and Africa Market Value Share (%) and BPS Analysis by Country, 2024 to 2034

Figure 176: Middle East and Africa Market Y-o-Y Growth (%) Projections by Country, 2024 to 2034

Figure 177: Middle East and Africa Market Value (US$ Million) Analysis by Nature, 2019 to 2034

Figure 178: Middle East and Africa Market Volume (Tons) Analysis by Nature, 2019 to 2034

Figure 179: Middle East and Africa Market Value Share (%) and BPS Analysis by Nature, 2024 to 2034

Figure 180: Middle East and Africa Market Y-o-Y Growth (%) Projections by Nature, 2024 to 2034

Figure 181: Middle East and Africa Market Value (US$ Million) Analysis by Application, 2019 to 2034

Figure 182: Middle East and Africa Market Volume (Tons) Analysis by Application, 2019 to 2034

Figure 183: Middle East and Africa Market Value Share (%) and BPS Analysis by Application, 2024 to 2034

Figure 184: Middle East and Africa Market Y-o-Y Growth (%) Projections by Application, 2024 to 2034

Figure 185: Middle East and Africa Market Value (US$ Million) Analysis by Fragrance Type, 2019 to 2034

Figure 186: Middle East and Africa Market Volume (Tons) Analysis by Fragrance Type, 2019 to 2034

Figure 187: Middle East and Africa Market Value Share (%) and BPS Analysis by Fragrance Type, 2024 to 2034

Figure 188: Middle East and Africa Market Y-o-Y Growth (%) Projections by Fragrance Type, 2024 to 2034

Figure 189: Middle East and Africa Market Attractiveness by Nature, 2024 to 2034

Figure 190: Middle East and Africa Market Attractiveness by Application, 2024 to 2034

Figure 191: Middle East and Africa Market Attractiveness by Fragrance Type, 2024 to 2034

Figure 192: Middle East and Africa Market Attractiveness by Country, 2024 to 2034

Recommendations

Consumer Product

Fragrance Diffuser Market

Published : March 2024

Food and Beverage

Fragrance Emulsifier Market

Published : August 2023

Food and Beverage

Fragrance Concentrates Market

Published : October 2022

Consumer Product

Fragrant Drawer Liners Market

Published : June 2022

Explore Consumer Product Insights

View Reports